Development of Fast Neutral Particle Diagnostics and
Study of Suprathermal Ion Behaviors in LHD Plasmas
Evgeny Alexandrovitch VESHCHEV
Doctor of Philosophy
Department of Fusion Science
School of Physical Sciences
The Graduate University for Advanced Studies
Japan
2007
ABSTRACT
Analysis of energy-resolved spectra of neutral particles escaped from plasma can provide important knowledge about ion confinement and ion distribution function during different types of plasma heating such as neutral beam injection (NBI), ion cyclotron heating (ICH) or electron cyclotron heating (ECH). Such knowledge is very important for the successful development of a fusion reactor. Effective ion heating and good fast ion confinement are essential for ignition. Compared with tokamaks, studying the fast particle confinement properties in heliotrons is more complex mainly due to more complex magnetic configuration. Such a complex 3D geometry, e.g. of the Large Helical Device (LHD), may lead to appearance of additional types of confined particles (such as helically trapped particles), additional confinement effects (presence of loss- cones) and may result in more complicated drift motions. For studying fast ion confinement properties in plasma, a variety of neutral particle analyzing diagnostics have been developed on modern fusion devices. On LHD these are one-chord Compact Neutral Particle Analyzer (CNPA) and six-chord Silicon-Detector NPA (SDNPA), etc. E || B type CNPA utilizes one array of 40 detectors and measures energy and time resolved neutral particle fluxes in the energy range 1-170 keV. CNPA can be used in a combination with Tracer Encapsulated Solid Pellet (TESPEL) injector. Sightline of CNPA is very close to the nominal TESPEL trajectory, and thus active localized measurements can be made by the pellet charge exchange method. SDNPA can provide the measurements in the energy range 25-4000 keV and the aim of it is to make angle-resolved passive measurements of fast particles.
According to some theoretical estimations, in heliotron devices the transition particles may be lost from the confinement region through loss cones. The loss cones of fast particles from LHD plasma could not be measured so far by the existing diagnostics mainly due to the poor angular resolution (to make angle resolved measurements either a long time discharge or several shots with exactly similar parameters are required). To clarify the situation with loss-cones and to improve the angular resolution versus the existing SDNPA analyzer, a novel diagnostic with a much better angular resolution is required. The overview of currently used NPA diagnostics on tokamaks and heliotrons will be made in the Introductory chapter I. Among the preceding multi-sightline NPA systems used on magnetic confinement fusion devices the maximum sightline NPA systems with 6 chords of view are on LHD (currently operating SDNPA) and on former TFTR (discontinued). Thus a novel 20-sightline diagnostic based on a Angular Resolved Multi-Sightline NPA (ARMS-NPA) described in this Ph.D. thesis may become a new powerful tool in fast ion physics investigations. It can provide energy-, angle-, and time-resolved spectra of escaped fast neutral particles from the plasma. In addition to that a precise radial scan of the plasma column can be realized. The data
obtained by this new ARMS-NPA diagnostic in addition to CNPA and SDNPA experiments will help in understanding of fast particle physics in helical systems.
First measurements by ARMS-NPA diagnostic with real plasma have been made on LHD for a variety of plasma heating conditions. Angularly resolved measurements were made for co-, counter- and perpendicularly directed NBI, for ICRH and ECH regimes. Measurements were made for a wide range of varied plasma parameters such as electron density, magnetic axis position, positive and negative magnetic field directions, magnetic field strength. Obtained data demonstrate angular dependence of fast particle distribution on the type of heating and plasma parameters. Magnetic axis shift effect on the loss-cones has been noticed. Inward shifted magnetic axis configuration lead to improved fast ion confinement and uniform angular distribution (disappearance of the loss-cone). Since the naturally occurring charge exchange neutral particle source is not localized in contrast to the diagnostic neutral beam or pellet charge exchange methods, the correct interpretation of such measurements in a complex toroidal asymmetric geometry requires a
careful numerical modeling of the neutral flux formation and the knowledge of the charge- exchange target distributions, relevant cross sections and the magnetic surface structure. The measured chordintegral neutral flux calculation scheme for the LHD magnetic surface geometry is given. Calculation results are shown for measurable atomic energy spectra corresponding to heating-induced fast ion distributions from simplified Fokker-Planck models. The behavior of calculated and experimental suprathermal particle distributions in NBI and ICRF heated plasmas is discussed in the context of the experimental data interpretation. The geometry effect on the measured spectra interpretation is discussed. Results of experimental measurements are also compared with simulation results made by different codes with taking fast particle orbits into account.
TABLE OF CONTENTS
Abstract………....ii
1. Introduction: Motivation and Objectives……….….1
1.1 Overview of modern fusion devices and currently used NPA systems……… ...1
1.2 Motivation for creating a novel NPA diagnostic……….…………....……..12
1.3 Brief Summary……….………….…...16
2. Novel Angular Resolved Multi-Sightline NPA Diagnostic (experimental setup)………..17
2.1 Basic components………...17
2.2 Data acquisition system………...21
2.3 Geometry of Measurements…..……….…24
2.4 Calibration.……….…29
3. Experimental Results and Data Interpretation...31
3.1 Angular anisotropy in NBI regimes………..…..31
3.1.1 Angular dependence on NBI direction………...…..….31
3.1.2 Brief Summary ………….……….…....40
3.2 Magnetic field strength effect……….…...41
3.2.1.1. The case of negative magnetic field and co-injecting NBI1……….….41
3.2.1.2 Brief Summary…………..………..47
3.2.2.1 The case of positive magnetic field and perpendicularly injecting NBI4…...48
3.2.2.2 Brief Summary ………….………..51
3.3 ICRF effect……….…53
3.3.1.1 Experimental results in ICRF heating regimes………...…………53
3.3.1.2 Brief Summary ………….………...56
3.3.2.1 Experimental results in NBI4+ICRF heating regimes………...…...…..57
3.3.2.2 Brief Summary ………….………..60
3.4 Angular anisotropy of perpendicular region………..61
3.4.1 Experimental results with perpendicularly injecting NBI4………...62
3.4.2 Experimental results in ICRF heating regimes………..65
3.4.3 Brief Summary ………….……….68
3.5 ECH effect ………69
3.5.1 Experimental results in ECH regimes………69
3.5.2 Comparison of ECH heating effect with NBI4………...71
3.5.3 Comparison of ECH heating effect with NBI4+ICRF heating configuration...76
3.5.4 Brief Summary ………….………...80
3.6 Magnetic axis shift effect………..….81
4. Data Analysis………...83
4.1 Neutral flux calculation………...………..…83
4.1.1 Escaping atom flux formulation (neutral source function, sightline integration kernel, paths and pitch angle dependence) …..……….….83
4.1.2 Computational modeling of energy distributions .……….….86
4.1.3 Brief Summary ………….……….……….94
4.2 Fast particle spectra dependence on plasma parameters………..95
4.2.1 Influence of electron and neutral density on the fast particle spectra………….95
4.2.2 Effect of impurities on the attenuation of the fast particle flux………103
4.2.3 Brief Summary ………….………107
5. Conclusion……….108
Bibliography...110
Acknowledgements...112
1. Introduction
1.1 OVERVIEW of NPA DIAGNOSTICS
Analysis of energy-resolved spectra of neutral particles escaped from plasma can provide important knowledge about ion confinement and ion distribution function during different types of plasma heating such as neutral beam injection (NBI), ion cyclotron heating (ICH) or electron cyclotron heating (ECH). Understanding of the fast particle confinement in plasma is one of the key necessities for the successful development of a fusion reactor. For this purpose several advanced diagnostics such as Compact Neutral Particle Analyzer (CNPA) [1], Time-Of-Flight Neutral Particle Analyzer (TOF-NPA) [2] and Silicon Detector - based Neutral Particle Analyzer (SDNPA) [3] have been developed on Large Helical Device (LHD).
40 channel CNPA has only one fixed chord of observation and is intended primarily for active localized measurements and works in combination with Tracer Encapsulated Solid Pellet (TESPEL) injector [4]. In addition to that it can be used for passive neutral flux measurements. CNPA utilizes only one detector array and measures only energy resolved particles in the energy range 1÷170keV (Fig.1).
Fig.1 Measurement of escaping neutral particle energy spectra with CNPA (1÷170keV) and the observable energy range extension by neutral diamond detector NDD placed in the inlet duct near the viewing cone vertex.
Similar principle of fast particle measurements is used on Joint European Torus (JET) neutral particle analyzer [5]. The neutrals emitted from plasma are ionized in a gas stripping cell. Generated ions be means of magnetic field B and parallel to it electric field E are analyzed both in energy and mass (Fig.2). Every analyzer has two rows of 10 detectors each. They are used to detect both H and D in the same shot in this analyzer. Range of possible measured energies for H atoms are in range 0.3 - 320keV and for D atoms 0.15 – 160keV. The whole NPA diagnostic consists of 5 analyzers, four of them are mounted on a vertical tower Fig.3. Two of the analyzers can be rotated in poloidal direction as it is shown on Fig.3 and the whole set of 4 analyzers ca be rotated in toroidal direction. The fifth analyzer was installed in another location with a line-of-sight near to the last closed magnetic surface. From 1989 NPA tower was removed and a single NPA was installed at the bottom of the machine with an almost vertical line of sight to the plasma center.
Fig.2 Schematic analyzer concept.
One of NPA system on National Spherical Torus Experiment utilizes E║B spectrometer [6] which measures the energy spectra of H minority and bulk D species simultaneously with 39 energy channels per mass species and can scan plasma over a wide range of tangency angles as it is shown on Fig.4. The disadvantage of this diagnostic is the impossibility to obtain the whole plasma column scan simultaneously.
Fig.3 Side and top view of the JET NPA system.
Fig.4 Possible viewing chords of E║B spectrometer are shown with viewing chords of SSNPA array and injection lines of NB on NSTX.
Another NPA system on National Spherical Torus Experiment is based on a solid state detector (SSNPA) and consists of four viewing chords through a common vacuum flange [7]. The tangency radii of the viewing chords are 60, 90, 100 and 120 cm (Fig.4). They view across NBI lines at co-going ions. Such a diagnostic is able to scan plasma only in 4 definite directions without the possibility of scanning the plasma column.
Fig.5 Layout of the tangential charge exchange array on TFTR (top view). Also shown is the diagnostic neutral beam, which can be scanned in the mid-plane from radial injection to 40º toroidally into the field of view of the horizontal charge exchange array.
Tokamak Fusion Test Reactor (TFTR) also utilizes E║B mass and analyzer in the range 0.5≤A(amu)E(keV)≤ 600 and its design enables simultaneous mass-resolved measurements of H, D and T energy spectra during a single discharge [8]. The Charge Exchange Neutral Analyzer (CENA) diagnostic consists of two autonomous analyzer systems and one shared Diagnostic Neutral Beam (DNB). The first system is has a fan-like field of view along six sightlines in the equatorial plane and can make plasma scan in both horizontal and vertical direction (Fig.5). The second system measures perpendicular ion energy distribution and along 12 vertical chords spaced approximately equidistant across the torus minor diameter (Fig.6).
Fig.6 Elevation layout of the vertical charge exchange array on TFTR. This array consisted of two E║B spectrometers and six compact electrostatic analyzers whose sightlines intersected the diagnostic neutral beam when it was oriented for radial injection.
NPA diagnostic proposed for ITER consists of neutral beam diagnostic injector combined with 3 couples of neutral particle analyzers (NPA) (Fig. 7) [9]. The diagnostic beam is injected into the plasma almost horizontally perpendicular to the plasma axis. Each NPA couple consists of one middle energy NPA and one MeV energy NPA. They are placed along the same axis one after another in such a way that the flux of neutrals passing through the first (middle energy) NPA enters the second (MeV energy) one. Three units of NPA couples view the plasma through a vertical port. Their lines of sight intersect the diagnostic beam at the distance of 0.56m, 1.12m
and 1.62m from the plasma edge to have the measurements at three different points along the radius. One more couple of NPA’s with the line of sight along the major radius crossing the plasma centre has been added.
Fig.7 Set up of NPA diagnostics proposed in [15].DNB – diagnostic neutral beam injector.
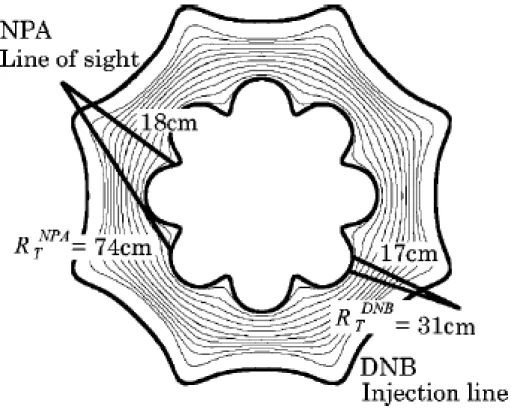
A combination of horizontally scannable DNB and NPA [10] has been used on the compact helical system (CHS) [11,12] to provide information on whether the energetic ions with different pitch angle are confined in the plasma or immediately lost. The DNB can be scanned horizontally to vary the pitch angle of ions injected as test particles. The pitch angle of the confined energetic ions is measured with the NPA. The DNB and NPA systems are installed at the outboard side on CHS. Both systems are on the equatorial plane and are separated by 180° in the toroidal direction (Fig. 8). The beam line can be scanned from perpendicular injection to tangential injection both in the co- and counter-direction with a pivot point of R=1.58 m (the plasma major and average minor radii are R=1 m and a=0.2 m, respectively). The DNB beam line is scanned near the loss cone boundary from the tangential radius (RTDNB) of 17–31 cm. Injected energetic ions are measured with the NPA at tangential radii (RTNPA) from 18 to 74 cm. The DNB and NPA systems can be scanned horizontally by 0.1° increments using a pulse motor system. Beam energy (Eb) and extracted current of the positive beam (Ib) are 28–40 keV and 2–3 A, respectively.
The DNB divergence angle measured with a calorimeter is 0.83° –95° at Eb of 30–36 keV. The beam radius at the focal point is 4.2–4.9 cm, and the averaged minor radius of CHS plasma is typically 20 cm. The NPA system consists of an electrostatic deflection plate and 16 micro-channel plates. By changing the voltage of the parallel plate of the NPA, the energy spectrum in the range of 0.1–50 keV can be measured with a maximum count rate of 1×10⁶ counts/s.
FIG. 8. Experimental set up of the DNB and NPA in CHS. The beam line and NPA line of sight on the equatorial plane are plotted.
To investigate the behavior of fast ions in Heliotron J [13], a charge-exchange (CX) neutral particle analyzer (NPA) system has been installed [14]. The experimental setup of the NBI and CX-NPA system is shown in Fig.9. Hydrogen beams are co-injected in the tangential direction with a maximum acceleration voltage of 30 kV and a maximum injection power of 0.7 MW. Here, the co-injection is defined as parallel to the equivalent toroidal plasma current. The angles between the magnetic axis and the beam lines of the NBI system are from 150 to 175 deg. The ion energy distribution functions are measured with a CX-NPA system. This CX- NPA is an E║B-type one that can measure the energy spectra of hydrogen and deuterium ion species simultaneously with ten energy channels per mass species. The
energy ranges are from 0.4 to 80 keV for hydrogen and from 0.2 to 40 keV for deuterium. The energy resolution is from 4 to 10%. The viewing area of the CX-NPA is 6 or 12 mm in the vertical direction and 58 mm in the horizontal direction at the plasma center. In order to investigate the pitch angle distribution of the fast ions in plasmas, the CX-NPA system can change the measuring angle horizontally φNPA and vertically θNPA simultaneously with the range of φNPA from -10 to +18 deg and θNPA
from -3 to +10 deg. The CX-NPA system can observe the pitch angle in the range from 98 to 135 deg on the magnetic axis in the standard configuration. As φNPA
changes 1 deg, the pitch angle of detected particles and observed point changes about 1.5 deg and 12 mm, respectively.
Fig.9 Top view of the Heliotron J and CX-NPA system.
The Mega Ampere Spherical Tokamak (MAST) is equipped with 78channel dual mass NPA diagnostic Fig.10 [15] which measures particles in the energy range 0.5<E(keV)/A(amu)<70. The NPA spatial scanning system has a tangency range from RNPA~ 133cm in the co-beam direction to RNPA~ -46cm in the counter-beam direction, and can view both NBI lines which are injected at a tangency radius Rtan, of 70cm as shown in Fig.10. Although such a system can scan plasma in quite a wide range of angles, it cannot provide the simultaneous scan of the whole plasma in from directions of equatorial plane.
On Alcator C-Mod for measuring of energetic hydrogen minority ions with energies ~ 50 – 350keV there is a four-channel compact neutral analyzer (CNPA) [16] based on operating small Si diode detectors in pulse-height analysis (PHA) mode.
Fig.10 MAST NBI and NPA layout.
Fig.11 Schematic view of the three channel vertical detector array and the system of sightlines in plasma.
The CNPA consists of three vertical and one horizontal sightlines as it is illustrated on Fig.11. The sightlines of the diagnostic are arranged such that three vertical chords view the phase space of the neutral distribution that is predicted to be most energetic, while the remaining horizontal channel sees neutrals that should be slower.
Another system used on Alcator C-Mod for neutral measurements is a neutral particle analyzer based on the time-of-flight technique and magnetic-type neutral particle analyzer [17]. Time-of-flight NPA is mounted behind magnetic-type NPA and shares the same line of sight (Fig.12). Both of them can be scanned, poloidally down to the X point and tangentially to R/R0 = 0.7.
Fig.12 Schematic side view of the time-of-flight installation with the high energy neutral particle analyzer (left) on Alcator C-Mod.
Movable TOF-NPA installed on LHD made measurements along one sightline and could scan the plasma during the discharge. The pitch angle distribution from 40° to100° can be obtained by horizontal scanning of the TOF-NPA.The disadvantage of this diagnostic is also the impossibility to obtain the whole plasma column scan simultaneously.
Another diagnostic of fast particles widely used at modern fusion devices [18-21] is based on Neutral Diamond Detector (NDD) [22-24]. The NDD has three layer structure, i.e. electrode-semiconductor (very pure natural diamond) electrode. The NDD employed in LHD [19] is a specially developed detector having a very thin graphite front electrode, which makes it possible to detect low energy particles. Incident fast particles produce electric charges inside the diamond. These charges are
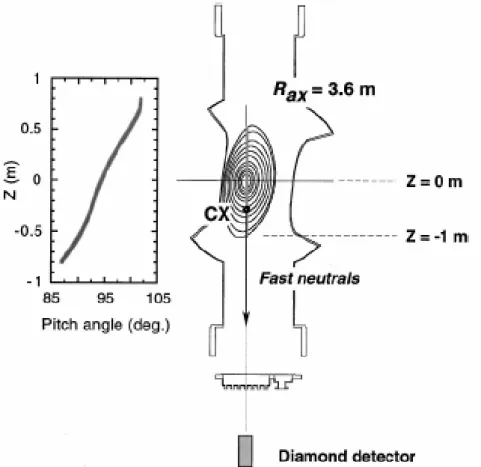
inside a stainless steel cylinder of 30 cm length to shield the detector against vacuum ultraviolet (VUV) rays and soft x rays because the NDD is sensitive to such photon radiations. In order to view the plasma, they set a circular aperture having a fixed diameter of 1 mm on the opposite end, i.e., plasma side, of the cylinder. An additional aperture whose diameter can be changed is also installed 55 cm ahead of this fixed aperture to control the neutral particle flux coming into the NDD. Two NDDs are installed on LHD. One is installed on the equatorial plane with tangential line of sight to measure ctr.-going beam ions. The distance between the NDD and the magnetic axis position is about 8.3 m in this case. Another is set on a perpendicular diagnostic port to diagnose formation of energetic ion tail produced by ICRF. A line of sight of the NDD set on a perpendicular port is shown in Fig.13. The position of the NDD is about 4.5 m below the magnetic axis position. The NDD is operated at room temperature in LHD. Because of sufficiently wide band gap (5.5 eV), it is not necessary to cool the detector to suppress thermal noise as long as we focus on detecting NB ions or ICRF-produced fast ions.
FIG. 13. Line of sight of the NDD on a perpendicular diagnostic port of LHD. The left figure shows the pitch angle distribution of fast particles detected by the NDD along the line of sight at Rax=3.6 m.
1.2 MOTIVATION FOR CREATING A NOVEL DIAGNOSTICS
As it was mentioned earlier LHD is equipped with SDNPA [2]. The aim of the SDNPA is to make angle-resolved passive measurements of fast particles. It consists of six separate ion-implanted silicon detectors. The horizontal angular resolution is 4.6 degrees and observable sector is 23 degrees (Fig.14). A vertically movable collimating aperture provides a full two-dimensional scan of the non-axisymmetric plasma. To make a precise scan of the plasma a long discharge or several short discharges with exactly similar conditions are required.
Fig.14 Side and top view of SDNPA sightlines in LHD geometry.
Top view
Side view
Although SDNPA can scan plasma by 6 sightlines, two pairs of the sightlines observe almost the same plasma regions as it can be seen from Fig.15. Detector 4 observes almost same pitch angles as detector 2. The same situation is for detector 3 and 5. Thus the angular distribution of fast particles appears to be not detailed and not complete (Fig.16).
Fig.15 Pitch angle distribution along viewing chords of SDNPA.
Fig.16 Energy spectrum measured along 6 SDNPA sightlines.
2.8 3.2 3.6 4.0 4.4 4.8 5.2
40
60
80
100
120
140
160
40
60
80
100
120
140
160
L o c a l p itc h a n g le , d e g re e s
Distance along Viewing Chord, m
Detector 1 Detector 4 Detector 2 Detector 5 Detector 3 Detector 6
SDNPA
According to some theoretical estimations, in heliotron devices the transition particles may be lost from the confinement region through a loss cone [25] as it can be seen from Fig.17. However, recent theoretical studies predict that the loss-cone in LHD configuration is substantially reduced due to taking into account highly energetic particles outside the last closed magnetic flux surface [26].
Fig.17 Typical velocity space loss regions of the heliotron configuration for different magnetic shifts, (A):5cm, (B):0cm, (C):-5cm, (D):10cm, and (E):-15cm. The maximum particle energy is 100keV and the magnetic field is 4T.
The loss cones of fast particles in LHD plasma could not be measured so far by the existing diagnostics mainly due to the poor angular resolution. To clarify the situation with loss-cones and to improve the angular resolution versus the existing SDNPA analyzer, a novel Angular Resolved Multi-Sightline NPA (ARMS-NPA) diagnostic scanning plasma by 20 sightlines has been developed. Due to significant increase of observation lines the new diagnostic should fill up the data obtained by SDNPA as it is demonstrated on Fig.18 by red lines. The range of measured pitch angles is from 60 to 160 degrees as it can be seen from Fig. 19. Local pitch angles
2.8 3.2 3.6 4.0 4.4 4.8 5.2
40
60
80
100
120
140
160
ARMS-NPA
20 channels
L o c a l Pi tc h A n g le s , d e g re e s
Distance Along Viewing Chord, m
along sightlines for two diagnostic positions were calculated from VMEC numerical solution of 3D MHD equilibrium equations assuming nested flux surfaces [27]. Red dots of Fig.19 correspond to last closed magnetic flux surface, black dots correspond to one possible diagnostic position, blue dots correspond to the second possible diagnostic position.
Fig.18 Blank spaces at energy spectrum measured along 6 SDNPA sightlines to be filled in by a new diagnostic.
Fig.19 Pitch angle distribution along viewing chords of ARMS-NPA.
1.3 Brief Summary
Among the NPA diagnostics used on tokamaks only a few can make angular resolved measurements of fast particles along several sightlines simultaneously. For example one of NPA system used on TFTR operates six sightlines in equatorial plane which are capable of being scanned in both toroidal and vertical direction [8]. Solid state neutral particle analyzer array on NSTX consists only of four viewing chords [7]. Multi-channel SDNPA on LHD can scan plasma by six sightlines [2]. Thus in the light of multi-sightline NPA systems available to make angular-resolved measurements of fast particles a new ARMS-NPA Diagnostic with its 20 channels of scanning is going to become a powerful tool for fast particles study.
2. Novel Angular Resolved Multi-Sightline NPA Diagnostic (experimental setup)
2.1 BASIC COMPONENTS
The diagnostic is based on a linear position sensitive AXUV-20EL detector [28] consisting of 20 independent sections Fig.20. This is the first time of applying AXUV detectors for fast particle measurements in plasma devices [29]. Dimensions of every detector segment are 4.5×0.75mm (Fig.20).
Fig.20 Photograph and drawing of utilized AXUV-20EL detector.
It can work in a high magnetic field, does not use high voltage and does not require such components as a stripping gas cell and a bending magnet. The simultaneous work of all sections enables measurements of energetic particles (>15keV) with 3keV energy resolution to be made along 20 sightlines. This detector positioned behind a 5 μm in diameter aperture serves as an angle resolved neutral particle analyzer (NPA) with an improved angle resolution (as good as 0.6 degrees
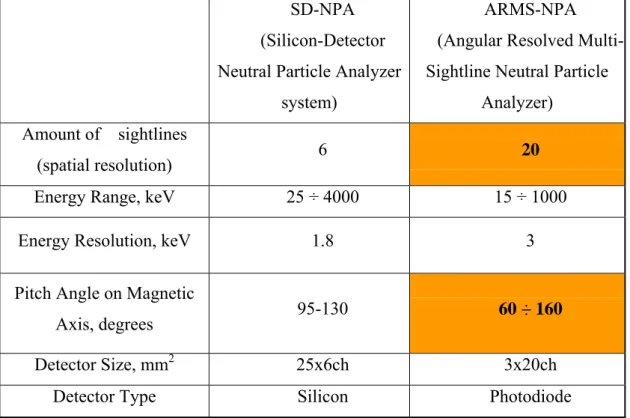
between the neighboring channels) compared to the earlier 6-chord SDNPA. Comparison of SDNPA and ARMS-NPA basic parameters are in Table1.
Table 1. Comparison of ARMS-NPA and SDNPA basic parameters.
SD-NPA (Silicon-Detector Neutral Particle Analyzer
system)
ARMS-NPA (Angular Resolved Multi- Sightline Neutral Particle
Analyzer) Amount of sightlines
(spatial resolution) 6 20
Energy Range, keV 25 ÷ 4000 15 ÷ 1000
Energy Resolution, keV 1.8 3
Pitch Angle on Magnetic
Axis, degrees 95-130 60 ÷ 160
Detector Size, mm2 25x6ch 3x20ch
Detector Type Silicon Photodiode
The aperture is mounted on a tungsten alloy plate with a small hole to prevent the excessive X-ray influence (Fig.21). In addition to that, the detector is covered by a 100 nm aluminum foil to block the visible and ultraviolet light from the plasma.
The detector, preamplifiers and buffer amplifier are very close to LHD chamber and strong magnetic field respectively. The signal level is quite low (about 2mV after preamplifier and about 20mV after buffer amplifier) it is very sensitive to electromagnetic noise. Therefore the assembly of the detector and the preamplifiers is fixed on a copper plate cooled by liquid nitrogen to reduce the thermal noise and increase the energy resolution. This assembly is mounted on a precision rotary flange (Fig.21). This allows one to set up the direction of the sheaf of 20 sightlines to scan the plasma column readily. Any choice of the diagnostic plane is possible from the vertical to the horizontal one without warming up the detector and depressurizing the diagnostic chamber.
The diagnostic design was improved by installation of the thermocouple to monitor the temperature of the assembly with detector and preamplifiers. It was attached to the
liquid nitrogen cooled copper disk on which the detector and preamplifiers are mounted. In addition to the cooling system the buffer amplifier was positioned as close as it possible to preamplifiers outputs from the chamber and every cable between preamplifier outputs are and buffer amplifier input were covered by metal braid. Such measures could reduce energy resolution of measured signal up to 2-3keV.
The new ARMS-NPA diagnostic is equipped with a special rotary mechanism (Fig.22) which allows one freely to change a diagnostic plane (Fig.23) during experiments without depressurization of the linear detector chamber.
Fig.21 Diagnostic design. Basic components.
Fig.22 ARMS-NPA chamber and special rotary mechanism.
Fig.23 Schematic view of sightlines for horizontal and vertical plasma scan.
2.2 DATA ACQUISITION SYSTEM
ARMS-NPA data acquisition structure is similar to SDNPA one, i.e. an incident particle of energy E (eV) incident on any of the detector sections produces a charge pulse of E/3.63 electron-hole pairs; this charge is collected and converted to a voltage pulse, amplified by a charge-sensitive resistive feedback preamplifier and a buffer amplifier (located outside of detector chamber), shaped by a fast pulse amplifier, processed by a PHA ADC and stored in a histogramming memory module (Fig.24). All 20 detector segments have their own data acquisition system.
Fig.24 Data acquisition system of every detector segment.
Two types of preamplifiers can be used for diagnostic of fast particles where the pulse from every particle should be processed – Transistor Reset Preamplifier (TRP) and Resistive Feedback Preamplifier (RFP). Their scheme and shape of pulses are presented on Fig. 25. Current diagnostic of fast particles utilizes RFP.
Minimum possible value of the shaping amplifier time constant was 1μs. Such a time constant appeared to be not sufficient for a quite a wide range of plasma conditions with a high flux of fast particles emitted from plasma and entering the detector. Examples of low flux case with satisfactory time constant and of high flux case with not sufficient time constant of the shaping amplifier are shown on Fig.26.
0 100 200 300 400 500 1
10 100 1000 10000
Counts
E,keV
0 100 200 300 400 500
1 10 100 1000 10000
Counts
E,keV
Fig.25 Electrical scheme of Resistive Feedback Preamplifier (RFP) and Transistor Reset Preamplifier (TRP) together with corresponding signals.
Fig.26 Example of signals for the case of a) low flux from plasma and satisfactory time constant of shaping amplifier b) pile-up effect during high flux from plasma and large time constant of shaping amplifier.
Preamplifier
Shaping Amplifier
shaping time constant
Shaping Amplifier
a)
b)
Preamplifier
In order to reduce the flux on the detector and improve the diagnostic abilities several ways are proposed:
• To modify shaping amplifier – reducing of the shaping amplifier time constant.
• To install an adjustable piezo-electrically-driven slit (Fig.27) between the aperture and the detector. Gap between slit plates may be reduced up to 5÷10μm.
• To install a thicker (0.2 μm) aluminum foil. This will allow cutting off the low energetic part of spectrum which constitutes the majority of the emitted particles.
Fig.27 Adjustable piezo-electrically-driven slit.
2.3 GEOMETRY OF MEASUREMENTS
Due to limited space on the stage near LHD the detailed design for diagnostic chamber and cooling system was prepared in 3D CAD system (Fig.28). The photograph of assembled diagnostic with cooling and vacuum system is shown on Fig.29. The ARMS-NPA-based diagnostic is located at the 9 O port of LHD vacuum vessel as it is shown on the top view on Fig.30. Black and blue lines correspond to two available positions of ARMS-NPA diagnostic. Position marked by blue color sightlines is preferable for horizontal angular-resolved scanning of plasma from perpendicular to tangential directions but vertical scan is not available due to interference of sightlines with LHD chamber. Position marked by black color sightlines is preferable for radial scan of plasma by all 20 sightlines, it can be used for horizontal angular resolved scan too but in a quite a narrow range of pitch angles (mostly perpendicular direction). Experimental data presented in current work correspond to blue colored sightlines.
Fig.28 3D view of ARMS-NPA diagnostic with cooling system.
Fig.29 Photograph of assembled for experimental measurements diagnostic with cooling and vacuum systems.
Fig.30 ARMS-NPA Diagnostic sightlines and location at LHD together with CNPA and SDNPA versus NBI, ECH and ICRF.
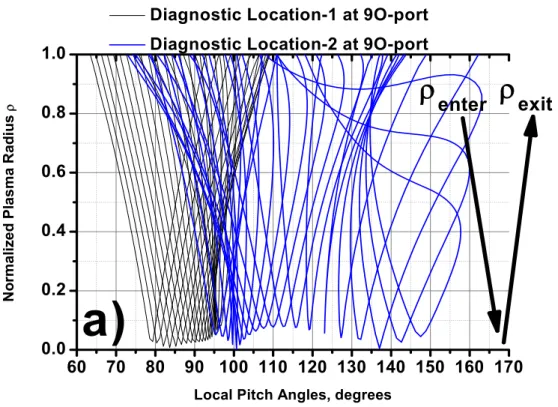
Magnetic surfaces cross-sections for all 20 sightlines and local pitch angles along sightlines for two diagnostic positions were calculated from VMEC numerical solution of 3D MHD equilibrium equations assuming nested flux surfaces [27]. The structure of magnetic surfaces is shown on Fig.31. Blue colored part of sightline is from detector segment to the central region of plasma and red colored part of sightline is from central part of plasma to the core of LHD. As it can be easily seen the path along every sightline differs from each other that may affect on the measured flux from plasma. Local pitch angles for horizontal and vertical scanning planes are presented at Fig.32. Range of angles between magnetic axis and sightlines to be measured by new diagnostic is 80º ÷ 150º.
ECH
NBI 4
New ARMS-NPA
9-O port
As the detector is a linear array, the intersection of circular magnetic axis with a flat plane of sightlines has only 2 points. Thus only 2 detector sightlines can observe the very center of plasma. The sheaf of sightlines was adjusted in such a way that all the channels to observe as closer as possible the central region of plasma.
Fig.31 Magnetic surfaces cross-sections for every detector sightline (blue part of the straight line is “detector-plasma center” line, red part is “plasma center-LHD core” line.
Fig. 32 The sheaf of pitch-angles along the sightlines: (a) horizontal diagnostic plane, blue and black lines correspond to blue and black sightlines of the Fig.30; (b) vertical diagnostic plane.
60 70 80 90 100 110 120 130 140 150 160 170 0.0
0.2 0.4 0.6 0.8 1.0
ρ
exitDiagnostic Location-1 at 9O-port Diagnostic Location-2 at 9O-port
Normalized Plasma Radiusρ
Local Pitch Angles, degrees
ρ
entera)
70 80 90 100 110 120 130
0.0
0.2
0.4
0.6
0.8
1.0
b)
ρ exit
Normalized Plasma Radiusρ
Local Pitch Angles, degrees
ρ enter
2.4 CALIBRATION
Preliminary calibration of every detector segment has been made with a radioactive source (Am-241) at room temperature. A typical calibration curve is shown on Fig.33, from which the correspondence between channel numbers and energy values can be estimated by Am-241 characteristic Roentgen peaks.
Fig.33 Typical calibration curve of every channel.
The attenuation of X-rays in a thin aluminum foil is negligible but it appears to be significant in fast particles case. These losses are negligibly differ from each other for every detector segment due to the different path lengths of particles passing through the aluminum foil at different angles on the way to the corresponding detector segments. One of the AXUV detector advantages is the absence of a doped dead- region. Thus, only the losses in the aluminum foil should be taken into account.
These energy losses for H and He particles were obtained from SRIM calculations [30, 31] and taken into account during calibration (Fig.34).
Fig.34 Fast particles energy losses in 0.1μ Al foil.
Coordinates of the detector segment centers and the aperture center were calculated from 3D CAD data. Diagnostic sightline and reference points in situ checking on LHD is to be performed.
0 50 100 150 200
0 5 10 15 20 25 30
H
He
Energy Losses in 0.1μ Al foil, keV
Initial Particle Energy, keV
3. Experimental Results and Data Interpretation
3.1 ANGULAR ANISOTROPY IN NBI REGIMES
3.1.1 Angular dependence NBI direction
First measurements by ARMS-NPA diagnostic with real plasma have been made on LHD for a variety of plasma heating conditions.
The typical energy-resolved spectrum measured along a single sightline is presented at Fig.35.
Fig.35 Energy spectrum measured along one of the 20 sightlines.
The set of such spectra along all sightlines forms the angular distribution of fast particles as it is shown in the Fig.36. For visual illustration of the flux dependence on the direction of the sightline the slope θ of every spectra was assumed as the angle between the sightline and magnetic axis. The 1st channel directed in the most tangential direction was broken in the very beginning of experimental campaign. Thus hereafter only data for 19 sightlines will be presented. Detector (preamplifier) repairing and precise positioning in situ are to be made (at the moment coordinates of the detector segments and the aperture center are calculated from three-dimensional (3D) computer-aided design (CAD) data).
0 50 100 150
0.0 0.5 1.0 1.5 2.0 2.5 3.0 3.5
0.0 0.1 0.2 0.3 0.4
0.5 NBI1
NBI2
Wp, kJ
ne 1013
cm
-3
time, s
LHD#75555
Fig.36 Energy spectrum measured along 19 sightlines. (θ is the angle between the sightline and magnetic axis).
Angular-resolved measurements were made for co- and counter-directed NBI. Time diagram of the discharge with positive-directed magnetic field (B=2.0T, Rax=3.6 m) is shown on Fig.37. Fast particle spectra were plotted for time interval 3.0÷3.2 of co-injecting NBI2 operation and 1.1÷1.3 of counter-injecting NBI1 operation.
Fig.37 Time diagram of the LHD plasma discharge.
Ch.20
θ
Ch.1
Fig.38 and Fig.39 illustrate angular behavior of fast particles for co- (NBI2) and counter- (NBI1) neutral beam injection respectively.
Fig.38 Angular dependence of neutral flux during co-injection (NBI2 case).
Fig.39 Angular dependence of neutral flux during counter-injection (NBI1 case).
Ch.3
Ch.20
Ch.20
Beam energy and injected power of NBI1is 180keV and 5.2MW correspondingly, and of NBI2 is 157keV and 3.2MW. It is necessary to remind that diagnostic is directed in the same direction as co-injector NBI2 and in opposite direction to counter-injector NBI1 (or NBI3). Thus fast particles from NBI2 must be backscattered to enter the detector. Spectra for counter injecting NBI1 clearly demonstrate angular- and energy- resolved distribution of suprathermal fast particle tail. As it can be seen from the Fig.38 angular distribution during NBI2 work is rather uniform along all sightlines except the sightlines close to perpendicular direction. Spectra for three close to perpendicular direction sightlines are plotted in Fig.40. Spectrum measured along the 20th sightline is significantly different from 19th and 18th (all other sightlines are similar to 18th). Pitch angle between the 20th sightline and magnetic axis is 85 degrees. Such effect may be due to presence of loss cone near this direction.
Fig.40 Fast particle spectra for three of the sightlines close to perpendicular direction (sightline 20 is the most perpendicular one) during co-injecting NBI2 operation (positive magnetic field).
Same effect was observed in the case of counter-injecting NBI1 operation. Fig.41. In addition to that the drop at low energetic part of the spectra was observed at sightlines close to parallel direction together with increase of high energy part of the spectra Fig.42.
20 25 30 35 40
1
10
100
sightline 20
sightline 19
sightline 18
Γ (E), r e a l c o u n ts
E, keV
Fig.41 Fast particle spectra for four of the sightlines close to perpendicular direction (sightline 20 is the most perpendicular one) during counter-injecting NBI1 operation (positive magnetic field).
Fig.42 Comparison of fast particle spectra for one of perpendicular sightlines and one of tangential sightlines during counter-injecting NBI1 operation (positive magnetic field) for the same time interval. The difference between (a) and (b) pictures is only in energy scale.
20 25 30 35 40
1
10
100 sightline 20
sightline 19
sightline 18
sightline 17
Γ (E ), r e a l c o u n ts
E, keV
50 100 150 200
1 10 100
sightline 03 (tangent.) sightline 16 (perpend.)
Γ(E), real counts
E, keV
20 25 30 35 40 45 50
1 10 100
sightline 03 (tangent.) sightline 16 (perpend.)
Γ(E)
E, keV
b)
a)
, real counts
In order to check how the magnetic field direction will influence on the angular distribution, measurements were made for NBI1 and NBI2 in B=-2.811T and R=3.65m magnetic axis configuration. In this case NBI1 is co-injecting and NBI2 is counter-injecting. Time diagrams of the discharges with NBI2 and NBI1 are shown on Fig.43 and Fig.44 correspondingly. Angular- and energy resolved spectra for these two cases are shown on Fig.45 and Fig.46 correspondingly. Fast particle spectra were restored for time intervals marked by the yellow color.
Fig.43 Time diagram of the LHD plasma discharge for the case of counter-injecting NBI2.
Fig.44 Time diagram of the LHD plasma discharge for the case of co-injecting NBI1.
Beam energy and injected power of NBI2 is 162keV and 3.6MW correspondingly, and of NBI1 is 178keV and 4.6MW. For the case of negative magnetic field direction the angular resolved spectra of fast particles don’t demonstrate suprathermal ion tail same as in the case of positive magnetic field. Effect of significant reducing of the fast particle flux still remains at the sightlines close to perpendicular direction at 80º÷85º pitch-angle range Fig.47.
0 100 200 300
0.0 0.5 1.0 1.5 2.0 2.5 3.0
0.0 0.2 0.4
0.6 NBI1
NBI2 NBI3
Wp, kJ
ne 1013 cm-3
time, s
LHD#71665
0 100 200 300
0.0 0.5 1.0 1.5 2.0 2.5 3.0
0.0 0.2 0.4 0.6
NBI1 NBI2 NBI3
Wp, kJ
n e 1013 cm-3
time, s
LHD#71650
Fig.45 Angular dependence of neutral flux during counter-injection (NBI2 case).
Fig.46 Angular dependence of neutral flux during co-injection (NBI1 case).
Ch.4
Ch.14
Ch.14
Ch.2
Fig.47 Fast particle spectra for four of the sightlines close to perpendicular direction (sightline 20 is the most perpendicular one) during counter-injecting NBI2 operation (negative magnetic field).
In addition to that the spectra along all other sightlines are not that uniform as for the case of positive magnetic field. The increase of fast particle population observed in the region of 14th sightline is reduced with more parallel direction (Fig.48).
Fig.48 Comparison of fast particle spectra for one of perpendicular sightlines and one of tangential sightlines during counter-injecting NBI2 operation (negative magnetic field).
25 30 35 40 45 50
1
10
100 sightline 20
sightline 19
sightline 18
sightline 17
Γ (E), r e a l c o u n ts
E, keV
25 30 35 40 45 50 55
1
10
100
sightline 04 (tangent.)
sightline 14 (perpend.)
Γ (E), r e a l c o u n ts
E, keV
During operation of co-injecting NBI1 in negative magnetic field, effect of significant reducing of the fast particle flux still remains at the sightlines close to perpendicular direction (Fig.49).
Fig.49 Fast particle spectra for four of the sightlines close to perpendicular direction (sightline 20 is the most perpendicular one) during co-injecting NBI1 operation (negative magnetic field).
During co-injecting NBI1 operation in the case of negative magnetic field spectra along all other sightlines are not uniform (same tendency as in positive magnetic field). Spectra demonstrate angular- and energy- resolved distribution of suprathermal fast particle tail. For the case of negative magnetic field angular range of suprathermal fast particle tail is wider than in the case of positive magnetic field (Fig.39 and Fig.46 marked by red line) This may be due to either stronger magnetic field value (in negative case) or due to larger region of confined particles during co- injecting NBI.
For negative magnetic field the drop at low energetic part of the spectra was observed at sightlines close to parallel direction together with increase of high energy part of the spectra (same as in positive magnetic field case) (Fig.50).
25 30 35 40 45 50
1
10
100 sightline 20
sightline 19
sightline 18
sightline 17
Γ (E), r e a l c o u n ts
E, keV
Fig.50 Comparison of fast particle spectra for one of perpendicular sightlines and one of tangential sightlines during counter-injecting NBI1 operation (positive magnetic field) in the same time interval. The difference between (a) and (b) pictures is only in energy scale.
3.1.2 Brief Summary
• In all cases positive or negative magnetic field direction, co- or counter NBI injection the significant reducing of the fast particle flux was observed at the sightlines close to perpendicular direction at 80º÷85º pitch- angle range. This may be due to the presence of loss-cone in this region.
• Angular distribution of fast particles depends on the type of heating, magnetic field direction and magnetic field strength.
• Co-injection is more favorable for heating from the point of view of wider angular range of suprathermal fast particle tail.
25 30 35 40 45 50 55 60
1 10 100
sightline 04 (tangent.) sightline 14 (perpend.)
Γ(E), real counts
E, keV
50 100 150 200
1 10 100
sightline 02 (tangent.) sightline 14 (perpend.)
Γ(E), real counts
E, keV
a)
b)
3.2 MAGNETIC FIELD STRENGTH EFFECT
3.2.1.1 The case of negative magnetic field and co-injecting NBI1
As it was supposed in the previous chapter magnetic field strength may affect on the fast ion confinement and their angular distribution. It was shown on the example of negative magnetic field and co-injecting NBI1. Thus experiments in negative magnetic field together with co-injecting NBI1 and with varying magnetic field strength were held to check the influence of magnetic field strength on the angular distribution and possible loss-cones in the region close to perpendicular. Magnetic axis position in all the cases was Rax = 3.6m. Three values of the magnetic field strength were chosen for demonstration B1- = -0.75T, two times increased magnetic field with B2- = -1.49T and one more time almost two times increased magnetic field B3- = -2.75T. Time diagrams of the discharges are shown at Fig.51.
B1- = - 0.75T, Rax = 3.6m
B2- = - 1.49T, Rax = 3.6m
B3- = - 2.75T, Rax = 3.6m
Fig.51 Time diagrams of LHD plasma discharge for three different magnetic field strength values B - = -0.75T, B - = -1.49T and B- = -2.75T.
0 100 200 300
0.0 0.5 1.0 1.5 2.0
0.0 0.5 1.0 1.5
NBI1
Wp, kJ
ne 1013
cm
-3
time, s
LHD#71882
0 100 200 300
0.0 0.5 1.0 1.5 2.0
0.0 0.5 1.0 1.5
NBI1
Wp, kJ
ne 1013
cm
-3
time, s
LHD#71898
0 100 200 300
2.0 2.5 3.0 3.5 4.0
0.0 0.5 1.0 1.5
NBI1
Wp, kJ
ne 1019
cm
-3
time, s
LHD#71838
B1- = -0.75T, Rax = 3.6m
B2- = -1.49T, Rax = 3.6m
B3- = -2.75T, Rax = 3.6m
Fig.52. Restored fast particle spectra for marked time intervals in three cases of negative magnetic field.
Ch.4
Ch.2
Ch.6
Ch.4
Ch.2
Ch.6
Ch.4
Ch.2
Ch.6
Ch.20
Ch.20
Ch.20
Beam energy and injected power of NBI1 for the case B1- = -0.75T was 175keV and 3.9MW correspondingly, and for the case B2- = -1.49T and B1- = -2.75T beam energy and injected power 178keV and 4.4MW. Angular- and energy resolved fast particle spectra were plotted for three cases of magnetic field strength (B1- = -0.75T, B2- = -1.49T and B3- = -2.75T) on Fig.52 in time intervals marked by yellow color at time diagrams of Fig.51. As it can be seen from these pictures increasing of magnetic field strength leads to broadening of the angular range of suprathermal fast ion tail and to increasing of supratermal fast particle population (mostly in parallel sightlines). More clearly it can be seen from the quantitative comparison of the spectra for Sightlines No 2, 4 and 6 presented on Fig.53.
Fig.53 Fast particle spectra measured along SightlineNo 2, 4 and 6 for three different magnetic field strength values B - = -0.75T, B - = -1.49T and B- = -2.75T.
20 40 60 80 100 120 140 160 180 1
10 100
SightlineNo_02
B1= -0.75T (Shot# 71898) B2= -1.49T (Shot# 71882) B3= -2.75T (Shot# 71838)
Γ(E), real counts
E, keV
20 40 60 80 100 120 140 160 180 1
10 100
SightlineNo_04
B1= -0.75T (Shot# 71898) B2= -1.49T (Shot# 71882) B3= -2.75T (Shot# 71838)
Γ(E), real counts
E, keV
20 40 60 80 100 120 140 160 180 1
10 100
SightlineNo_06
B1= -0.75T (Shot# 71898) B2= -1.49T (Shot# 71882) B3= -2.75T (Shot# 71838)
Γ(E), real counts
E, keV
Fast particle spectra of Fig.53 were corrected by the Spitzer’s slowing down time:
3 2
4 1 2
3 4 2
p e s
e e
m T n e m
τ = π Λ ,
which is equal to 0.15, 0.37 and 0.9 ms for B1-= -0.75T, B2-= -1.49T and B3-= -2.75T correspondingly.
Fig.54 Fast particle spectra measured along SightlineNo 2, 4 and 6 corrected by τs for three different magnetic field strength values B1- = -0.75T, B2- = -1.49T and B3- = - 2.75T.
20 40 60 80 100 120 140 160 180 1
10 100 1000
SightlineNo_02
B1= -0.75T (Shot# 71898) B2= -1.49T (Shot# 71882) B3= -2.75T (Shot# 71838)
Γ(E)/τ s, (real counts)/ms
E, keV
20 40 60 80 100 120 140 160 180 1
10 100 1000
SightlineNo_04
B1= -0.75T (Shot# 71898) B2= -1.49T (Shot# 71882) B3= -2.75T (Shot# 71838)
Γ(E)/τ s, (real counts)/ms
E, keV
20 40 60 80 100 120 140 160 180 1
10 100 1000
SightlineNo_06
B1= -0.75T (Shot# 71898) B2= -1.49T (Shot# 71882) B3= -2.75T (Shot# 71838)
Γ(E)/τ s, (real counts)/ms
E, keV
As it can be seen from Fig.54 the shape and absolute values of fast particle spectra are different and magnetic field strength increasing leads to improved fast particle confinement. More clearly this effect can be seen from the comparison of the sightlines close to perpendicular region (SightlineNo 20, 19, 18 and 17, where 20th sightline is the closest to perpendicular direction) on Fig.55.
Fig.55 Fast particle spectra measured along SightlineNo 20, 19, 18 and 17 corrected by τs for three different magnetic field strength values B1- = -0.75T, B2- = -1.49T and B3- = -2.75T.
Fig.54 and Fig.55 quantitatively demonstrate that fast particle population was increased in all directions and in the whole range of energies during increase of magnetic field strength. For the cases B1- = -0.75T and B2- = -1.49T average value of electron density is almost the same, thus increasing of fast particle population in all directions may deal with increasing of magnetic field strength which lead to reducing of the Larmor radius and therefore improved ion confinement. In the case of B3- = - 2.75T average value of electron density is lower that may lead to increased neutral density. That may also affect on the increasing of the flux from plasma in addition to increased magnetic field strength effect (dependence of the past particle flux from plasma on the electron density, neutral density, etc. is studied in chapter 4).
20 25 30 35 40 45 50 55 1
10 100 1000
SightlineNo_20
B1= -0.75T (Shot# 71898) B2= -1.49T (Shot# 71882) B3= -2.75T (Shot# 71838)
Γ(E)/τs, (real counts)/ms
E, keV 20 25 30 35 40 45 50 55
1 10 100 1000
SightlineNo_19
B1= -0.75T (Shot# 71898) B2= -1.49T (Shot# 71882) B3= -2.75T (Shot# 71838)
Γ(E)/τs, (real counts)/ms
E, keV
20 25 30 35 40 45 50 55 1
10 100 1000
SightlineNo_18
B1= -0.75T (Shot# 71898) B2= -1.49T (Shot# 71882) B3= -2.75T (Shot# 71838)
Γ(E)/τs, (real counts)/ms
E, keV 20 25 30 35 40 45 50 55
1 10 100 1000
SightlineNo_17
B1= -0.75T (Shot# 71898) B2= -1.49T (Shot# 71882) B3= -2.75T (Shot# 71838)
Γ(E)/τs, (real counts)/ms
E, keV