Working Papers No. 108/08
The Anglo-German Productivity Puzzle,
1895-1935: A Restatement and a
Possible Resolution
Albrecht Ritschl
© Albrecht Ritschl
London School of Economics
March 2008
Department of Economic History London School of Economics Houghton Street
London, WC2A 2AE
Tel: +44 (0) 20 7955 7860 Fax: +44 (0) 20 7955 7730
The Anglo-German Industrial Productivity Puzzle,1895-1935:A Restatement and a Possible Resolution∗
Albrecht Ritschl
Abstract
Recent research on international productivity comparisons has focused on the discrepancies between benchmark comparisons and time series extrapolations from other benchmarks. For a 1907 benchmark, Stephen Broadberry and Carsten Burhop (2007) find German manufacturing to be only slightly ahead of Britain. Their backward extrapolation from a broader 1935 benchmark is consistent with their 1907 benchmark, provided that a traditional but disputed industrial production series of Walther Hoffmann (1965) is used. If they instead employ a revised series by Ritschl (2004), they obtain an implausibly high productivity lead of 50 percent, evidence that they therefore discard. The present paper revisits this Anglo- German productivity puzzle and suggests a resolution. Drawing on Rainer Fremdling and Reiner Staeglin (2003), I present further revisions to Germany’s industrial production series. I also calculate a revised 1907 productivity benchmark. Both the revised extrapolation and the revised benchmark indicate that on the eve of World War I, German manufacturing productivity was clearly ahead of Britain.
1. Introduction
Research on international productivity comparisons has highlighted the difficulties in reconciling benchmark comparisons
across countries with backward extrapolations from other benchmarks. Whether such productivity puzzles are genuine or just the result of incomplete data exploration has been controversial.1 Recently, Stephen Broadberry and Carsten Burhop (2007) [henceforth B & B]
∗ Financial support from Deutsche Forschungsgemeinschaft under SFB 649
“Economic Risk” is gratefully acknowledged. Many thanks also go to Juliane Begenau, Maren Froemel, and Claudia Wolff for excellent research assistance. Carsten Burhop kindly provided the data underlying Broadberry and Burhop,
“Comparative Productivity”. All worksheets used in the calculation of the present paper are available on request.
1 For the Anglo-U.S. productivity comparison, see Ward and Devereux, "Measuring British Decline," and the subsequent debate, including Broadberry, "Income Levels" and Ward and Devereux, "Reply."
looked into benchmark comparisons of Anglo-German industrial productivity to evaluate two rivalling indices of German industrial
production against each other. They found that a recent revision to the German index of industrial production by Ritschl (2004) would induce an Anglo-German productivity puzzle for the pre-World War I years, while the traditional industrial output data for Germany by Walther Hoffmann (1965) does not.
This observation led B & B to discard the revised industrial production index for Germany in favour of the traditional one.
Specifically, they argued that the revised German output series yields an implausibly high German productivity lead over Britain on the eve of World War I, which is not borne out by their comparative productivity estimate for 1907. Once the older, disputed industrial output index was employed instead, the fit with the 1907 productivity benchmark was good.
A trade-off therefore seems to exist between the quality of the fit and the quality of the series employed. Hoffmann’s (1965) index of industrial production has been criticized for the implausibly high levels of industrial recovery in the late 1920s, and again in the 1930s. Among other things, it implies that output in metal-making and metal
processing was 70 percent above the pre-war level in 1929, and no less than 180 percent higher than the pre-war levels in 1938. Building on a large German literature on failed economic reconstruction after World War I, Ritschl (2004) argued that Hoffmann’s (1965) index was heavily upward biased, and was grossly inconsistent with existing evidence on iron and steel consumption, as well as with output data from the relevant subsectors. If it takes this index to reconcile
productivity benchmark comparisons between Germany and Britain, there is an Anglo-German productivity puzzle that has to be resolved.
The present paper revisits the Anglo-German industrial
productivity puzzle. To resolve it, it revises the time series evidence one more time and also recalculates the 1907 productivity benchmark. Three clear tendencies emerge from this exercise. First, the revisions to the German industrial production index by Ritschl (2004) can be further substantiated for the 1920s. Second, new evidence by Rainer Fremdling and Reiner Staeglin (2003) on armament industries hidden in Germany’s 1936 industry census suggest a slight upward revision of levels in that year. Third, careful revision of the 1907 benchmark leads to significantly higher German productivity. This is largely, but not entirely due to removing upward bias in B & B’s estimates of German employment. If similar lower cut-off levels in firm size are assumed as in Britain (and as in the 1935 benchmark), the German productivity lead becomes much more pronounced. And there is no contradiction between the corrected time series evidence and the corrected
benchmark for 1907 – in short, no Anglo-German productivity puzzle. The findings of this paper relate to a long debate about the productivity of German industry relative to Britain before and between the World Wars. An older literature, such as Alexander Gerschenkron (1962) or David Landes (1969), took it for granted that German industry had enjoyed a substantial productivity lead over Britain prior to World War I. Evidence also suggested that the comparative productivity performance of German industry was not similarly strong in the 1930s (Laszlo Rostas, 1943, 1948, and Deborah Paige and Gottfried
Bombach, 1959). All this pointed to a relative decline of German industry in the interwar period, which seemed consistent with contemporary indices of industrial production worked out by Rolf Wagenführ (1933, 1954). Pessimistic assessments of the state of German industry given by contemporary economic experts after World
War II further bolstered this view. Adam Tooze (2006) has gone as far as to argue for an industrial failure of Germany in the 1930s.
Revisions to the conventional wisdom about Anglo-German comparative productivity trends were prompted by Fremdling’s (1991) work for 1907 and by Broadberry and Fremdling’s (1990) for 1935/36. These studies found productivity in German manufacturing to be roughly at par with Britain before World War I, and slightly ahead of Britain before World War II. Broadberry (1997) related Germany’s poor industrial showing before World War I to its large peasant agriculture and its backwardness in services.
Recently, new studies have emerged, which recalculated the old results with refined methodologies and from a broader database.
Broadberry and Burhop (2007) recalculated Fremdling’s (1991)
productivity benchmark comparison for 1907 and arrived at broadly the same results. And de Herman Jong, Fremdling, and Marcel Timmer (2007) reworked the 1935 productivity benchmark. Yet in spite of an improved methodology and access to vastly better data, they again arrive at broadly the same aggregate results, important sectoral differences notwithstanding. They also found that proper adjustments of employment levels are crucial: the British industry census
methodology used in Germany in 1935/6 entailed a significantly narrower employment concept than the German workplace censuses of 1907, 1933 and 1939, because it excluded employment in small establishments, as well as seasonal and part-time industrial
employment in largely agricultural areas. My revisions to the industrial productivity benchmark of 1907 follow the same logic: I suggest
adjustments that make the coverage of German industrial employment comparable to the British census in 1907 as well.
This paper is structured as follows. Section 2 revises the
backward extrapolation of comparative Anglo-German productivity from
the 1935 benchmark in Broadberry and Burhop (2007). As in their work, the fit between the backward extrapolations and the benchmark for 1907 depends on the time series used. Yet, the differences I obtain are clearly less dramatic than in their calculations. Section 3 discusses the time series further. It finds evidence corroborating Ritschl’s (2004) corrections to the Hoffmann (1965) series for the 1920s, and suggests an upward revision to Ritschl’s data around the 1935 benchmark. Together, the revisions suggest that between 1907 and 1935 German manufacturing output rose by slightly more than Ritschl (2004)
suggested but by far less than Hoffmann’s (1965) figures would imply. Section 4 corrects and improves upon the B & B industrial productivity benchmark for 1907. The result is essentially lower employment and higher productivity. For sectors and classifications comparable to the British census, Germany’s productivity lead in 1907 was substantial. Section 5 then puts the time series and benchmark evidence together. Between the revised time series extrapolation and the revised 1907 benchmark, the Anglo-German productivity puzzle all but disappears. Section 6 summarizes the conclusions of this paper and suggests avenues for further research.
2. Restating the Productivity Puzzle
The first step toward resolving the Anglo-German productivity puzzle is to restate it. B & B employed two different indices of German industrial output in the 1935 and 1907 benchmark comparisons with Britain. The first was the traditional Hoffmann (1965) series, which Broadberry (1997) has also used. With this index, B & B find no
inconsistency between the backward extrapolation from 1935 and the productivity benchmark comparison for 1907. The alternative index relies on Ritschl’s (2004) corrections to Hoffmann’s series. When B & B
extrapolate backward from 1935 with this index, the discrepancies with the 1907 benchmark are substantial.
In addition to replicating their exercise, this section also includes the industrial production series of Wagenführ (1933), which was used semi-officially in the interwar period. The upper panel of Table 1 shows three different time series estimates of German labour productivity relative to the UK, calculated from the three indices of German
manufacturing output. All data shown in the upper panel of Table 1 are backward extrapolations from the comparative industrial productivity level of 102 (UK=100), found by Broadberry and Fremdling (1990) for 1935, and for comparable sectors of industry. Employment as well as UK output is the same as in B & B.
The backward projections in the upper panel of Table 1 all suggest a German productivity lead over Britain on the eve of World War I. Using the industrial production series of Hoffmann (1965),
Broadberry (1997) obtained a mere 6.5 percent German lead for 1907. My attempted replication of this estimate in Table 1 points to a 15 percent German productivity lead that year. When B & B use Ritschl’s (2004) correction of the Hoffmann index, they obtain a 1907
productivity lead of almost 50 percent, a puzzling result that they
discard as implausible.2 My replication of their estimate using the same data and methods finds a lower – yet still substantial – 30 percent productivity lead for 1907.3 If I use the Wagenführ (1933) index instead, the German productivity lead in 1907 is again around 30 percent.
Overall, use of the Wagenführ (1933) series and Ritschl’s (2004) revision of the Hoffmann (1965) index lead to similar results.
2 For 1895, this estimate would suggest that German industrial productivity was over 70 percent ahead of Britain, which is even harder to believe.
3 For 1895, German productivity would now be a moderate 15 percent ahead of Britain.
The lower panel of Table 1 provides an overview of the existing benchmark productivity comparisons. With a mere 95 percent of British productivity in 1907, the Fremdling (1991) benchmark is probably on the low side. The B & B benchmark for the same year suggests a modest German productivity lead of 5 percent and fits Broadberry’s (1997) time series projection for 1907 almost perfectly. The fit would still look acceptable for my reconstruction of Broadberry’s time series extrapolation with Hoffmann’s (1965) index.4 For the revised series of Ritschl (2004), as well as the Wagenführ (1933) estimate, the
discrepancy between their 30 percent productivity lead and the 5 percent suggested by the benchmark is considerable – although it is still far below the 50 percent productivity lead suggested by B & B for the Ritschl (2004) series. Yet even the remaining discrepancies are puzzling: it seems that improving the time series worsens the fit with the 1907 productivity benchmark. This discrepancy is the Anglo- German productivity puzzle.
3. Revisiting the Time Series Evidence
To resolve the productivity puzzle in Table 1 above, one strategy is to pick the series that produces the best fit, and to discard the rest. This is the option chosen by B & B, and it leaves the researcher with Hoffmann’s (1965) index for Germany. The price to be paid for this is committing to a time series that is likely to exhibit spurious growth across World War I. Ritschl (2004) examined Hoffmann’s index in the light of disaggregate industrial output data for 1913 and the late 1920s. His finding was that Hoffmann’s series for capital-goods industries did
4 Broadberry, "Manufacturing," suggests a 10 per cent error margin between a given benchmark and time series projections from a different benchmark. Evaluated against the B & B benchmark, the Hoffmann index would meet this criterion, while the others would not.
not match with existing contemporary data on machine building and related industries. To construct alternative estimates of output in the metal processing industries, he used series from the respective
industry associations, as well as a detailed commodity-flow estimate of equipment investment in the German economy by Gerhard Gehrig (1961). The resulting series were consistent with the official statistics on gross investment in Statistisches Reichsamt (1933), as well as with domestic steel consumption and machinery exports. They also fit the components in Wagenführ’s (1933) index of industrial production. But they differed sharply from Hoffmann’s (1965) estimate for the same industries.
Ritschl’s (2004) estimate (Table 2) suggests that between 1913 and 1929, output in Germany’s metal-processing sector grew by roughly 20 percent (or 30 percent if one adjusts for the loss of territory after World War I), which is roughly consistent with British data for the same period in Charles Feinstein (1972).5 In contrast, Hoffmann’s (1965) index of production for the same industry yields an output increase of 70 percent between 1913 and 1929. One reason is that Hoffmann calculated his estimate for this sector from the income side, using wage bills and assuming constant wage shares in value added. This approach towards estimating output ignores the substantial increase in labour’s bargaining power in Germany after 1918. Ritschl (1990) showed that all available estimates of German industrial output and national product except for Hoffmann’s output series imply a strong increase in wage shares between 1913 and 1929. Using the
Wagenführ (1933) industrial production index, Broadberry and Ritschl
5 The decline of industrial output through territorial losses has been estimated by Wagenführ, "Industriewirtschaft," to be around 10 percent. With an adjustment for territorial losses, German machinery output may thus have grown by slightly over 30 percent between 1913 and 1929. This would also be consistent with an estimate by the German machine industry association, the Verein Deutscher Maschinenbau- Anstalten (VDMA), Handbuch 1930.
(1995) found that the implied increase in industrial wage shares across World War I was similar to that implied by the British data. The
resulting profit squeeze in German industry between 1913 and 1929 is a classical theme in German historiography that has generated a large literature (Knut Borchardt, 1990), yet Hoffmann’s index merely
assumes it away.6 As Ritschl (2004) shows, if in Hoffmann’s index of industrial production, Hoffmann’s income estimate for metal processing is revised using contemporary data, the resulting aggregate index tracks Wagenführ’s (1933) index closely.7 The productivity
discrepancies in extrapolated German productivity shown in Table 1 thus seem to rest largely on the assumptions about metal processing industry.
Ritschl’s (2004) revisions were partly an attempt to find evidence that is independent of both the Hoffmann (1965) and the Wagenführ (1933) indices.8 The key element was constructing a new index of machine production for the period between 1913 and 1928. This new series could then be aggregated with series from other industries in the metal working sector to provide a new output estimate of the sector as a whole. Recent archival findings by Fremdling (2005) make it possible to refine this calculation further, and to substantiate its central
assumptions.
The German machine industry association, the Verein Deutscher Maschinenbau-Anstalten (VDMA) (1930), published sales figures for
6 An overview of existing estimates of industrial unit labour cost in interwar Germany is Spoerer, "German Net Investment." Tax audit data on industrial profitability have further confirmed the evidence of changing factor shares in the 1920s, see Spoerer, Scheingewinne.
7 The employment data underlying Hoffmann’s estimate have recently also come under attack, see Fremdling, "German Industrial Employment."
8 Wagenführ headed a group on industrial statistics at Berlin’s Institut für Konjunkturforschung. An updated index is included in Wagemann, ed.,
Konjunkturstatistisches Handbuch. Tooze, Statistics, provides a history of this institution, which carried out business cycle research and conducted monthly industry surveys beginning in 1928.
1913 and from 1925 to 1928. In 1928, an official industry census for machine building yielded slightly lower numbers than the VDMA for the same year. Extrapolating backwards from the 1928 census using the deflated sales data and companion data from the VDMA (1926), Ritschl (2004) arrived at slightly higher output growth in machinery than
Wagenführ (1933).9
Archival data from the VDMA reported by Fremdling (2005) pin down the growth rate of machinery output between 1913 and 1928, as well as the 1913 level (see Table 3). For the industries covered by his source, Fremdling finds sales in 1913 to be 2609.6 mill. M (see Table 3, ii), as opposed to the VDMA’s 2800 mill. M (see Table 3, i).10 The percentage discrepancy between both 1913 benchmarks is exactly equal to the percentage discrepancy between the VDMA’s own sales data for 1928 and the official census for that year (Table 3, iii).11 This suggests that the 1928 machine industry census was conducted for the same reporting group of machine producers for which Fremdling (2005) worked out the 1913 benchmark.
If so, the VDMA figures in Table 3 (i) describe growth between these benchmarks correctly, while overstating levels in both 1913 and 1928. The 1913 output within the reporting group of the 1928 machine census (Table 3, iii) must then equal Fremdling’s (2005) benchmark value of 2609.6 mill. M (Table 3, ii). If we deflate Table 3 (iii) by machinery prices (iv), real output of machinery (v) is seen to decline slightly between 1913 and 1928. The decline is very close to the data
9 By contrast, Gehrig, "Zeitreihe," interpolated machinery output between the earlier VDMA figures and the census data for 1928, neglecting the difference between the VDMA and census levels in 1928. This procedure tended to underestimate the growth in machinery output between the VDMA benchmark for 1913 and the lower census benchmark for 1928.
10 The VDMA estimate appears to have been derived from the export shares of VDMA’s members in 1913, as suspected by Fremdling, "Machine Building."
11 From Table 3 (i, ii, and iii), we obtain 2609.6/2800 = 0.932 for the 1913
benchmarks and 3728/4000 = 0.932 for the 1928 census and VDMA sales figures.
in Ritschl (2004).12 By contrast, Wagenführ’s (1933) estimates suggest a larger decline between 1913 and 1928.
Fremdling’s (2005) archival data thus confirm the existing
revisions of Hoffmann’s (1965) estimates for metal working during the 1913 to 1928 period.13 In other words, if “Hoffmann’s tales” (Fremdling, 2007) are replaced with actual data, the traditional picture reappears: profits in metal processing were much larger before the war than afterwards, and the output of this industry increased only moderately between 1913 to 1928, instead of shooting up. In any case, reverting to the original Hoffmann data no longer seems to be an option. There is solid evidence on output in the industries in question across World War I, and it tells a different story. Any time series projection of comparative productivity simply has to deal with this evidence.
Further revisions suggest themselves for the 1930s from a reassessment of Germany’s 1936 industry census by Fremdling and Staeglin (2003). According to their results, the production of military aircraft, along with some minor armament industries, is missing from the industry aggregates of this census, and is instead included in the construction sector. The industries in question employed about 168 thousand people in 1936 and generated sales of about 956 mill. RM. For aircraft industry with 145 thousand people at work, gross output was 883 mill. RM or 6067 RM per capita.14
As Table 4 reveals, in 1936 the aircraft and small firearms
industries together were slightly smaller than the auto industry in terms
12 Ritschl, "Spurious Growth," Table 3 (v), already obtains this estimate but then discards it in favor of a compromise estimate of 97.8 index points for 1928. This would accommodate the lower 1928 value of 94.1 index points of Wagenführ,
“Industriewirtschaft.”
13 Table 3 (ii) also provides Fremdling’s sales data for 1909. Deflating yields an output estimate (Table 3, iv) of 62.7, which is close to the Wagenführ’s index of 63.9 for the same year. Thus, the revisions broadly confirm Wagenführ’s index of
machinery production, except around 1928.
14 German Federal Archives, R3102/3028.
of output, but somewhat larger in terms of employment.15 Employment in these armament industries was about 28.3 percent of employment in machine building, with slightly lower productivity. There is good reason to assume that these industries are missing from the traditional
Wagenführ (1933) index and its continuation in the IfK publications – which would, after all, explain why Hoffmann (1965) chose such a
roundabout way of estimating output in the metal-processing industries. With the information now at hand, Hoffmann’s (1965) income- side estimate for the metal-processing industries can be replaced by an output estimate based on the 1935/6 benchmark. To add aircraft and armament industry to the index of industrial production for 1936, machine building seems to be the proper choice. Also, it seems plausible to assume that in the mid-1930s, machinery and aircraft production grew roughly at the same rates. If so, the index (with
1913=100) for machine building for 1935 increases by 28.3 percent, i.e. from 80.9 to 103.8 (see Table 5). 16 This neglects aircraft production in 1913, which however was still small.17
We can combine the evidence from Table 5 and the new
machinery series (Table 5, i) to recalculate output in metal-processing industry for key years from 1881 to 1935. Calculation of this series follows the same methods as in Table 2 (v) until 1929, and includes the
15 This would suggest that in terms of employment creation, the Third Reich was probably less of a story about cars, roads, and the autobahn, as in Overy, "Cars," but rather about bomber aircraft and runways.
16 Inspection of the net value added data from the 1936 census substantiates the revision. Value added in total industry (including construction, where the armament data were hidden, and utilities) in the census was 34.185 bn RM at 1936 prices, or 27.305 bn RM at 1913 prices (author’s own calculations from German Federal Archives, R3102. The GNP deflator is calculated from Ritschl, Krise und Konjunktur, Appendix B. Net value added for the same classification of industry in Hoffmann, Wachstum, p. 455, is virtually identical at 27.286 bn RM.
17 Output in 1909 was 7 zeppelins and 73 “flying machines”, see Kaiserliches Statistisches Amt, "Produktionserhebungen." Combined sales in 1909 amounted to 1.5 mill. M. This is less than 2 percent of sales in the motor industry in that year. Given the very high growth rates of the latter, it seems unlikely that the share of aircraft industry in total motor industry far exceeded 10 percent in 1913.
revised 1935 entry from Table 4 (v). This series is then aggregated with data on electrical industry, cars, and shipbuilding to yield a production index for metal-processing industry, using a procedure described in Ritschl (2004). This revised series (in Table 5, ii) is one index point higher than Ritschl’s (2004) index (in Table 5, iii) for 1929, and 13 index points higher for 1935. It implies cumulative growth of German metal-processing industry from 1913 to 1935 of 13 percent, compared to 64 percent in Hoffmann’s (1965) data (in Table 5, iv).
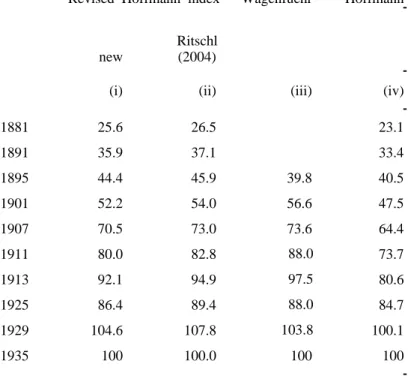
The new series can then be substituted into Hoffmann’s index of industrial production (using the procedures of Ritschl, 2004). Table 6 shows the new revision alongside the version of Ritschl (2004), as well as Hoffmann’s (1965) and Wagenführ’s (1933) original indices.18
Both the new revision and Ritschl’s (2004) version track
Wagenführ’s (1933) figures closely between 1913 and 1929. The new revision and Wagenführ (1933) seem to agree on the relative levels of 1929 and 1935, i.e. before and after the depression, while Hoffmann (1965) overstates the speed of recovery and Ritschl (2004) understates it. The net effect continues to be a drastic downward revision of
Hoffmann’s growth estimate between the benchmarks of 1907 and 1935. Cumulative growth in this period according to the new revision is 41.8 percent. This is up from 36 percent in the series of Wagenführ (1933) and 37 percent in the earlier revision of Hoffmann in Ritschl (2004). By contrast, the Hoffmann (1965) series implies a higher figure of 55.2 percent.
As a result of these revisions, the backward extrapolations of output and productivity from 1935 to 1907 will be slightly lower than the Wagenführ (1933) index or Ritschl’s (2004) data would imply. However,
18 Since details about the index weights in Wagenführ, "Industriewirtschaft," are unavailable, it is impossible to revise his index in the same way for the years before 1914.
it is still much higher than the backward extrapolation using Hoffmann (1965). Before the backward extrapolations are discussed in more detail, the next section will revise the 1907 benchmark.
4. Revisiting the 1907 productivity benchmark
The existing Anglo-German productivity benchmarks of
Fremdling (1991) and B & B are partly based on censuses undertaken in both countries in 1907. Yet as I will argue, there is a serious
mismatch in employment coverage between these two censuses, which leads to an overestimate of German employment and an underestimate of productivity. The British industry census of 1907 provides rich details on physical production, gross output, and value added, but is considerably less detailed on employment.19 In terms of coverage, the British census omits one-person establishments, small firms employing only men, as well as helping family members and an unknown percentage of outworkers in cottage industries.20 In contrast, the German workplace census of 1907 provided a full count of all employment. For comparable categories, the shortfall of the British census is between 25 and 30 percent.21
Not all German data used in the B & B productivity benchmark are from the workplace census. B & B rely also on annual industry surveys, as well as statistics on the output of taxable goods.22 For a rather limited range of industries, the annual surveys provide revenues, sometimes physical output, several cost items, and in some cases,
19 See Board of Trade, Final Report.
20 Ibid., p. iv, pp. 8-12.
21 See Kaiserliches Statistisches Amt, "Berufs- und Volkszählung."
22 See Kaiserliches Statistisches Amt, Statistisches Jahrbuch 1910, Kaiserliches Statistisches Amt, "Berufs- und Volkszählung."
employment.23 The tax statistics provide output figures for industries like beer, sugar, tobacco, and salt. For all industries, employment data by firm size are available from the 1907 workplace census.
The gaps of the German data cause problems of mutual
compatibility. Participation in the industry surveys was limited to firms included in the national disability insurance scheme. This excluded Germany’s large crafts sector, as well as most small-scale
establishments. Comparison with the firm size data in the 1907 census reveals that the surveys were often limited to firms with 50 employees or more. In contrast, the German 1907 workplace census is a full count of employment in the private sector, and provides a fairly detailed breakup of employment by establishments and lines of production.
In their productivity benchmark for 1907, B & B adhere to the industry surveys for Germany whenever possible, otherwise drawing on the tax statistics for additional output data and on the 1907
workplace census for employment. Their preferred option is to compare physical output per capita, or alternatively real output as deflated by unit value ratios. The first column of Table 7 below reproduces the results of their comparison. It shows a substantial German productivity lead in chemical industry and metal making, while the United Kingdom is seen to lead in textiles as well as in food, drink, and tobacco. On the whole, B & B find a 5 percent productivity lead in German
manufacturing over Britain. Aggregating over manufacturing and mining, B & B find German industrial productivity around 1907 to have been a mere 2 percent higher than in Britain.24
23 Employment was recorded in all industries surveyed. However, the published version of the survey reports employment only for some of the industries included. For the industries that can be matched with their British counterparts, these are mostly the chemical and metal industries, as well as leather tanning.
24 All comparative productivity estimates shown in Table 7 are based on Fisher indices using German and UK employment weights. Details on these weights are
Table 7 also reports two new productivity benchmarks for 1907, with substantial upward revisions over the B & B estimate. Averaging over these revisions, German manufacturing productivity was about 25 percent ahead of Britain. For industry including mining, Germany’s productivity lead was probably a few percentage points lower.
Corrections and revisions to the B & B productivity benchmark seem advisable for three reasons. First, some of the choices made by B & B in calculating their data for Germany would seem problematic, and a number of apparent errors need to be dealt with (see the
Appendix for a more detailed discussion). To highlight but a few points, one issue is that not all German data in the B & B benchmark are from 1907, but rather from industry surveys for 1908 or 1910. Weighed by employment, these later data dominate their estimate, with a 68 percent share for data from 1908 and another 4 percentage points for the 1910 data, respectively. Since the chemical industry and iron and steel went into recession after 1907, their productivity in 1908 and 1910 as reported in B & B is likely to understate the 1907 levels. Yet the German surveys do provide data on many of the same industries for the benchmark year of 1907. Inserting the 1907 data whenever possible, I find that the productivity estimates increase across the board. For the auto industry, I use the 1907 data in the German source used by B & B, and find productivity to be higher than in Britain.25 For the textile industries, B & B aggregate over employment in spinning and weaving on the basis of output data in spinning alone, as comparable output data for weaving are absent. This would probably provided in Appendix Table A.1. The productivity results themselves are shown in greater detail in Appendix Tables A.2 and A.4.
25 B & B deviate from their preferred methodology for iron and steel, as well as non- ferrous metals, and base their comparison on unit value ratios for different varieties. As the historical categories of steel are often inconsistent, my estimates are instead based on physical output net of pig iron output, however with very similar results. I also estimate productivity in non-ferrous metals from physical output, which results in slight downward correction.
be innocuous in the absence of foreign trade in yarn. However, given that Britain was a heavy exporter and Germany both an importer and exporter of yarn (albeit of different qualities), this procedure is likely to be misleading, as domestic yarn output is no longer a good input measure of output in weaving. Thus I rely on spinning alone.26
Moreover, the B & B employment data for Germany appear to include substantial employment in trade rather than in production, which inflates the denominator of their German productivity estimate. My reconstruction arrives at distinctly lower levels of employment in the spinning industry.
Major corrections apply to tobacco, where B & B capture only 30 percent of domestic tobacco supply in Germany, and to salt mining, where B & B report salt works instead of mines for Germany. Appendix Table A.2 (Revision Level 1) reports my version of the B & B
employment and productivity benchmark. As a result of these
corrections, German comparative productivity around the benchmark rises to 112 percent of the British level in manufacturing, or 108 percent in total industry including mining.27
A second source of revisions comes in through differences in employment coverage between the German industry surveys and the 1907 census. B & B adhere to the survey data of employment in chemical industry, the metal and engineering trades, leather, and mining. However, these employment data can be misleading when it comes to productivity measurement, because of employment in multi- product firms. The surveys follow a firm-oriented concept and take a shortcut by allocating employment to the major product line in the main
26 Additional adjustments come in through the need to carefully balance industry classifications to ensure comparability with the British data. In addition, some apparent errors of mostly minor importance have been corrected. Details are reported in the Appendix.
27 See the Appendix for details.
establishment of a firm. This implied counting all employment in these establishments towards the main product. As a consequence, steel workers would be included in the employment of coal producers and vice versa, depending on the respective firm’s major product. This resulted in over-reporting of employment in some of these industries.
By contrast, the 1907 workplace census followed a product-
oriented concept. In order to provide a clean breakdown of employment in multi-product firms, employees were asked individually to report their employment by the relevant product category on the census date. On balance, census employment levels are therefore lower than in the industry survey data. To the same extent, the industry survey data understate productivity, not at a firm level but per unit of specific products.28 As evidenced in Ralf Banken (2005) for the iron and coal industries, the discrepancies are sometimes considerable. In essence, they reflect the high degree of vertical integration between German coal and steel, and of horizontal integration in chemical industry.
Related difficulties exist in the British census data. To deal with these problems, B & B break down employment by the relevant
product’s percentage in value added.29 The German census
employment data provide this breakdown directly (while a breakdown by value added is often not possible).
This discrepancy gives rise to a revision of the B & B benchmark that goes beyond mere adjustments. Revision Level 2 in Appendix Tables A.1 and A.2s show the results of using census employment
28 Use of the employment census data also leads to changes in the employment weighing scheme, shifting the weights towards more productive industries.
29 In an industry producing 60 percent of its value added in steel and 40 percent in coal, this would imply splitting employment between the two products in the same proportion. An unresolved problem in the British census methodology is that
industries are split up according to the firms’ main line of product. Products like coal or steel thus appear in the survey several times, and allocation of employment between main lines of production and the side products seems far less than obvious.
whenever possible. Replacing the (firm-specific) survey data on employment with the (product-specific) workplace census data on employment leads to upward revisions of productivity in the chemical and metals industries, as well as in mining. As a result of this revision, comparative productivity in German manufacturing rises to 120 percent of British levels. For industry including mining, the estimate is around 118 percent.30
A third source of revisions derives from the different treatment of very small enterprises in the British and German data. The British industry census of 1907 excluded one-person establishments, family helpers and some outworkers, and small establishments of less than 10 employees where only men were working. The census estimates the resulting employment pitfall at roughly 25 percent.31 In contrast, the German workplace census of 1907 aimed at the total working
population. The difference leads to a mismatch between the censoring points of the firm size distributions in the German workplace census and the British industry census. This mismatch is insignificant in chemical and most of metal industry as well as in mining, where large firms prevailed. It is more of a problem in the food, drink and tobacco industries in the index, where small-scale establishments were
quantitatively important.
Evidently, the employment figures cannot simply be adjusted without taking care of the output figures as well. For the German output data from the industry survey, this is not a problem. In the surveys, only the larger firms were included. Hence the output estimate does not need to be adjusted when removing the smaller firms from the
30 Note that as Revision Level 2 just removes double counting from the (firm- specific rather than product-specific) employment data, no adjustment of output is necessary.
31 See Board of Trade, Final Report, p. 8f.
employment data.32 By contrast, the statistics for these taxable goods include all legally produced output, and hence also the output of small establishments. I follow the British 1907 census, as well as de Jong, Fremdling, and Timmer (2007) for the German 1936 census, in assuming that small establishments were 20 percent less productive than larger firms.
Textiles present some special problems. The only product categories comparable to Britain in 1907 seem to be cotton and silk spinning. The German surveys for cotton spinning cover only 398 out of 1062 firms counted in the 1907 census.33 In that census, 379 firms were reported to have 50 or more employees. This implies that neither the smaller firms nor their output were counted in the surveys. The surveys did, however, include the output of outworkers and cottage industries working for the firms surveyed.34 I have therefore adjust employment in cotton spinning by excluding only small firms.
Outworkers in cottage industries, who accounted for roughly 8 percent of employment in cotton spinning, are left in the sample. Very similar adjustments apply to the smaller silk spinning industry.
Appendix Tables A.1 and A.2 report the results from adjusting for firm size in the German employment and output data. Revision Level 3 subtracts employment in establishments of five persons or less (again, except for outworkers in textiles) from the German employment data. The resulting coverage is probably slightly narrower than its British counterpart. The resulting estimate “Revision Level 3“ in Appendix Tables A.1 and A.2 then provides an upper bound for productivity. For manufacturing, this upper-bound estimate suggests a 28 percent
32 We keep in mind that we discarded the survey employment data in the first place because of double-counting, and used the census employment data instead.
33 See Kaiserliches Statistisches Amt, "Produktionserhebungen," p. 69.
34 See the notes in ibid., p. III.
productivity lead for Germany in 1907. With mining, German industry was up to 25 percent ahead of the UK.
In sum then, the revised productivity benchmark for 1907 yields substantially higher German productivity. About 30 percent of the increase can be attributed to minor corrections and improvements to the B & B benchmark. The other 70 percent stem from adjustments made because of mismatches in employment coverage between the British industry census, the German employment census, and the German industry surveys. Once employment coverage in the two countries is put on the same footing, the traditional picture of a
substantial German productivity lead reappears. However, Germany’s sectoral productivity performance in 1907 continues to look very
uneven. While Germany clearly led in the chemical and metal trades, German productivity in the food industries was very low. To this extent, the basic findings of Broadberry (1997) on Germany’s comparative advantage are preserved.
5. Putting the Pieces Together: Resolution of the Productivity Puzzle
Both the revised time series evidence and the revised 1907 benchmark can now be fed back into the productivity comparisons of Table 1.
Table 8 recalculates the productivity comparisons of Table 1, both along the time series dimension, shown in the upper panel, and for the benchmarks, shown in the lower panel. The extrapolation (III) is based on the revision of Hoffmann’s German industrial production index from Table 6, which incorporates the evidence on the aircraft industry in de Jong, Fremdling, and Timmer (2007), and the
conclusions of the previous section for 1907. The revisions to the
benchmarks have a double effect. Including the hidden armament industries for 1935 lowers German productivity slightly. Adjusting the German employment statistics for 1907 (Table 8, VIII) boosts German productivity substantially.
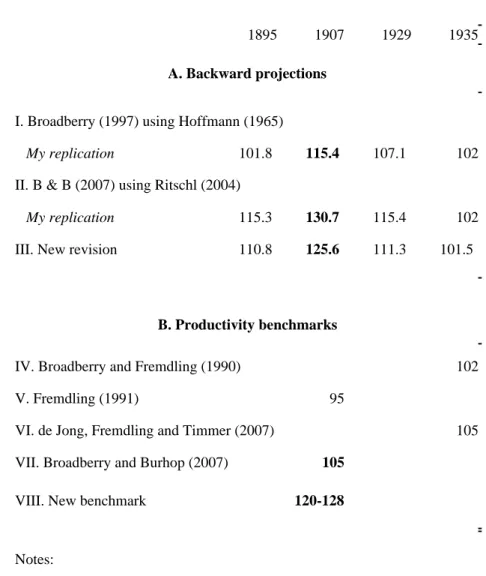
As for the revision to the time series evidence discussed in Section 3, it has two effects. First, it reduces the decline of industrial output between 1929 and 1935: once one accounts for the Heinkel bomber, Germany’s industrial recovery from the Great Depression is more complete than suggested in the earlier revision of Ritschl (2004). Second, the revision to the time series also implies somewhat lower productivity levels relative to Britain before 1929. As a net effect, the revised time-series estimate of Germany’s productivity lead over Britain in 1907 (Table 8, III) is 26 percent, down from 31 percent in the
unadjusted estimates of Table 1 above, and from 50 percent in B & B. If we combine the revised time series extrapolation and the revised productivity benchmark for 1907, there is no longer any discrepancy left: the time series evidence suggests a 26 percent productivity lead, while the benchmark suggests that German manufacturing was between 20 percent (Revision Level 2) and 28 percent (Revision Level 3) ahead. In other words, the Anglo-German productivity puzzle disappears.
All the evidence examined here indicates that Germany enjoyed a growing productivity lead in manufacturing over Britain prior to World War I. Given the paucity of comparable data for 1907 and the inevitable pitfalls in the historical time series, it is hard to know whether the lead was closer to 20 or 30 percent. However, it seems safe to rule out extreme scenarios such as Germany trailing Britain in manufacturing around 1907 or instead forging ahead at 50 per cent, as one of the calculations in B & B suggested.
5. Conclusions and Avenues for Future Research
The Anglo-German industrial productivity puzzle of the early 1900s has a resolution. Careful re-examination of the evidence on Germany suggests revisions to both the time projections and the productivity benchmarks. Application of both methods suggest that in manufacturing, Germany had a substantial productivity lead over Britain on the eve of World War I, albeit with an uneven sectoral distribution.
Previous benchmark estimates, last proposed by Broadberry and Burhop (2007), suggested a very small German productivity lead over Britain in 1907, or none at all. At the same time, backward
extrapolations from a 1935 benchmark implied an implausibly large productivity lead of 50 percent for 1907. This was the Anglo-German industrial productivity puzzle. The present paper has resolved the puzzle. It does so by undertaking further revisions to the German time series evidence, based on Fremdling and Staeglin’s (2003) discovery of armament industry data hidden in Germany’s industrial census in 1936. The paper also reworks the 1907 benchmark to take into account differences in employment coverage between the British and German data.
Once these revisions to the time series evidence the benchmark are done, the Anglo-German productivity puzzle all but disappears. German manufacturing in 1907 turns out to have been was 20 to 28 percent ahead of Britain if measured by the benchmark comparison method, or 26 percent ahead if measured by backward extrapolation. This puts traditional interpretations of German industrial dynamics prior to World War I (as in Gerschenkron (1962) or Landes (1969)), firmly back on the map. At the same time, however, the picture that emerges is very much that of a dual economy, as is already implicit in
Broadberry (1997): while chemical industry, metals, and engineering
appear to have been quite far ahead, the light industries in sectors closer to agriculture were not. Yet the overall picture I obtain of these industries is less unfavourable to Germany than the data of Broadberry and Burhop (2007) would suggest. This paper also confirms that
Germany underwent a remarkable slowdown in growth and productivity across World War I, as in Borchardt (1991 [1982]). The implication is that Hoffmann’s (1965) series (which has been employed by Angus Maddison (1995, 2001) and others), substantially overstates
Germany’s industrial and aggregate output growth after World War I. Further research should concentrate on a full recalculation of a German industrial production index, combining the various existing revisions with the available archival data. Still, the Anglo-German industrial productivity puzzle appears to be resolved, given the information currently available.
Table 1: Estimates of Comparative Productivity in German Manufacturing (UK=100)
1895 1907 1929 1935
A. Backward projections
I. using Hoffmann (1965)
Broadberry (1997) 108.6 106.5 104.8 102
My replication 101.8 115.4 107.1 102
II. using Ritschl (2004)
Broadberry/Burhop (2007) 172.3 149.7 115.5 102
My replication 115.3 130.7 115.4 102
III. using Wagenfuehr (1933) 99.9 131.7 111.1 102
B. Productivity benchmarks
Broadberry and Fremdling (1990) 102
Fremdling (1991) 95
de Jong, Fremdling and Timmer (2007) 105
Broadberry and Burhop (2007) 105
Notes:
(i) All data refer to changing territory
(ii) Data exclude mining, utilities, and construction (iii) Data for Britain from Feinstein (1972)
Table 2: Time Series Estimates of Output in German Metal Processing
Ritschl (2004) Hoffmann (1965)
1913 100 100
1929 119.9 170.3
1935 100.5 163.9
Notes
(1) All data are indices 1913=100 and refer to changing territory (2) Total metal processing also includes shipbuilding and cars (3) Hoffmann (1965) index is estimated from wage bills
Table 3: Recalculating Output in German Machine Building
Nominal Sales Prices Real Output
for comparison :
VDMA
Fremdling
(2005) 1928 Census Revised
Ritschl (2004)
Wagenführ (1933) million marks/
reichsmarks Index
million marks
million marks/ reichsmarks Index
- - - Index 1913 = 100 - - - -
(i) (ii) (iii) (iv) (v) (vi) (vi)
1909 1738.2 106.2 62.7 63.9
1913 2800 100 2609.6 2609.6 100 100 100 100 100
1928 4000 142.9 3728 142.9 144.8 98.7 97.8 94.1
Sources: Calculated from Ritschl (2004), Fremdling (2005)
Table 4: German Aircraft and Armament Industry in 1936
Employment Sales (RM) Output per capita Output 1935 (1913=100) Unadjusted Corrected
(i) (ii) (iii) (iv) (v)
Aircraft 145,543 883,000,000 6066.9
Handguns 22,308 73,903,395 3312.9
Total not in census 167,851 956,903,395 5700.9
Machine Building 593,093 3,770,055,495 6356.6 80.9
Machines & Armament 760,944 4,726,958,890 6212.0 103.8
Shipbuilding 79,887 499,810,437 6256.5 61.5 61.5
Motor vehicles 112,375 1,441,837,963 12830.6 815.5 815.5
Electrical engineering 325,433 2,315,458,540 7115.0 123.1 123.1
Metal processing industry 100.5 113.6
Source: (i-iii): German Federal Archives, R 3102/3028, R3102/3540-44
(iv): Table 2, Table 3. Shipbuilding and motor vehicles: Ritschl (2004) (v): Aggregated using the weights in Ritschl (2004), adjusted for armament
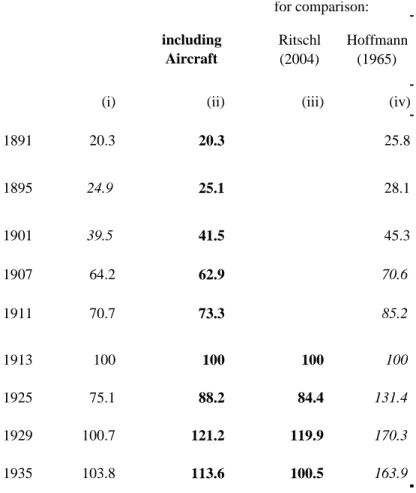
Table 5: Recalculating Output in German Metal Processing
Machines Total metal processing
for comparison: including
Aircraft
Ritschl (2004)
Hoffmann (1965)
(i) (ii) (iii) (iv)
1891 20.3 20.3 25.8
1895 24.9 25.1 28.1
1901 39.5 41.5 45.3
1907 64.2 62.9 70.6
1911 70.7 73.3 85.2
1913 100 100 100 100
1925 75.1 88.2 84.4 131.4
1929 100.7 121.2 119.9 170.3
1935 103.8 113.6 100.5 163.9
All data refer to changing territory Sources and Methods:
(i) Revised output in machine building until 1929: Methods as in Table 3 (v) for 1935: Revision as in Table 4 (v) (ii) Revised estimate including (i),
methods as in Table 4 and Ritschl (2004)
(iii) Ritschl (2004)
(iv) Hoffmann (1965)
Table 6: Industrial Production Indices for Germany (1935=100)
Revised Hoffmann index Wagenfuehr Hoffmann Ritschl
new (2004)
(i) (ii) (iii) (iv)
1881 25.6 26.5 23.1
1891 35.9 37.1 33.4
1895 44.4 45.9 39.8 40.5
1901 52.2 54.0 56.6 47.5
1907 70.5 73.0 73.6 64.4
1911 80.0 82.8 88.0 73.7
1913 92.1 94.9 97.5 80.6
1925 86.4 89.4 88.0 84.7
1929 104.6 107.8 103.8 100.1
1935 100 100.0 100 100
Sources and Methods:
(1) All series for categories comparable to Feinstein (1972) (2) See text for calculation of revised Hoffmann series (3) All data refer to changing territory
Table 7: Anglo-German benchmark comparison of industrial productivity, 1907 (UK=100)
Broadberry
and Burhop Revised
(i) (ii)
General chemicals 126.6 134.3
Coke 98.9 123.5
CHEMICALS & ALLIED 113.9 130.5 Iron & steel 137.8 144.0 Non-ferrous metals 157.9 221.5 Motor vehicles 89.7 135.2 METALS & ENGINEERING 139.2 152.1
Cotton 85.6 128.4
Silk 74.9 93.7
Leather 67.8 100.8
TEXTILES & CLOTHING 82.3 121.7
Brewing 90.5 102.7
Tobacco 28.3 38.4
Sugar 47.3 47.3
FOOD, DRINK & TOBACCO 66.9 73.0
Cement 108.1 124.2
TOTAL MANUFACTURING 105.0 128.0
Salt mining 57.8 130.1
Coal mining 78.5 95.5
Iron ore mining 91.0 129.8 MINING 78.7 97.9
TOTAL INDUSTRY 101.8 124.5
Sources and Methods: (i) See Broadberry and Burhop (2007) (ii) See Appendix, Tables A.1., A.2.
excludes outworkers in German textile industry (iii) See Appendix, Tables A.3., A.4.
includes outworkers in German textile industry
Table 8: Revised Estimates of Comparative Productivity in German Manufacturing (UK=100)
1895 1907 1929 1935
A. Backward projections
I. Broadberry (1997) using Hoffmann (1965)
My replication 101.8 115.4 107.1 102
II. B & B (2007) using Ritschl (2004)
My replication 115.3 130.7 115.4 102
III. New revision 110.8 125.6 111.3 101.5
B. Productivity benchmarks
IV. Broadberry and Fremdling (1990) 102
V. Fremdling (1991) 95
VI. de Jong, Fremdling and Timmer (2007) 105
VII. Broadberry and Burhop (2007) 105
VIII. New benchmark 120-128
Notes:
(i) All data refer to changing territory
(ii) Data exclude mining, utilities, and construction (iii) See Tables 1 and 6 for backward projections
(iv) See Table 7 and Appendix Table A.2 for revised 1907 benchmark
APPENDIX:
Data Sources And Methods Underlying The Revised 1907 Benchmark
General remarks
Appendix Tables A.1 and A.2 report the Broadberry and Burhop (2007) benchmark productivity comparison for 1907, along with three revisions. Table A.1 provides employment levels and index weights, Table A. 2 shows comparative productivity. The British data are from the 1907 UK production census, see Board of Trade (1912). The German data are from industry surveys of production in Kaiserliches Statistisches Amt (1913), form the workplace census of 1907, see Kaiserliches Statistisches Amt (1910a), and from output data on taxable goods, see e.g.
Kaiserliches Statistisches Amt (1910b). Coverage of employment differs considerably between the German and the UK data, as well as between the various different German data. This gives rise to a series of revisions.
• Revision Level 1 is a corrected version of the B & B estimate, without adjustment of employment coverage.
• Revision Level 2 is based on 1907 German workplace census employment. Entries show all employment including outworkers in cottage industries. As most of the German output data were sampled only from medium to large size firms, Revision Level 2 underreports German productivity in most sectors. Due to wider employment coverage than in the British data, it also
underreports German comparative productivity.
• Revision Level 3 excludes firms with 5 persons or less (but not any workers in cottage industry) from the German employment data. This aims to establish comparable levels of coverage with the UK data, which exclude one-person firms, all-male
establishments with up to 10 employees, and an unknown percentage of outworkers in cottage industries. For those
German industries (mostly taxable goods) where all output was reported, output in Table A.2 is adjusted accordingly, assuming the excluded employment categories were 20 percent less productive than the rest. No output adjustment is made to the production survey data, thus some underreporting of productivity in the respective sectors is still likely.
1. General chemicals
Broadberry and Burhop (2007) (B & B) report German data for 1908, which they take from an industry survey, see Kaiserliches Statistisches Amt (1913, p. 59 ff.). For sulphuric acid, data are also available for the census year of 1907, see e.g. Kaiserliches Statistisches Amt (1909, p. 99). These data are consistent with the survey for 1908. Product-specific employment data in Appendix Table A.1 are from the 1907 workplace census, see Kaiserliches Statistisches Amt (1910). The UK data are from Board of Trade (1912).
2. Coke
The employment figures differ considerably across sources. The
production surveys in Kaiserliches Statistisches Amt (1913, p. 4-6) show 24,535 employed in 1908, while the 1907 census in Kaiserliches
Statistisches Amt (1909, p. 76) has only 15,632 in the same category. However, the (firm-specific) survey categories include significant output of joint and related products like tar and several varieties of gas. Hence their employment category is also wider and includes these lines of production as well. In contrast, the workplace census provides narrower (product- specific) employment concepts, which are to be preferred. Revision Levels -3 in Tables A.1 and A.2 are based on the census employment data. Labour productivity growth according to the industry surveys
averaged 5 percent per year from 1908 to 1911. To obtain productivity for
1907, I calculate output in 1908 into employment in 1907 and adjust for 5 percent productivity growth per annum. The resulting figure is 1384.4 metric tonnes of coke per capita of census employment in 1907, or 123.5 percent of British productivity levels. UK data (which exclude tar and gas) are from Board of Trade (1912,
p. 69 f.).
3. Iron and steel
B & B’s productivity comparison rests on unit value comparisons for major subgroups of this industry. As historical distinctions between the various groups of iron and steel are highly arbitrary, the preferred method of comparison is physical output and productivity, subtracting the inputs of pig iron. German data for 1907 from Kaiserliches Statistisches Amt (1909, p. 98) provide output along with employment following the survey
concept. Results are very close to the B & B estimate. UK data are from Board of Trade (1912, p. 171-75).
4. Non-ferrous metals
B & B’s productivity comparison rests on only two products, unwrought copper and unrefined zinc. The same industries produced a much wider range of products. However, the British sources do not provide
employment estimates for the various product categories separately, see Board of Trade (1912, p. 264ff.). German 1907 data on output and
employment for the relevant product categories are available from
Kaiserliches Statistisches Amt (1909, p. 98). The data in appendix Table A.2, Revision Level 1, report a conservative comparison of physical productivity. Here, copper, zinc, and lead output from various different industries in the 1907 UK census (Board of Trade, 1912) are added up, without being able to add up the relevant employment categories as well. The resulting comparative productivity estimate is slightly lower than the
one by B & B. The much higher productivity level in Table A.2, Revision Level 3, results from subtracting employment in small establishments of five persons or less, and would be consistent with a physical productivity comparison for lead, zinc, and copper sampled from the industries
included by B & B. For these three metals together, German productivity according to the surveys in Kaiserliches Statistisches Amt (1913) was 235 percent of UK levels.
5. Motor vehicles
The German data underlying the comparison in B&B are for 1909, not 1907 as claimed in the text. Overall employment (12688) and value of output (29.3 mill. M) for 1907 are available from the same source, see Kaiserliches Statistisches Amt (1913, pp. 64ff.). My estimate employs information about relative unit values from 1909, and combines it with the 1907 employment and physical output data in the different categories. The UK data are from Board of Trade (1912, p. 203f.).
6. Cotton
Output data for cotton spinning are available for both the UK and
Germany. For weaving, the British census only has a surface measure of output, while the German data are in tonnes. The British sources provide employment only for spinning and weaving combined, see Board of Trade (1912, pp. 337ff.). B & B adjust their UK employment data to spinning by the ratio of gross value in cotton spinning to that in the whole industry. We adopt this adjusted estimate. Output data for Germany for 1907 are from the industry surveys of Kaiserliches Statistisches Amt (1913). B & B’s employment data, taken from the 1907 census in Kaiserliches
Statistisches Amt (1910b) and Kaiserliches Statistisches Amt (1910a), include an apparent typo (“Bigognespinnerei” in the German source, whose employment they record as 9493, instead of 6493 as in the