The Chinese herb, Danshen (Radix Salviae miltiorrhizae), induces salivary fluid secretion
Fei Wei
Division of Physiological Sciences, School of Life Science, Graduate University for Advanced Studies. 38 Nishigounaka, Myoudaiji-cho, Okazaki 444-8585, Japan. Phone: +81-564-59-5268, Fax: +81-564-59-5269, Mail: [email protected]
Key words: Salivary fluid secretion, Xerostomia, Danshen, isolated perfused gland
Summary
[INTRODUCTION] Xerostomia is mainly caused by salivary gland hypofunction. The incidence of salivary gland hypofunction in the population over 65 years old is 30-40%. However, the common current treatments for salivary gland hypofunction by parasympathomimetic drugs are accompanied by systemic side effects. Danshen has been clinically used to relieve dry mouth in Chinese medicine. However, only a few reports addressed the direct effect of Danshen on the salivary glands. Murakami et al. (2009) examined 20 Chinese herbs, focusing on their capability to promote salivary fluid secretion in the submandibular glands of rats. The results of that study showed that Danshen not only promotes during muscarinic stimulation with carbamylcholine, but it also induces salivary fluid secretion without the addition of any other stimulants. [PURPOSE] In this study, Danshen was chosen as a candidate for the relief of xerostomia, and the capability of Danshen to induce salivary fluid secretion and its mechanism were examined.
[METHODS] The submandibular gland was isolated from the rat and vascularly perfused, and also acinar cells were isolated to measure the Ca2+ influx. The excretory duct was cannulated and the secreted volume was measured by electronic balance. Arterio-venous difference of partial oxygen pressure was measured as an indicator of oxygen consumption. Arterio-venous pressure difference was also measured as indicator of increase in microcirculation.
[RESULTS & DISCUSSION] Although Danshen induced salivary fluid secretion in the submandibular glands, the time course of that secretion differed from fluid secretion induced by carbamylcholine. There was a latency associated with the fluid secretion induced by Danshen, followed by gradual increase in the secretion until it reached its
highest value, and thereafter there was a slow decline to a near zero level. These characteristics suggested that the mechanism for Danshen-induced salivary fluid secretion could be different from that induced by carbamylcholine. Carbamylcholine activates the M3 receptor to release IP3 and quickly releases Ca2+ from the intracellular calcium stores. The elevation of intracellular Ca2+ level induces chloride release and quick osmosis, resulting in an onset of fluid secretion. Furthermore, the α1 adrenergic and neurokinin A receptors use the same signalling sequence after binding the
individual receptors. Therefore, IP3-store Ca2+ release signalling may not be involved in secretion induced by Danshen, but rather, there may be a distinct signalling process. During Danshen stimulation, the additional application of either ouabain (inhibitor of Na+/K+ ATPase) or bumetanide (inhibitor of NKCC1), inhibited the oxygen
consumption and suppressed the fluid secretion by more than 90%. These results indicated that Danshen activates Na+/K+ ATPase and NKCC1 to maintain Cl- release and K+ release for fluid secretion. Next, we examined the involvement of the main membrane receptors, M3 muscarinic and α1 adrenergic receptors. Neither atropine nor phentolamine inhibited the fluid secretion induced by Danshen. Accordingly, Danshen does not bind with M3 nor α1 receptors. An increase in [Ca2+ ]i is essential for the activation of the luminal Cl- and basolateral K+ channels. The nominal removal of extracellular Ca2+ and chelating of intracellular Ca2+ by BAPTA-AM totally abolished the fluid secretion induced by Danshen, suggesting the involvement of Ca2+ in the activation of these channels. However the fluorescent Ca2+ indicators could not show the changes in the [Ca2+] due to the dark color of Danshen and its extract, Salvianolic acid B. The quick drop seen in the arterio-venous pressure difference suggests an increase in the microcirculation due to Danshen. However, the paracellular fluid
secretion indicated by the fluorescent dye was smaller than that induced by
carbamylcholine, suggesting that the transcellular fluid secretion was dominant in the whole fluid secretion during Danshen stimulation.
[CONCLUSION] The present findings support the use of Danshen in the treatment of xerostomia, and we consider that DS is a promising secretagogue which could avoid the systemic side effects induced by the recent muscarinic drugs such as cevimeline,
pilocarpine and so on.
Contents I. Background
I-1. Xerostomia and problems related to the present treatments I-2. Danshen (DS)
I-3. Experimental plan to assess the capability of Chinese herbs to induce salivary fluid secretion
II. Materials and Methods
II-1. Isolation and Perfusion of SMG II-2. Perfusion of the gland
II-3. Preparation of the perfusion fluid II-4. Preparation of the DS solution II-5. Salivary fluid secretion
II-6. Oxygen consumption
II-7. Effects of ouabain, bumetanide, atropine and phentolamine II-8. Removal of extracellular and chelation of intracellular Ca2+
II-9. Measurement of the intracellular calcium concentration using dispersed acinar cells from rat SMGs
II-9-1. Solutions
II-9-2. Isolation of the acinar cells
II-9-3. Measurement of the uptake of calcium
II-10. Increase in microcirculation as measured by A-V pressure difference II-11. Assessment of the paracellular transport using LY secretion as an indicator II-12. Statistics
III. Results.
III-1. Characteristics of the Danshen-induced salivary fluid secretion III-1-1. Time course of the DS induced salivary fluid secretion
III-1-2. The latency of the salivary fluid secretion decreased with high doses of DS perfusion
III-1-3. Maximum secretory rate of the DS-induced salivary fluid secretion III-2. Contribution of Na+/K+/2Cl- cotransporter and Na+/K+ ATPase to the
DS-induced fluid secretion
III-2-1. Oxygen consumption during the DS-induced salivary fluid secretion III-2-2. Ouabain decreased fluid secretion and oxygen consumption
III-2-3. Bumetanide decreased fluid secretion and oxygen consumption III-2-4. Comparison of the inhibition between ouabain and bumetanide III-3. Participation of muscarinic or α1 adrenergic receptors in DS-induced fluid
secretion
III-4. Requirement of extracellular Ca2+ for DS-induced fluid secretion III-5. The effect of SAB on uptake of Ca2+
III-6. Paracellular fluid transport during the DS perfusion
III-6-1. Increase in microcirculation as measured by A-V pressure difference III-6-2. Increase in paracellular transport as measured by LY secretion IV. Discussion
IV-1. DS
IV-2. DS-induced salivary fluid secretion
IV-3. Inhibition of Na+/K+ ATPase during the DS stimulation IV-3-1. Oxygen consumption during latency of DS stimulation
IV-3-2. Oxygen consumption during DS-induced fluid secretion IV-4. Inhibition of Na+/K+/2Cl- cotransporter during the DS stimulation IV-5. Can Danshen stimulate muscarinic or α1 adrenergic receptors? IV-6. Does Danshen stimulation require extracellular Ca2+?
IV-7. Uptake of Ca2+ During DS stimulation
IV-8. Paracellular fluid transport during DS perfusion
IV-8-1. Increase in the area of the capillary bed due to DS
IV-8-2. Increase in the paracellular LY secretion measured by LY secretion V. Further studies
VI. Conclusions
Appendix. Unsuccessful measurement of intracellular Ca2+ by double wavelength fluorometry using Indo-1-AM, Fura-2 AM, and CaTM-2 AM
Figures
Figure 1-1. Time course of the DS-induced salivary fluid secretion Figure 1-2. The latency of different doses of DS perfusion
Figure 1-3. Dose response of DS-induced maximal fluid secretion
Figure 2-1. Time course of the A-V difference of PO2 during the DS perfusion Figure 2-2. Inactivation of Na+/K+ ATPase due to ouabain. A. DS-induced
salivary fluid secretion B. Oxygen consumption during DS stimulation Figure 2-3. The effects of bumetanide on DS-induced salivary fluid secretion. A.
DS-induced salivary fluid secretion B. Oxygen consumption during DS stimulation
Figure 2-4. The residual DS-induced fluid secretion during inhibition due to ouabain or bumetanide
Figure 3. Effects of atropine and phentolamine on DS-induced fluid secretion Figure 4. Removal of cytosolic Ca2+ with BAPTA-AM
Figure 5-1. A-V pressure differences during DS (red) or CCh (black) perfusion Figure 5-2. LY secretion during CCh or DS perfusion
References
Acknowledgements
I. Background.
I-1. Xerostomia and problems in the present treatments. Saliva is important to maintain the oral environment. It moistens and washes the surface of the oral cavity, and facilitates swallowing and chewing food as lubricant. The subjective feeling of dry mouth is called xerostomia and mainly caused by salivary gland hypofunction (SGH). SGH is a condition in which non-stimulated or stimulated salivary flow is significantly reduced due to many reasons such as aging, radiation therapy, medications, and
Sjögren’s syndrome. The incidence of SGH in the population over 65 years old is 30-40% (Sreebny, 2010). Xerostomia reduces the quality of life (QOL) (Atkinson et al., 2005; Guggenheimer et al., 2003). The current treatment for xerostomia includes the administration of parasympathomimetic drugs or artificial saliva (Ge and Lin, 2008). Parasympathomimetic drugs, including pilocarpine and cevimeline, activate muscarinic receptors on the salivary glands to stimulate fluid secretion. However, the muscarinic receptors exist in many organs of the body. So this medication is accompanied by systemic side effects, for example, nausea, diarrhea and other adverse gastrointestinal reactions (Joraku et al., 2005; Miao et al., 2007). Therefore, most patients tend not to take these drugs, but rather use artificial saliva. However, artificial saliva also has disadvantages. It is difficult to be taken when the mouth is used continuously, such as during speech. Therefore, there is a clinical requirement for salivary fluid promoters with fewer side effects.
I-2. Danshen (DS). Murakami et al. (2009) examined 20 Chinese herbs on their capability to promote salivary fluid secretion using isolated and vascularly perfused submandibular glands (SMG) of rats. They found 15 herbs that could promote salivary fluid secretion during muscarinic stimulation with carbamylcholine (carbachol, CCh).
Among those15 herbs, Danshen was found not only to promote salivary fluid secretion, but also induce it.
Danshen (DS) is a representative Chinese herb in the category of the agents that promote blood circulation and eliminate stasis (Wu, 2008). DS is mainly used for coronary atherosclerotic disease of heart. The main pharmacological functions of DS have been reported as 1) dilatation of the blood vessels, 2) promotion of
microcirculation, 3) anti-coagulant activity, 4) antithrombotic activity, and 5)
anti-inflammation. Among the components of the DS extracts, Salvianolic acids, the phenolic acids and diterpenechinone compounds of the tanshinone type are equally effective (Du et al., 2004).
DS has been clinically used to relieve dry mouth in Chinese medicine. However, only a few reports have addressed the direct effect of DS on salivary glands (Jiang et al., 2005) and no studies have been conducted to examine the mechanisms related to the induction of salivary secretion. The present study was planned and conducted to confirm the salivary induction due to DS and examine the possible mechanisms involved in DS-induced salivary fluid secretion.
I-3. Experimental plan to assess the ability of Chinese herbs to induce salivary fluid secretion. In order to measure fluid secretion in response to Chinese herbs, we
employed isolated and arterially perfused rat salivary glands, because this is only the method that makes it possible to measure fluid secretion, except for a method
employing in vivo gland. The in vivo gland is an ideal model for clinical application, but with this method, we cannot avoid influences from neural and hormonal effects. A previous study showed that the five kinds of Chinese herbs, which were known as medicine for xerostomia, could not promote salivary fluid secretion in isolated and
perfused glands (Murakami et al., 2009a). In addition, because the epithelial structure is maintained in the isolated perfused SMG, this method makes it possible to observe not only transcellular fluid secretion, but also paracellular fluid secretion (Murakami et al., 2009b).
Transcellular fluid secretion is based on Cl- release through the Ca2+ dependent-Cl- channel (TMEM16A) across the luminal plasma membrane (Romanenko et al., 2010). The junctional flow of Na+ is followed by a requirement for electroneutrality to increase luminal osmolarity. The osmotic gradient allows osmosis through aquaporine 5 on the luminal membrane and junctional water flow. For Cl- entry across the basolateral membrane, the Na+/K+/2Cl- cotransporter (NKCC1) is driven by the Na+
electrochemical gradient, which is maintained by Na+/K+ ATPase. Because the double antiport system, including anion exchanger and Na+/H+ exchanger, has a minimal contribution for Cl- entry during HCO3- -free perfusion, the experimental system can be simplified by avoiding HCO3- utilization.
The experimental system for the assessment of new secretagogues including Chinese herbs was established as followings. 1) Fluid secretion measured by the use of computer-aided electronic balance in the isolated perfused SMG. 2) Oxygen
consumption measured by arterio-venously placed oxygen electrodes. Inhibition of fluid secretion and oxygen consumption by ouabain for assessment of the activity of Na+/K+ ATPase. 3) Inhibition of fluid secretion by bumetanide for assessment of NKCC1 for the fluid secretion. 4) Use of atropine and phentolamine to assess the involvement of muscarinic and α1-adrenergic receptors stimulated by new secretagogues. 5) The requirement of extracellular Ca2+. 6) Measurement of intracellular Ca2+. 7) The possibility of paracellular fluid secretion.
Using experimental plan shown above, this study was conducted to investigate salivary fluid secretion induced by DS. In the final experiment, measurement of intracellular Ca2+ stood like a solid stone wall due to the intrinsic color of DS. II. Materials and Methods.
II-1. Isolation and Perfusion of SMG. Adult Wistar male rats (9 weeks, 240-280 g) were purchased from Japan SLC, Inc. (Wistar/ST) and given a standard pellet diet and water ad libitum. The rats were anesthetized by intraperitoneal injection of pentobarbital sodium at a dose of 30 mg/kg body weight (Somnopentyl, Kyoritsu Seiyaku Co. Japan) after induction with 3 vol% isoflurane (Abbot). The SMGs were surgically isolated as previously described (Murakami et al., 1990). Briefly, the attached sublingual gland and sublingual duct were removed after ligation of the feeding arteries, and draining of the vein. The main duct of the SMG was cannulated with a fluorine-fiber tube (0.3 mm I.D.
× 0.5 mm O.D., EXLON, Iwase Co. Ltd., Japan) for sampling. The artery distal to the glandular branch was cannulated with a stainless steel catheter connected to the infusion line for perfusion. Then, the vein from the gland was cut free.
II-2. Perfusion of the gland. The isolated SMGs were placed in a humidified chamber at 37°C and perfused arterially with the aid of a peristaltic pump (Cole-Palmer, 7553-10, USA) at a rate of 1.8 mL/min to supply enough oxygen even without a specific oxygen carrier during the secretory period. Immediately before the excretory duct cannulation, the fluorine-fiber tube was filled with distilled water. The other end of the ductal
cannula was placed under water in a small cup on an electronic balance with a minimum digital readout of 0.1 mg (Shimadzu AEG-220, Kyoto, Japan), avoiding any contact with the side and bottom of the cup.
After a control perfusion of buffered salt solution for 20 min, the weight of the
secreted saliva was recorded for 5 min prior to the start of the stimulation.
Carbamylcholine chloride (CCh, Sigma, MO, USA) was applied at 0.2 µmol/L for 5 min as a control to test the vigor of the gland, and in these experiments, the fluid secretion of CCh at 4.95 - 5 min was set as 100% to normalize the individual variation. CCh was removed by washing another 5 min using perfusion fluid. The DS solution was continually perfused for 60 min.
II-3. Preparation of the perfusion fluid. The perfusion fluid was a salt solution with the following composition (in mmol/L): Na+ 140.0, K+ 4.3, Ca2+ 1.0, Mg2+ 1.0, Cl- 148.3, and glucose 5.0. The solution was buffered at pH 7.4 with N-2-hydroxyethyl
piperazine-N’-2-ethane sulfonic acid (HEPES, 10 mmol/L) and gassed with 100% O2 at 37°C. Salts, glucose, HEPES, CCh and phentolamine were purchased from Sigma (MO, USA).
II-4. Preparation of the DS solution. The granular extract from the root of the DS was provided by Tian Jiang Pharmaceutical Co. Ltd., Jiang Yin, China. Each gram of this DS granule was concentrated and equivalent to 5 g of the crude DS. The DS stock solution was prepared as follows. 1) Two gram of DS were dissolved in the perfusion fluid by ultrasonic concussion for 5 min. The precipitate was removed twice after each centrifugation at 4,000 rpm for 5 min. The clear supernatant was obtained and its pH was adjusted to 7.4 by sodium hydroxide solution (1 mol/L, Nacalai Tesque, Inc., Kyoto, Japan). 2) The neutral solution was prepared to 0.5 g/mL (each concentration in this study refers to crude DS, rather than the extract of DS) in a buffer solution. This solution was filtered through a filter with a pore size of 0.22 µm (Sterivex-GV, Millipore, MA, USA) to obtain the DS stock solution. Finally, before using, the stock solution was diluted with the perfusate, and prepared into concentrations of 1, 3, 5, 25
and 50 g/L.
II-5. Salivary fluid secretion. The cumulative weight was automatically measured every 3 s and the data was transferred to a spreadsheet file in a computer. The fluid secretion rate was calculated from the time differentiation of the cumulative volume of saliva, assuming a saliva specific gravity of 1.0.
II-6. Oxygen consumption. The partial oxygen pressures of the perfusate and the effluent were measured polarographically at 37°C by the Dissolved Oxygen Measuring System (Model 203, Instech Laboratories, PA, USA). The artery and the vein of each of the isolated SMGs were cannulated and arterially perfused with perfusion fluid.
Clark-type electrodes were placed serially on the arterial and venous sides of the perfusion line. The data were stored in every 15 s by computer. The calibration of the system was performed during perfusion with distilled water 100% equilibrated with air. The partial pressure of oxygen was obtained as the value at 100% air saturation at 37°C and 1 atm. The rate of oxygen consumption was expressed by changes in the
arterio-venous (A-V) difference of oxygen pressure from the resting level. Oxygen consumption during DS-induced salivary fluid secretion was measured in the same time course as the salivary fluid secretion induced by 5 g/L DS. Oxygen consumption during DS perfusion with other drugs was simultaneously measured with the fluid secretion. II-7. Effects of ouabain, bumetanide, atropine and phentolamine. While atropine (1 µmol/L; Nacalai Tesque. Inc., Japan) or phentolamine (5 µmol/L; Sigma, MO, USA) was continually perfused and 10 min later, DS (5 g/L) solution was added in addition to atropine or phentolamine, and continually perfused for 50 min. The salivary fluid secretion and oxygen consumption were recorded simultaneously during experiments that involved ouabain and bumetanide. In addition to the first experiment, ouabain (1
mmol/L; Merck KGaA, Germany) or bumetanide (100 µmol/L; Sankyo, Japan), were respectively added at 10 min after the DS was administrated and removed at 15 min. II-8. Removal of extracellular and chelation of intracellular Ca2+. The measurement of the salivary fluid secretion and the perfusion of the SMGs were almost the same as in the first experiment, except that Ca2+ in the perfusate was removed nominally without any chelating agent before the administration of CCh or DS, in order to examine the contribution of extracellular Ca2+ on DS-induced salivary fluid secretion.
BAPTA-AM (Dojin-Do, Japan) was employed to chelate the intracellular Ca2+ of the SMG cells. The measurement of the salivary fluid secretion was the same as the first experiment. Initially CCh (0.2 µmol/L) was added in the perfusion for 5 min as control stimulation. After CCh was washed for 5 min by perfusion without CCh. the
BAPTA-AM was added in the perfusion for 20 min at 100 µmol/L in the Ca2+-free perfusate. Then, the DS was continuously perfused for 40 min in Ca2+-free perfusate. II-9. Measurement of the intracellular Ca2+ concentration using dispersed acinar cells from rat SMGs.
II-9-1. Solutions. We used a Krebs-Ringer-bicarbonate (KRB) solution, which was prepared by replacing 25 mmol/L of Cl- by HCO3- and gassed with a gas mixture of 5% CO2 and 95% O2 for the isolation of the acinar cells. Then the CaCl2 was removed from the perfusate solution (Ca2+ nominally zero), resulting in a decrement of Cl- by 2
mmol/L.
Salvianolic acid B (SAB), which is a main component of DS, could induce fluid secretion by the SMG with a similar pattern. SAB was purchased from Shaanxi Sciphar Biotechnology Co., Ltd., China (DS111217). Because the dark color of the DS granules masked the fluorescent signal of Ca2+ indicators (see appendix 1), then SAB was used
instead of the DS granules in order to reduce the masking effect. The SAB was
dissolved in the perfusion solution and the pH was adjusted to 7.4. The precipitate was removed by centrifugation, and the supernatant was prepared into SAB solutions of 150, 200, and 250 µg/mL. The SAB content in DS granule was measured as 2.53% by HPLC purification (unpublished data). Then the DS concentration (5 g/L) was equivalent to 126.5 µg/mL. The same concentration range of SAB was used for isolated SMG cells than that of DS used for the perfused gland.
II-9-2. Isolation of the SMG cells (Sakai et al., 2002). Two SMGs were isolated from one rat, placed on thick wax layer in a petri dish, and minced using a single-edge razor. Then the mixture was moved to a 15 mL centrifuge tube, 5 mL of perfusate was added, and in a vortex well, centrifuged at 1,000 rpm for 1 min at room temperature. After discarded the supernatant, the minced SMGs were suspended with 5 mL of the KRB solution with a 0.5% BSA fraction V (Sigma, MO, USA), collagenase type II
(Worthington Biochemical Corporation, 0.2 mg/mL) and hyaluronidase (Sigma, MO, USA, 0.2 mg/mL) in a 25 mL centrifuge tube. After cutting and pipetting 10 times, the tube was placed into a water bath and was incubated for 45 min at 37ºC. The tissue mixture was dispersed at 10 min intervals by cutting and pipetting. Then, the tissue mixture was slowly filtered though nylon mesh and gently put on 5 ml of the KRB solution with a 4% BSA traction V. After centrifuging the filtrate at 500 rpm for 5 min, the supernatant was discarded. Ca2+ indicator (Indo-1 AM (Sigma-Aldrich, USA), CaTM-2 AM (Goryo Chemicals, Japan) or Fura-2 AM (Dojin-Do, Japan) was added to the cell suspension. The tube was covered with aluminum foil and incubated for another 30 min with gentle shaking at 160 rpm. Then it was washed by spin-down at 500 rpm for 3 min and the supernatant was discarded. Next, 2 mL of perfusate was added for
incubation and the mixture was shaken again for 3 min. After centrifuging the mixture again, the cell suspension was prepared by gently mixing the sediments with trypsin inhibitor (Sigma-Aldrich, MO, USA, 1 mg/5 mL) solution (Krebs-Ringer-HEPES solution [(in mmol/L) 120 NaCl, 5 KCl, 1 MgSO4, 0.96 NaH2PO4, 0.2% glucose, 20 HEPES (pH 7.4), and 1 CaCl2] contained 0. 2 mg/mL trypsin inhibitor and 0.1% BSA). II-9-3. Measurement of the Ca2+ uptake. The fluorescence of Fura-2-loaded cells was measured with a CAF-110 spectrofluorometer (Nihon Bunko, Japan) with excitation at 340 nm and 380 nm and emission at 500 nm. The data were recorded in computer with LabChart software (AD Instrument, Australia).
The Ca2+ influx in the isolated submandibular cells was measured with the 45Ca radioactive tracer method as described by Yang et al. (2006). 45CaCl was obtained from Perkin-Elmer (MA, USA). The cells were prepared as described in the Methods section, and separated in three tubes with a volume of 1.8 mL in each tube. Then 4 µL of tracer was poured into each tube (final radioactivity was 74 kBq/mL, i.e. 2 µCi/mL).
In the first tube, 0.2 mL of KRB solution was added to obtain a control solution. In the second tube, 0.2 mL of the vehicle with 2 µL of 1 mM ionomycin (final 1 µM) was added to obtain a positive control. In the third tube, 0.2 mL of the vehicle with 2.5 g/L of SAB (final ratio 250 µg/mL) was added for the SAB stimulation. The cell
suspensions were incubated with 95% O2 / 5%CO2 gas mixture at 37°C during the experiment. At 0, 10, 20 and 30 min, 0.5 mL of the suspensions were extracted from each of the tubes. The extracted samples were centrifuged at 5,000 rpm (2,000 g) for 1 min and the supernatant was discarded. The extracted samples were washed 3 times by KRB solution. Thereafter 100 µL of 0.5 N NaOH was added to solubilize the cells. Finally, 2 mL of liquid scintillation cocktail (Ultima Gold, Perkin Elmer, MA, USA)
was added and the radioactivity of each sample was counted by the liquid scintillation counter (Beckman, LS 6000TA).
II-10. Increase in microcirculation as measured by A-V pressure difference. Both the artery and the vein of the isolated gland were cannulated and vascularly perfused with perfusion fluid. Blood pressure transducers (MLT0670, AD Instruments, NSW, Australia) were placed on the arterial and venous sides of the perfusion system to measure the pressure difference between perfusate and effluent. The values were recorded in computer and the pressure differences between the artery and the venous sides of the SMG were calculated (POWER Lab, AD Instrument, NSW, Australia).
II-11. Assessment of the paracellular transport using LY secretion as an indicator. The isolated SMGs were vascularly perfused with a perfusate containing 50 mg/L Lucifer Yellow K salt (LY, mw=521.56, L1177, Molecular Probe, OR, USA). A reserve sample of LY buffer was kept for establishing the standard curve after the gland
perfusion. During the stimulation, the secreted saliva was collected every minute. The samples were weighed and immediately labeled as fluid secretion. After the addition of 100 µL of distilled water, the samples were mixed well and 100 µL of the mixed sample was shifted to the microplate reader (DTX800, Beckman Coulter, CA, USA). The calibration curve was obtained by a diluted series of the LY solution as 0.1, 0.05, 0.025, 0.0125, 0.00625, 0.003125, 0.0015625, 0.00078625, and 0.000390625 of the perfusate. To avoid a time lag considering the small secretion, the catheter for sampling was shortened as much as possible and the sampling time was corrected by the volume of the catheter lumen.
II-12. Statistics. The values for the salivary fluid flow rates were presented as means ± SE. N was the number of glands. Statistically significant differences between the values were determined by student’s t-test or one way ANOVA, P values below 0.05 were regarded as statistically significant.
III. Results.
III-1. Characteristics of the Danshen-induced salivary fluid secretion.
III-1-1. Time course of the DS induced salivary fluid secretion. A low dose of CCh (0.2 µmol/L) was used as control stimulation to normalize the variation of fluid secretion shown by individual glands. All values for the fluid secretory rate during the experiment were normalized to the fluid secretion at 5 min of the control CCh
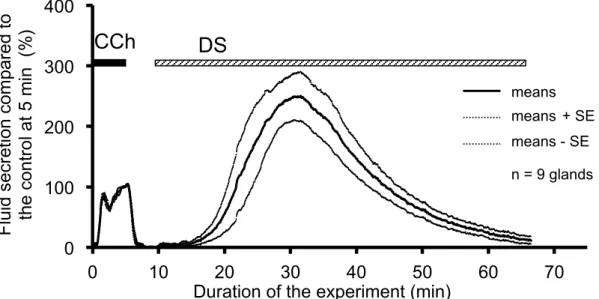
stimulation. Addition of the CCh immediately induced salivary fluid secretion. In contrast, after the addition of the DS, the fluid secretion did not start immediately, i.e., latency was observed, as shown in Figure 1-1.
The DS-induced secretory process had two stages. Initially the fluid secretion increased gradually to reach the highest secretion (64.9 ± 10.7 µL/g-min, 250.1 ± 40.3% of the CCh control at 5 min). Thereafter, the fluid secretion declined gradually to the plateau value (3.9 ± 1.4 µL/g-min, 12.0 ± 5.1% of the CCh control) at 60 min as shown in Figure 1-1. After this decline, the gland did not start another fluid secretion process even during prolonged perfusion with DS.
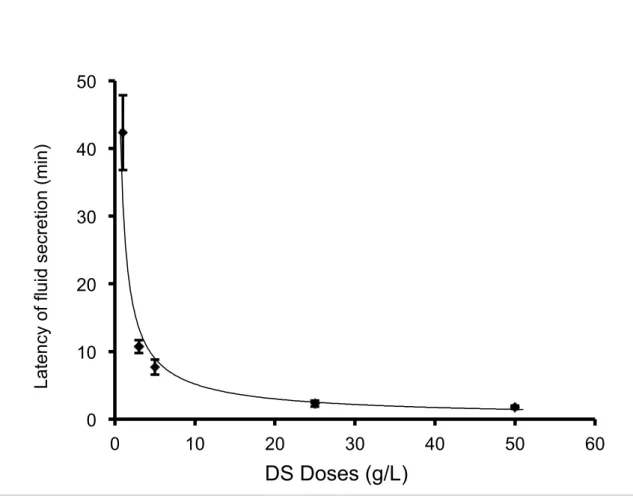
III-1-2. The latency of the salivary fluid secretion decreased with high doses of DS perfusion. The latency is the time period required for the SMG to start fluid secretion, that is, the time from the application of DS perfusion to the start of fluid secretion. The
latency of the salivary secretion was observed at different doses of DS, as shown in Figure 1-2. The latency of the salivary fluid secretion (mean ± SE) decreased with higher doses of DS perfusion: 42.3 ± 5.5 min at 1 g/L DS (n = 6), 10.7 ± 1.0 min at 3 g/L (n = 9), 7.7 ± 1.1 min at 5 g/L (n = 9), 1.3 ± 0.5 min at 25 g/L (n = 6) and 1.8 ± 0.3 min at 50 g/L (n = 8), respectively (n = the number of glands employed for each dose).
Figure 1-1. Time course of the DS-induced salivary fluid secretion. After control stimulation with 0.2 µmol/L CCh for 5 min, the DS (5 g/L) was introduced at 10 min and perfused for 60 min. The bold and dotted lines show, respectively, the average values and the means ± SE of the salivary fluid secretion of 9 glands.
0 100 200 300 400
0 10 20 30 40 50 60 70
Fluid secretion compared to the control at 5 min (%)
Duration of the experiment (min)
mean +se -se
CCh DS
means means+ SE means - SE n = 9 glands
Figure 1-2. The latency of different doses of DS perfusion. The latency of the fluid secretion was shown as mean ± SE for different DS doses. The latency reduced as the dose of DS increased.
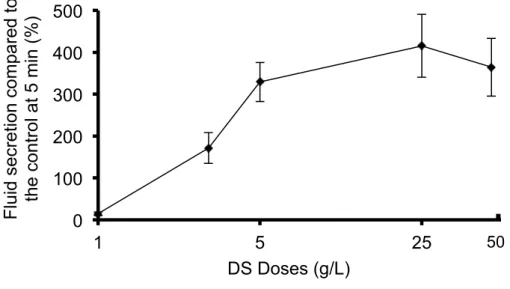
III-1-3. Highest secretory rate of the DS-induced salivary fluid secretion. The fluid secretion induced by DS perfusion was demonstrated in a dose-dependent manner within the range of 1-50 g/L. DS perfusion in the rat SMGs at doses of 1, 3, 5, 25 and 50 g/L induced the highest fluid secretion of 14.7 ± 4.3% of the CCh control fluid secretion, with the various doses showing fluid secretion values of 171.5 ± 36.7%, 325.2 ± 46.4%, 415.3 ± 66.8%, and 364.0 ± 68.7%, respectively, as shown in Figure 1-3. There was no significant difference among the groups with 5, 25 and 50 g/L. The
median effective dose (ED50) of DS was 3.5 g/L, calculated by the straight line of regression method (Y = 77.6X – 62.4, R2 = 1).
0 10 20 30 40 50
0 10 20 30 40 50 60
Latency of fluid secretion (min)
DS Doses (g/L)
Figure 1-3. Dose response of the highest DS-induced fluid secretion. The highest fluid secretion was shown as mean ± SE and the doses of DS employed were 1, 3, 5, 25 and 50 g/L, respectively. The fluid secretion increased from 1 g/L to 5 g/L, and reached a plateau level at the higher doses.
III-2. Contribution of Na+/K+/2Cl- cotransporter and Na+/K+ ATPase to the DS-induced fluid secretion.
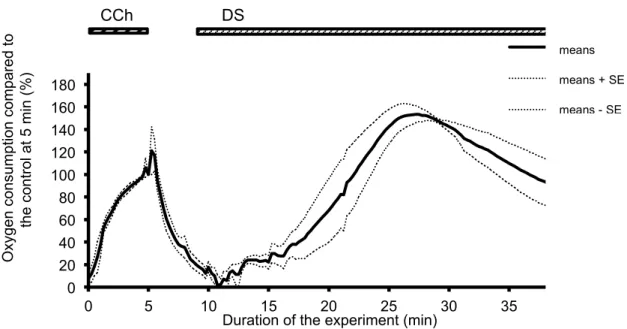
III-2-1. Oxygen consumption during the DS-induced salivary fluid secretion. The oxygen consumption of the isolated SMGs increased rapidly after the administration of DS without any latency. Corresponding to the induction of the fluid secretion, the oxygen consumption increased and reached the highest value at 27.25 min (46.0 ± 4.0 mmHg, 153.5 ± 7.4% of the control stimulation with CCh), following by a gradually decrease as shown in Figure 2-1.
0 100 200 300 400 500
1 5 25
Fluid secretion compared to the control at 5 min (%)
DS Doses (g/L)
50
Figure 2-1. Time course of the A-V difference of PO2 during the DS perfusion. CCh stimulation was conducted for 5 min. as a control measure. At 10 min., DS was added and perfused for 30 min. This figure shows the average values (bold line, n=5 glands) and the standard error of the means (means ± SE, dotted lines).
III-2-2. Ouabain decreased fluid secretion and oxygen consumption. Ouabain, an inhibitor of Na+ / K+ ATPase, was applied to assess the activity of the primary active transport during DS stimulation. The fluid secretion was measured by 1 mmol/L ouabain during stimulation with 5 g/L DS stimulation. The fluid secretion decreased to a plateau level of 24.3 ± 1.1% at 26-29 min. The remaining fluid secretion during inhibition by ouabain was compared with the maximum fluid secretion induced by the same dosage of DS (250.1 ± 40.3%, at 5 g/L). Ouabain significantly (P < 0.05)
decreased the DS-induced fluid secretion by 90% of the highest value. After the removal of ouabain, the fluid secretion showed a slight recovery, and thereafter gradually decreased to reach the zero-level, as shown in Figure 2-2 A.
0 20 40 60 80 100 120 140 160 180
0 5 10 15 20 25 30 35
Oxygen consumption compared to the control at 5 min (%)
Duration of the experiment (min)
me me +SE me SE
CCh DS
means means + SE means - SE
0 20 40 60 80 100 120 140 160 180
0 5 10 15 20 25 30 35 40 45 50 55
Fluid secretion compared to the control at 5 min (%)
Duration of thr experiment (min)
mean-se mean+se mean
CCh ouabain 1 mmol/L
DS
means - SE means + SE means A.
Figure 2-2. Inactivation of Na+/K+ ATPase by ouabain. A. DS-induced salivary fluid secretion. CCh stimulation was conducted for 5 min as control measure. At 20 min ouabain was added for 5 min, and the DS-induced fluid secretion decreased significantly (P < 0.05). The figure shows the average (bold line, n=5 glands) and the
0 20 40 60 80 100 120 140 160 180 200 220
0 5 10 15 20 25 30 35 40
Oxygen consumption compared to the control at 5 min (%)
Duration of the experiment (min) DS
ouabain 1 mmol/L mean mean+SE mean-SE 44444
CCh
means means + SE means - SE B.
standard error of mean (mean ± SE, dotted lines). B. Oxygen consumption during DS-stimulation. At 25 min ouabain was added for 5 min, and the oxygen consumption decreased significantly (P < 0.05). This figure shows the average values (bold line, n=5 glands) and the standard error of means (means ± SE, dotted lines).
The addition of ouabain decreased the oxygen consumption to 93.6 ± 15.3% of control by CCh (153.5 ± 7.4% in the sole DS group). After the removal of the ouabain, the oxygen consumption partially recovered, and then gradually decreased, as shown in Figure 2-2 B.
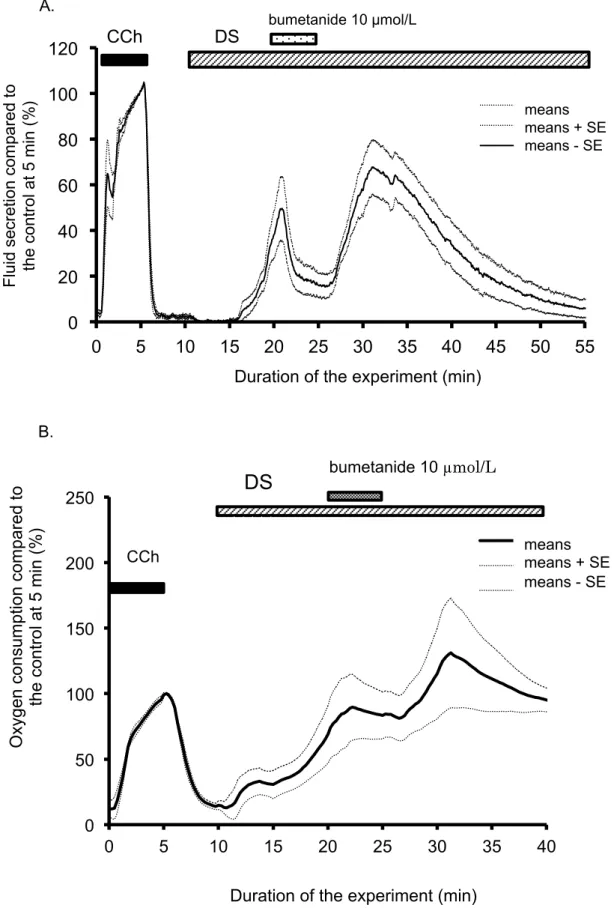
III-2-3. Bumetanide decreased fluid secretion and oxygen consumption. Bumetanide was used to block the NKCC1 cotransporter. Bumetanide (10 µmol/L) was
administrated at 10 min from the start of the DS administration, and then removed at 15 min. Bumetanide significantly decreased the DS-induced fluid secretion to a plateau level of 17.2 ± 0.7% at 23-26 min. After the removal of the bumetanide, the salivary fluid secretion increased again to the peak. Thereafter the fluid secretion gradually decreased to the zero-level. The decreased level of fluid secretion was significantly lower than the maximum fluid secretion of the DS-induced salivary fluid secretion. The residual fluid secretion during inhibition by bumetanide was 17.3 ± 6.5 µL/g-min at 27 min from the start of the experiment. The inhibition of salivary fluid secretion was 91.2% of the maximum secretion induced by DS. This finding indicates NKCC1 is activated during DS induced fluid secretion (Figure 2-3 A).
The increase in oxygen consumption by DS was stopped by bumetanide and stayed at the plateau level of 86.1 ± 22.1% at 21-25 min. After removal of bumetanide, the oxygen consumption increased again to the peak (Figure 2-3 B).
0 20 40 60 80 100 120
0 5 10 15 20 25 30 35 40 45 50 55
Fluid secretion compared to the control at 5 min (%)
Duration of the experiment (min)
mean-se mean+se mean
CCh DS bumetanide 10 µmol/L
means means + SE means - SE A.
Figure 2-3. A. The effects of bumetanide on DS-induced salivary fluid secretion. Initially, CCh was added for 5 min as a control measure. At 20 min bumetanide was added for 5 min, and the fluid secretion decreased significantly to a plateau inhibited level (P < 0.05). This figure shows the average values (bold line, n=6 glands) and the
0 50 100 150 200 250
0 5 10 15 20 25 30 35 40
Oxygen consumption compared to the control at 5 min (%)
Duration of the experiment (min)
DS
mean mean+SE mean-SE 44444
bumetanide 10 µmol/L
CCh means means + SE
means - SE B.
standard error of the means (means ± SE, dotted lines). B. The effects of bumetanide on DS-induced on DS-induced oxygen consumption. The oxygen consumption was shown by A-V difference of partial oxygen pressure (mmHg). Initially, CCh was added for 5 min as a control measure. At 20 min bumetanide was added for 5 min.
III-2-4. Comparison of the inhibition between ouabain and bumetanide. Ouabain inhibition of Na+/K+ ATPase decreases both the ATP hydrolysis and the driving force of Na+ entry and K+ release. As a result, the oxygen consumption decreases, the Cl- entry via the cotransporters and antiporters are decreased, and then fluid secretion will be reduced. On the other hand, bumetanide blocks only NKCC1. The DS stimulation induced a salivary fluid secretion, accumulating to 1428.0 ± 152.8 µL/g for 60 min. The maximal fluid secretion due to DS (5 g/L) was 2.5 times larger than that of CCh (0.2 µmol/L). Bumetanide (10 µmol/L) decreased the fluid secretion rate to 17.2 ± 0.7% of the CCh control. Because the highest DS fluid secretion was 250.1 ± 40.3% of the CCh control, bumetanide inhibited the highest fluid secretion by 93% of the highest
DS-induced fluid secretion. In contrast, ouabain decreased the fluid secretion rate to 24.3 ± 1.2% of the CCh control (P < 0.01), which means that ouabain inhibited the fluid secretion by 90% of the highest DS-induced fluid secretion. The inhibition by
bumetanide was significantly larger than that due to ouabain (P < 0.05) as shown in Figure 2-4.
Figure 2-4. The residual DS-induced fluid secretion during inhibition due to ouabain or bumetanide. This figure shows the standard error of the means (means ± SE) of the salivary fluid secretion. Ouabain (the inhibitor of Na+/K+ ATPase ) and bumetanide (the inhibitor of NKCC1) decreased the DS-induced fluid secretion due to the DS (n = 9). The DS column indicates the maximum response of the fluid secretion due to DS (5 g/L).
The oxygen consumption was measured as an arterio-venous difference in the partial oxygen pressure (A-V difference in PO2, mmHg). Although this value includes the oxygen that escaped from the gland surface and the perfusion line, the A-V PO2
difference was normalized (%) by the value at 5 min during CCh stimulation. The AV
0 50 100 150 200 250 300 350 400
Fluid secretion compared to the control by CCh at 5 min (%)
difference in PO2 was 93.6 ± 2.3 mmHg at 5 min from the start of the CCh stimulation. DS increased the A-V PO2 difference to the highest value, 153.5 ± 7.4% of CCh, at 27 min from the start of the experiment, as shown in Figure 2-1. Ouabain (1 mmol/L) was added about 25 min for 5 min, as shown in Figure 2-2 B. Ouabain decreased the oxygen consumption to 97.1 ± 4.0% of the CCh control at 29-31min. Bumetanide (10 µmol/L) decreased the oxygen consumption to 86.1 ± 22.1% (at 21-25 min) of the CCh control. Therefore, as a minimal estimation, ouabain inhibited the oxygen consumption by 37% and bumetanide inhibited it by 44%.
III-3. Participation of muscarinic or α1 adrenergic receptors in DS-induced fluid secretion. Figure 3 shows the highest secretion rate during perfusion with DS, DS with atropine, and DS with phentolamine, which were shown as % of fluid secretion rate due to CCh at 5 min. When atropine (1 µmol/L) or phentolamine (5 µmol/L) was applied separately on the DS perfusion, the salivary fluid secretion decreased slightly, but not significantly, to 221 ± 60% (n = 7) and 200 ± 66% (n = 14), respectively (DS induced a secretion at 250 ± 40, n = 9). The latency and the time course of the fluid secretion remained the same. The inhibition ratio of atropine and phentolamine was 12% and 20%, respectively, without any statistically significance differences (P > 0.5).
Figure 3. Effects of atropine and phentolamine on the DS stimulation. The standard error of means (means ± SE) of the highest fluid secretion was shown in the DS only group (n = 9), the DS with atropine (n = 7), and the DS with phentolamine (n = 14). The number of the glands employed was shown as N. The values were expressed as
percentage of the fluid secretion rate at 5 min with CCh as control. Among the 3 groups, there was no significant difference (P > 0.5)
III-4. Requirement of extracellular Ca2+ for DS-induced fluid secretion. As for physiological stimulation necessary to induce salivary fluid secretion, the increase in cytosolic Ca2+ level ([Ca2+]i) is necessary for activation of K+ channels on the
basolateral membrane and Cl- channel on the luminal membrane. After the initial release of Ca2+ from cytosolic stores, the elevated [Ca2+]i is maintained by the balance
0 50 100 150 200 250 300 350 400
Fluid secretion compared to the control by CCh at 5 min (%)
of entry and extrusion of cytosolic Ca2+. In order to examine the Ca2+ entry during DS stimulation, the Ca2+ in the perfusate was removed nominally without any chelating agent. During Ca2+-free perfusion, CCh (0.2 µmol/L) was perfused from 5 min to 10 min, followed by perfusion with DS (25 g/L) for 15 min. DS and CCh could hardly induce any fluid secretion. During DS perfusion, the highest fluid secretion rate was only 1.8 ± 0.8 µL/g-min at 8.65 min (n = 8) (while during perfusion with DS and Ca2+, the fluid secretory rate was 101.9 ± 17.2 µL/g-min at 8.65 min, n = 6, P < 0.01). These results indicated that the extracellular Ca2+ was essential for DS to induce salivary fluid secretion.
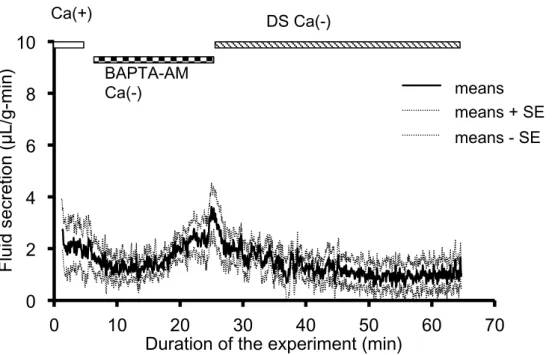
The requirement for cytosolic Ca2+ was also tested by application of the cytosolic Ca2+ chelating agent, BAPTA-AM. By perfusion with BAPTA-AM (100 µmol/L)in the Ca2+-free perfusate for 20 min, Ca2+ could be chelated in the cytosol of SMG cells. Then the perfusion was changed to the Ca2+-free perfusate with DS. The gland tested did not induce any fluid secretion due to DS, except for the initial quick and small increase in the fluid secretion. The salivary fluid secretion was significantly lower during perfusion with BAPTA-AM than the base secretion during control perfusion with Ca2+ before the experiment (P < 0.001) as shown in Figure 4.
Figure 4. Chelation of cytosolic Ca2+ with BAPTA-AM. CCh (0.2 µmol/L) and DS (5 g/L) were perfused respectively in this condition, however, neither of these
secretagogues induced any significant amount of salivary fluid secretion.
III-5. The effect of SAB on uptake of Ca2+. SAB is a main effective component of DS and induces a similar fluid secretion pattern to that by DS. To reduce the masking effect of DS on the fluorescence by Ca2+ indicators, SAB was used for the experiment using isolated SMG cells. However, the measurement of intracellular Ca2+ by fluorescent Ca2+ indicators (Indo-1, CaTM-2, and Fura-2.) were not succeeded due to masking of the fluorescence of Ca2+ indicators even by the SAB, as described in Appendix 1. Instead, the radioisotope 45Ca was applied to examine the uptake of Ca2+ by the isolated SMG cells, as shown in Appendix II.
III-6. Paracellular fluid transport during the DS perfusion. Recently the transcellular fluid secretion by the parotid salivary gland was measured by dilution of luminal LY
0 2 4 6 8 10
0 10 20 30 40 50 60 70
mean mean+SE mean-SE BAPTA-AM
Ca(-)
DS Ca(-)
Fluid secretion (µL/g-min)
Duration of the experiment (min) Ca(+)
means means + SE means - SE
upon CCh stimulation (Segawa et al., 2002). Compared to the whole secretion by the gland, the paracellular fluid secretion was more than 60% of the whole secretion. In addition, the microcirculation is dilatated in order to supply enough oxygen and fluid to the secretory end pieces, thus the local hydrostatic pressure increases to facilitate paracellular transport. The dilataion of the microcirculation can be monitored by A-V pressure difference. Based on this evidences, the paracellular transport was assessed by measurement of LY.
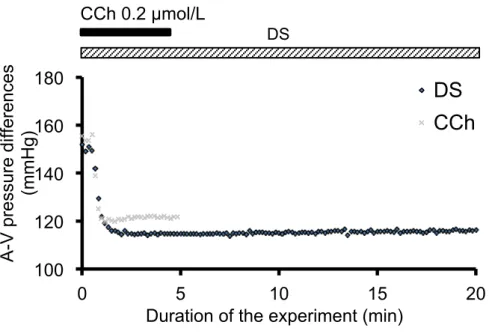
III-6-1. Increase in microcirculation measured by A-V pressure difference. Decrease in the A-V pressure difference is reflexed by increases in the total area of the vascular bed and increases in the microcirculation in the acinar area. The A-V pressure
difference was immediately decreased by DS, and reached a plateau level after 1 min. Compared to CCh (0.2 µmol/L) at 4 to 5 min, the decrement of A-V pressure difference due to DS (5 g/L) was significantly higher than that due to CCh (38 ± 3 mmHg by DS and 30 ± 3 mmHg by CCh, n = 7, P < 0.05).
Figure 5-1. A-V pressure differences during DS (black) or CCh (gray) perfusion.
III-6-2. Increase in paracellular transport measured by LY secretion. LY secretion at 5 min from the start of CCh stimulation was set as 100%. DS was added at 15 min. Thereafter the LY secretion increased to the highest value of 61.2 ± 7.1% at 30 min. Then the LY secretion decreased to almost zero at 25 min from the start of the DS perfusion. The LY secretion was significantly different between the CCh and DS stimulation (P < 0.05, n = 6), indicating that DS could increase the paracellular permeability for fluid secretion. The time course of LY secretion was in parallel with the total fluid secretion during the DS-stimulation. However, the LY secretion was decreased to 60% of that due to CCh, whereas the highest fluid secretion due to DS was 250% of the CCh-induced secretion. This finding suggests that DS induces more
transcellular fluid secretion than paracellular fluid secretion. 100
120 140 160 180
0 5 10 15 20
DS
CCh
A-V pressure differences (mmHg)
Duration of the experiment (min) CCh 0.2 µmol/L
DS
Figure 5-2. LY secretion during CCh or DS perfusion. CCh was perfused for 10 min as a control measure (by 0.2 µmol/L) and DS was perfused from 15 min to 40 min from the start of the experiment. This figure shows the average values of the LY secretion (bold line, n=6 glands) and the standard error of the means (means ± SE).
IV. Discussion.
The application of traditionally used Chinese herbs to clinical medicine is increasing especially for chronic diseases all around the world. However, the
information on the mechanisms of their pharmaceutical action is limited. Collaborative experiments conducted by the Nanjing Medical College (China) and the National Institute for Physiological Sciences (Japan) screened the Chinese herbs that promote salivary fluid secretion in the isolated perfused rat salivary glands (Murakami et al., 2009a). During the collaborative work, the methods for screening the effective Chinese herbs were developed. As a result, it was discovered that Danshen (DS) induced
salivary fluid secretion without other added stimulants. The present work was planned
8
L Y s ecr et io n co m pa red to t he co nt ro l at m in %
uration of experiment min
h S
to clarify the mechanism by which DS induces salivary fluid secretion. During this study, a number of different methodologies required to pursue the mechanisms involved in salivary secretion were combined. This set of methodologies will be useful for future studies in the search for new drugs with unknown mechanisms for salivary fluid
secretion.
IV-1. DS. DS is obtained from the dried root of Salvia miltiorrhiza, a native plant in China and Japan. In 1934, Nakao and Fukushima first isolated the tanshinones from Danshen. According to the traditional usage, Danshen is reduced into a water decoction, which contains more hydrophilic components. Therefore, the phenolic acids from Danshen have been extracted since the1980s, and were called the Salvianolic acids (Li et al., 1984; Ai and Li, 1988, 1992). In the present study, we used Ringer’s solution to dissolve DS, so most phenolic acids and a small amount of tanshinone were dissolved in our DS solution. The plant, Salvia miltiorrhiza, was briefly mentioned in Mabberley’s Plant-Book (2009), with a short comment on its use locally for heart conditions. However, DS is famous as a blood-activating drug in the field of Traditional Chinese Medicine (TCM). In TCM, the “blood-activating” means a treatment of the symptoms caused by the reduction of fluid secretion, such as dry mouth, dry eyes and so on (Jiang et al., 2002; Zhang et al., 2013). While the TCM reports have not revealed any
mechanism for production of saliva, it is well known in the field of Physiology that salivary fluid secretion is mainly induced by activation of the muscarinic receptors on salivary acinar cells. Acetylcholine (ACh) is released from parasympathetic nerve endings and binds with this receptor, then links with elevation of cytosolic Ca2+ levels. The elevation of cytosolic Ca2+ levels activates the Cl- channel to release Cl- into lumen.
The mechanisms in which DS induces salivary fluid secretion may be hidden within this sequential mechanism.
During the screening Chinese herb, they used a moderate concentration of CCh, 0.2 µmol/L. Because the concentration 1 µmol/L, is a supermaximal concentration for salivary fluid secretion, the moderate concentration was suitable to examine if the fluid secretion was promoted or not. In addition, they normalized the values for fluid
secretion and oxygen consumption to avoid variations among individual glands. This measure was implemented because the responses to Chinese herb could vary among the individual rats and the surgical procedures employed were not fully developed yet by the young investigators (Murakami et al., 2009a). The collaborative study showed that DS promotes salivary fluid secretion, compared with CCh, and could be a promising drug in treatment for the relief of dry mouth caused by hypofunction of salivary gland. However, the characteristics and possible mechanisms associated with the sole use of DS have not been studied.
IV-2. DS-induced salivary fluid secretion. Sole DS stimulation induced a fluid
secretion by the isolated and perfused SMG of the rat. However, the time course of the secretion by DS was different from the CCh-induced fluid secretion. DS started fluid secretion with a time period latency and the secretion gradually increased to reach the highest value, which was 2.5 times higher than the fluid secretion at 5 min due to CCh. This type of high fluid secretion due to DS has not been reported previously. However, the fluid secretion slowly declined from the highest value to zero-level around 60 min from the start of the DS administration. These characteristics suggested the mechanism for DS-induced salivary fluid secretion was different from that induced by CCh or ACh.
CCh and ACh activate the M3 receptor to release IP3 and quickly release Ca2+ from IP3-regulated calcium-stores (Menniti et al., 1991). The following process including channel activation and quick osmosis, results in a quick onset of fluid secretion. Fluid secretion can be quickly started by activation of the α1 adrenergic receptors (Martinez et al., 1975; Bockman et al., 2004) and neurokinin A receptors (Qi et al., 2010). Therefore DS induced secretion could use a different signalling process, compared with IP3-store Ca2+ release signalling.
The clinical dosage of DS ranges from 10 to 50 g/person because the treatment recipe is usually a mixture of several herbs, and the proportion of DS varies depending on the individual symptoms. For experimental convenience, we adopted an average dose of 25 g/person for the experiment. Assuming that all the DS will move to the blood circulation (5 L for 60 kg body weight), the concentration of DS in the blood will be 5 g/L. We took 5 g/L as a standard concentration of DS in the perfusion fluid. On the other hands, the relationship between DS dose and fluid secretion was examined using a series of doses at 1, 3, 5, 25, and 50 g/L. The highest fluid secretion increased with the higher dose of DS, while the latency was shorter at the higher doses of DS. The results of the dose of 5 g/L were slightly higher than the ED50. These results suggested that we can control clinically the level of fluid secretion between 5 g/L and 25 g/L, which was also within the safe therapeutic dose. At doses higher than 25 g/L, the effect of the DS would not improve and side effects may appear, such as bleeding. Therefore, the administration of DS requires rigorous guidance and clinical observation. These results may be of some help for studies on the clinical applicability of DS.
The latency decreased as the dose of the DS was increased. This feature was apparently different from the instant reaction shown when the salivary fluid secretion
was stimulated by CCh through muscarinic receptors. Our previous study (Murakami et al., 2009a) showed that CCh rapidly stimulated salivary fluid secretion by the SMGs through the activation of muscarinic receptors. When perfused with DS, it took a long time to induce salivary fluid secretion, and there was no initial peak effect. However, when CCh was added to the DS perfusion at an early time, a marked superimposed peak in the salivary fluid secretion was shown. The salivary fluid secretion by the SMGs induced by DS decreased gradually after reaching the highest secretion (64.9 ± 10.7 µL/g-min, 250.1 ± 40.3% of the CCh control, at 21.5 min), until the secretion stopped. Although continually perfused with DS, the gland did not secrete further after the secretion stopped. However, after washing with buffer solution, salivary fluid secretion was induced again when stimulated by DS. These phenomena indicated that DS may have other mechanisms to promote salivary fluid secretion, which were also different from that of the muscarinic and α1 receptors.
In summary, at doses over 25 g/L, the effect of the DS would not improve and there is a risk of side effects, such as bleeding. Therefore, the administration of DS requires rigorous guidance and clinical observation.
IV-3. Inhibition of Na+/K+ ATPase during the DS-stimulation. The increase in oxygen consumption reflects the increased energy metabolism during fluid secretion (Murakami 1979, 1981). Because the increment of the oxygen consumption becomes the same as the increase in heat production, this suggests that the energy metabolism is mostly from oxidative phosphorylation in mitochondria. In addition, the increment of the oxygen consumption and the K+ uptake during the post-stimulatory activation of Na+/K+ ATPase were compared, and the results showed that the increase in oxygen
consumption during fluid secretion is mostly from the activation of Na+/K+ ATPase (Murakami et al., 1990). However, the protein synthesis and its secretion contributed less to the increase in the oxygen consumption during the combined stimulation of CCh and isoproterenol (β-adrenergic stimulant, Murakami et al., 2000). Finally, we managed to estimate the activation of Na+/K+ ATPase from the decrement of oxygen
consumption during ouabain application.
IV-3-1. Oxygen consumption during latency during DS stimulation. The oxygen consumption of the gland immediately increased after the administration of DS, even though there was no fluid secretion. This indicated that some energy consuming processes were activated by DS. Because the dilation of capillary bed and thus the promotion of microcirculation occurred simultaneously, the energy metabolism of the uncirculated region was possibly added due to the shunt closure. The fluid secretion started several minutes later, so these processes probably did not include fluid secretion. The promotion of microcirculation could probably to be one of these processes. Another possibility is the activation of the synthesis of secretory proteins. However, protein secretion was not measured in this study.
IV-3-2. Oxygen consumption during DS-induced secretion. The time courses of the oxygen consumption and the salivary fluid secretion were similar during the DS stimulation, showing a slow increase and gradual decline. This suggests a close relationship between fluid secretion and the activation of Na+/K+ ATPase. Ouabain (g-strophanthin) is a blocker of Na+/K+ ATPase. Na+/K+ ATPase is located on the basolateral membrane of the salivary acinar gland. According to the mostly accepted model for salivary fluid secretion mechanism (Catalan et al., 2009), cytosolic K+ is continuously released across the basolateral membrane through Ca2+-activated K+
channels. The driving force for K+ release is the electrochemical potential of K+, which is established by Na+/K+ ATPase. Na+/K+ ATPase pumps K+ in the cell and Na+ is pumped out. During the hydrolysis of one ATP, Na+/K+ ATPase extrudes 3 Na+ ions for the uptake of 2 K+ ions, which produces a negative membrane potential. Therefore the enzyme also maintains a Na+ electrochemical potential for Na+ entry, which drives the Na+/K+/2Cl- cotransporter for Cl- uptake. The addition of ouabain blocked the Na+/K+ ATPase, while the DS-induced fluid secretion significantly decreased to a plateau level. This decrease in salivary fluid secretion recovered with the removal of ouabain.
In the present experiment, the oxygen consumption due to the DS stimulation followed the time course of the fluid secretion. The highest level of the oxygen
consumption due to the DS stimulation increased significantly, compared with that due to CCh. Importantly, ouabain suppressed the fluid secretion by 90%. These findings suggest that DS-induced fluid secretion is maintained by activation of Na+/K+ ATPase and that the increased energy metabolism is mostly supplied for the DS-induced fluid secretion.
IV-4. Inhibition of Na+/K+/2Cl- cotransporter during the DS-stimulation. It has been widely accepted that the Na+/K+/2Cl- cotransporter uptakes Cl- from the basolateral side against the Cl- electrochemical potential, making Cl- the driving force for Cl- release through the luminal Cl- channel (TMEM16A). Bumetanide inhibits the activity of the Na+/K+/2Cl- cotransporter. Bumetanide, at 100 µmol/L, abolished the fluid secretion of the rat SMGs by ACh (1 µmol/L) during perfusion without bicarbonate (Murakami 1997, unpublished). However, bumetanide decreased the fluid secretion by 33% of the sustained fluid secretion during perfusion with bicarbonate (Murakami 1997,