Functional Constraints vs. Test Compression in Scan-Based Delay Testing
Ilia Polian
1,2Hideo Fujiwara
11Graduate School of Information Science 2Institute for Computer Science Nara Institute of Science and Technology, Japan University of Freiburg, Germany
[email protected], [email protected]
Abstract
We present an approach to prevent overtesting in scan-based delay test. The test data is transformed with respect to func- tional constraints while simultaneously keeping as many po- sitions as possible unspecified in order to facilitate test com- pression. The method is independent of the employed de- lay fault model, ATPG algorithm and test compression tech- nique, and it is easy to integrate into an existing flow. Exper- imental results emphasize the severity of overtesting in scan- based delay test. Influence of different functional constraints on the amount of the required test data and the compres- sion efficiency is investigated. To the best of our knowledge, this is the first systematic study on the relationship between overtesting prevention and test compression.
Keywords: Overtesting prevention, Functional con- straints, Scan-based delay test, Test compression
1 Introduction
Extensive use of design for testability (DFT) techniques, in- cluding scan and test points, and non-nominal test methods such as low-voltage test and IDDQtest [1, 2] lead to overtest- ing, i.e., the IC is demonstrated to fail, but under conditions which cannot occur in its normal operation mode. One rea- son for overtesting is the presence of latent defects, which are too small to cause a failure under nominal conditions or logically redundant. A further reason is the elevated level of IR drop and crosstalk effects which is caused by atypical power consumption during test that does not correspond to the power consumption profile in normal operation [3]. Last but not least, behavior which does not contradict the speci- fication could be classified as “faulty behavior” by the test process if design tricks such as cycle stealing are employed. There appears to be no broad consensus whether overtest- ing should be maximized or prevented. On one hand, overtesting is assumed to be an efficient (and often the only) approach to detect latent defects, which are not critical yet but may deteriorate and become early-life failures [1, 4, 5]. On the other hand, it is argued that overtesting results in de- tections which are not necessarily due to a defect and that it mainly leads to yield loss, i.e., discarding good chips. It has also been reported that a non-functional test sequence can damage the chip by inducing heat dissipation that exceeds the limit the chip is designed for [6]. From this, the need to prevent overtesting by using only functional test data, which
can occur in the IC’s normal operation mode, is deduced [3, 6, 7, 8, 9, 10, 11].
Several methods exist to prevent overtesting. They in- clude generating functional patterns by a special ATPG [8, 9], transforming existing non-functional test sets into func- tional test sets [6] and providing on-chip hardware to block non-functional patterns from being applied [10]. Whether test data is functional or not, is decided based on functional constraints. There are different types of such constraints and different exact and approximate methods for their computa- tion, as will be explained in detail later.
In this paper, we study overtesting prevention in a test compression scenario. Test compression is an essential tech- nique for handling the growth of test data [12]. Modern test compression approaches work in two stages: first, an ATPG is used to generate test patterns, and then an encoding al- gorithm is run over these patterns. Since the efficiency of the encoding grows with the fraction of don’t care (X) val- ues in the test data, the ATPGs used in test compression are tuned to specify as few bits as possible. One goal in the design of our method is to minimize the impact on the ex- isting flow. Thus, we do not propose any modifications to the existing ATPG tool (such as done in [8]) if it does not support functional constraints or supports only a subset of the needed constraints. We are also not considering adding any hardware to the design like in [10]. We focus on the use of scan in delay test as the source of overtesting for the following four reasons [7]: First, the application of non- functional test pairs may result in DFT overhead. Second, only a small subset of all possible state transitions are realiz- able, i.e., many physical paths cannot be sensitized in normal operation. Third, timing optimization of paths which are not sensitizable in normal operation would be required to avoid rejection of good ICs without any benefit for normal oper- ation. Fourth, wrong paths could be sensitized in transition fault testing, leading to yield loss and debugging effort.
We introduce a tool, called FUJISAN (FUnctional con- straint JustIficator and Statistical ANalyzer). FUJISAN ac- cepts a delay test pair (TP) set (with Xes) as an input and transforms those TPs for which it is possible into functional test pairs. Several types of functional constraints are sup- ported. The resulting TPs still have a high number of Xes and can be handed to the encoding algorithm. This is the main advantage over the method from [6], which ends up with fully specified tests that are unlikely to be good to com- Design, Automation and Test in Europe 2006 (DATE'06) , pp. 1039-1044, March 2006.
press. Moreover, FUJISAN employs exact algorithms while [6] is based on approximations, and it supports more con- straints than [6]. FUJISAN does not require any modification of the ATPG nor the encoding software for test compression. Hence, it is easy to integrate into the flow.
We apply FUJISAN to path delay fault test sets generated for the combinational core of the circuit without consider- ing any constraints. We discuss the required amount of test data depending on the considered functional constraints. We track the percentage of Xes in the test sets before and after applying FUJISAN and make conclusions on the suitability of the data for test compression based on this information. We validate our conclusions by applying a simple represen- tative test compression algorithm to the respective test sets.
The remainder of the paper is organized as follows. The next session discusses the constraints considered in the pa- per. FUJISAN is introduced in Section 3. Experimental re- sults are reported in Section 4. Section 5 concludes the paper.
2 Functional Constraints
This section discusses the constraints Cube, FT, RS and SI, and the incorporation of further constraints. We call a TP with X values a test pair cube and a fully-specified TP which matches all the specified positions of a TP cube an instance of that TP cube. An instance is called functional with re- spect to some constraints if it satisfies these constraints, oth- erwise it is called non-functional. A TP cube is called (non- )functional if all its instances are (non-)functional, and par- tially functionalif some of its instances are functional and some are not. Speaking simply, our goal is to transform a partially functional TP cube into a functional TP cube while preserving as many Xes as possible.
Constraint Cube is not a functional constraint in a strict sense but complements other constraints in order to obtain a cube, which is suited for test compression encoding soft- ware. For example, suppose that only instance 111 of pat- tern 1XX violates a functional constraint (75% of the in- stances are functional). However, there is no cube repre- senting the set{100, 101, 110}. But current test compres- sion encoding algorithms require cubes as input. Hence, a cube representing a subset of{100, 101, 110} and having a large number of Xes must be used. The cubes 10X and 1X0both represent an optimal solution. Note that satisfying Constraint Cube dropped the share of functional pairs from 75% to 50%.
Constraint FT (functional transition) ensures the transi- tion between the first and second vector of the TP exists.
Constraint RS (reachable state) requires that the first vec- tor of the TP is reachable from an initial state of the circuit and thus can occur in normal operation.
Constraint SI (steady input) assumes that the external fre- quency (I/O frequency) of a chip is lower than its internal fre- quency, which is true for some of today’s designs. At-speed transitions are allowed at the chip’s flip-flops (FFs) but not at its primary inputs (PIs). A similar restriction was used in the LSI Logic study [13] (motivated by the shortcomings of the tester). Note that no path delay faults for paths starting at
a PI can be tested, which is acceptable as these paths are not switched at-speed.
While Constraints FT and RS are valid for any digi- tal synchronous circuit, Constraint SI is an example for a design-specific constraintwhich is derived from the knowl- edge about the characteristics of the chip (here, the differ- ence in external and internal speed). Other design-specific constraints are possible, such as one-hot state encoding con- straints. These constraints can be extracted from the HDL code if the designers formulate such restrictions as asser- tions. Although it is straightforward to integrate such or any other constraints into our framework, in this paper we do not consider any constraints beyond those described in this sec- tion.
3 FUJISAN
FUJISAN transforms a set of delay TP cubes with Xes into functional TP cubes with respect to the constraints from the last section (any constraint can be switched on or off). First, FUJISAN identifies for every TP its functional instances. Based on this information, a statistical profile of the test set is created. Each pair is classified as belonging to one of seven classes 0%, 0–20%, 20–40%, 40–60%, 60–80%, 80–100%and 100%. A pair belongs to Class 0% if it has no functional instance, to Class 100% if all of its instances are functional, to Class 0–20% if it has at least one functional instance, but less than 20% of its instances are functional, and so on.
If test compression is performed without running FU- JISAN first, a pair from Class 0–20% will result in a non- functional test with a probability between 80 and 100% (as- suming that the encoding algorithm assigns the Xes ran- domly). The probability is a lower bound if the encoding procedure is allowed to apply the same test several times. Hence, FUJISAN can be used to estimate the extent of overtesting in order to decide whether any corrective mea- sures are necessary.
FUJISAN is implemented using BDDs [14]. For a circuit with N PIs and F FFs, let fi be the logic function of the ithFF (primary outputs are irrelevant for this analysis). Let the test pair be(V, W ) := (v1. . . vN +F, w1. . . wN +F) with vi, wi∈{0, 1, X} and v1, . . . , vN, w1, . . . wNare the PI val- ues. The number of instances satisfying Constraint FT is de- termined by constructing the BDD of the transition function restricted to test pair(V, W )
T(y1, ..., yN +F) =!
vi̸=X
(yi≡vi)∧!
wi=1
fi(V )∧!
wi=0
¬fi(V ) (1)
and determining the size of its onset. The set S of reach- able states (for Constraint RS) is obtained by a state traver- sal from the initial state until a fixed point is reached: First, S is set to{s0} where s0 is the initial state. Then, all states reachable from the states currently in S are cal- culated: S := S ∪ {y1′, . . . , y′F|∃p ∈ IB ∃s ∈ S : fi(p1, . . . , pN, s1, . . . , sF) = yi′ ∀1 ≤ i ≤ F }. This step is repeated until S is not changed. The resulting set is ANDed
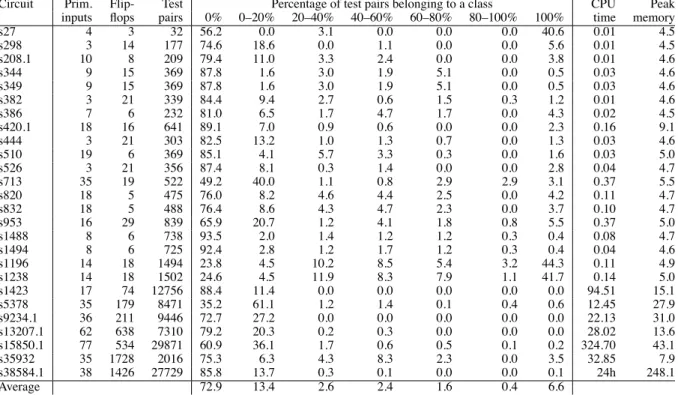
Circuit Prim. Flip- Test Percentage of test pairs belonging to a class CPU Peak inputs flops pairs 0% 0–20% 20–40% 40–60% 60–80% 80–100% 100% time memory
s27 4 3 32 56.2 0.0 3.1 0.0 0.0 0.0 40.6 0.01 4.5
s298 3 14 177 74.6 18.6 0.0 1.1 0.0 0.0 5.6 0.01 4.5
s208.1 10 8 209 79.4 11.0 3.3 2.4 0.0 0.0 3.8 0.01 4.6
s344 9 15 369 87.8 1.6 3.0 1.9 5.1 0.0 0.5 0.03 4.6
s349 9 15 369 87.8 1.6 3.0 1.9 5.1 0.0 0.5 0.03 4.6
s382 3 21 339 84.4 9.4 2.7 0.6 1.5 0.3 1.2 0.01 4.6
s386 7 6 232 81.0 6.5 1.7 4.7 1.7 0.0 4.3 0.02 4.5
s420.1 18 16 641 89.1 7.0 0.9 0.6 0.0 0.0 2.3 0.16 9.1
s444 3 21 303 82.5 13.2 1.0 1.3 0.7 0.0 1.3 0.03 4.6
s510 19 6 369 85.1 4.1 5.7 3.3 0.3 0.0 1.6 0.03 5.0
s526 3 21 356 87.4 8.1 0.3 1.4 0.0 0.0 2.8 0.04 4.7
s713 35 19 522 49.2 40.0 1.1 0.8 2.9 2.9 3.1 0.37 5.5
s820 18 5 475 76.0 8.2 4.6 4.4 2.5 0.0 4.2 0.11 4.7
s832 18 5 488 76.4 8.6 4.3 4.7 2.3 0.0 3.7 0.10 4.7
s953 16 29 839 65.9 20.7 1.2 4.1 1.8 0.8 5.5 0.37 5.0
s1488 8 6 738 93.5 2.0 1.4 1.2 1.2 0.3 0.4 0.08 4.7
s1494 8 6 725 92.4 2.8 1.2 1.7 1.2 0.3 0.4 0.04 4.6
s1196 14 18 1494 23.8 4.5 10.2 8.5 5.4 3.2 44.3 0.11 4.9
s1238 14 18 1502 24.6 4.5 11.9 8.3 7.9 1.1 41.7 0.14 5.0
s1423 17 74 12756 88.4 11.4 0.0 0.0 0.0 0.0 0.0 94.51 15.1
s5378 35 179 8471 35.2 61.1 1.2 1.4 0.1 0.4 0.6 12.45 27.9
s9234.1 36 211 9446 72.7 27.2 0.0 0.0 0.0 0.0 0.0 22.13 31.0
s13207.1 62 638 7310 79.2 20.3 0.2 0.3 0.0 0.0 0.0 28.02 13.6
s15850.1 77 534 29871 60.9 36.1 1.7 0.6 0.5 0.1 0.2 324.70 43.1
s35932 35 1728 2016 75.3 6.3 4.3 8.3 2.3 0.0 3.5 32.85 7.9
s38584.1 38 1426 27729 85.8 13.7 0.3 0.1 0.0 0.0 0.1 24h 248.1
Average 72.9 13.4 2.6 2.4 1.6 0.4 6.6
Table 1: Statistical profiles considering Constraint FT (numbers are in per cent) with function T . This is the exact algorithm for finding all
reachable states (which is an NP complete problem). Nu- merous approximate methods exists for this purpose. At this moment, FUJISAN does not incorporate any approximate technique. Constraint SI is implemented by propagating a specified value on a PI of first or second vector of a TP to the respective position of the other vector of that pair before building the BDD for function T .
If Constraint Cube is specified, FUJISAN writes out TP cubes which have only functional instances (if any such in- stances exist). FUJISAN tries to find the largest functional sub-instance, i.e., one with a maximal number of Xes, in or- der to help subsequent encoding. This is done by finding the shortest path of the transition function BDD and extending it to a prime implicant.
It is interesting that the amount of data to be provided for the testing depends on the employed functional constraint. If no functional constraint is imposed, then any bit position (both PIs and FFs) can have an arbitrary logic value. Thus, for a circuit with N PIs and F FFs2N + 2F bits must be provided per applied test pair. (While the question how to ac- tually deliver this test data to the chip and trigger an at-speed transition is out of scope of this paper, enhanced scan [15] is one possibility). If Constraint FT is enforced, then there is no need to provide the values for the FFs in the second time frame, as they can be calculated by the circuit using broad- side test application (launch-by-capture) [16]. This reduces the amount of bits to be delivered per TP to2N + F . If, in addition, Constraint SI is considered, this amount is reduced
to N + F , because the values on the PIs in the second time frame are simply the same as in the first time frame. Con- straint RS has no influence on the amount of test data.
It seems that considering more constraints results in test data reduction. On the other hand, in a test compression flow (which we are considering) the relevant number is the amount of compressed data that needs to be stored in the tester memory and not the data that is actually applied to the IC. It can be expected that justifying functional constraints will decrease the proportion of X values in the TP cubes even though FUJISAN will minimize this decrease. Hence, the compression ratio will probably be lower after justification. It is an interesting question whether the worsening in com- pression ratio overweighs the reduction in the size of the data to be encoded. The answer will be given by the experimental results.
4 Experimental Results
We applied FUJISAN to test sets generated by the tool TIP [17, 18] to ISCAS-89 circuits assuming no functional con- straints (enhanced-scan mode). The test sets have 100% ro- bust path delay coverage and are not compacted.
Table 1 quotes the results considering only Constraint FT (functional transition). The first four columns contain the name of the circuit, number of PIs, FFs and TPs generated by TIP. The subsequent seven columns report the percentage of the test pairs belonging to one of the seven classes introduced above. For brevity, we write “Class <20%” for “Class 0–
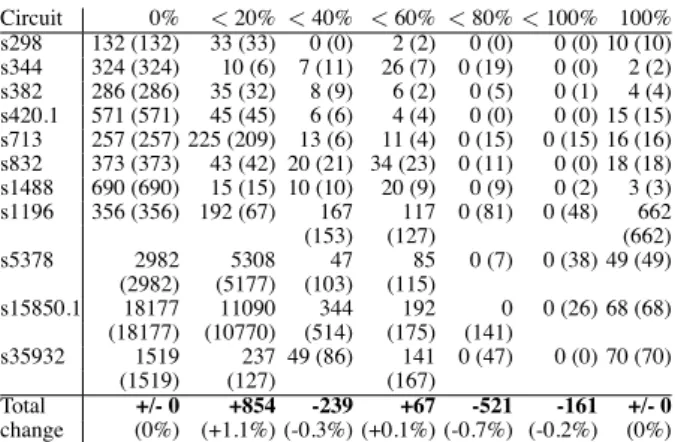
Circuit 0% <20% < 40% < 60% < 80% < 100% 100% s298 132 (132) 33 (33) 0 (0) 2 (2) 0 (0) 0 (0) 10 (10) s344 324 (324) 10 (6) 7 (11) 26 (7) 0 (19) 0 (0) 2 (2) s382 286 (286) 35 (32) 8 (9) 6 (2) 0 (5) 0 (1) 4 (4) s420.1 571 (571) 45 (45) 6 (6) 4 (4) 0 (0) 0 (0) 15 (15) s713 257 (257) 225 (209) 13 (6) 11 (4) 0 (15) 0 (15) 16 (16) s832 373 (373) 43 (42) 20 (21) 34 (23) 0 (11) 0 (0) 18 (18) s1488 690 (690) 15 (15) 10 (10) 20 (9) 0 (9) 0 (2) 3 (3) s1196 356 (356) 192 (67) 167 117 0 (81) 0 (48) 662
(153) (127) (662)
s5378 2982 5308 47 85 0 (7) 0 (38) 49 (49)
(2982) (5177) (103) (115)
s15850.1 18177 11090 344 192 0 0 (26) 68 (68) (18177) (10770) (514) (175) (141)
s35932 1519 237 49 (86) 141 0 (47) 0 (0) 70 (70)
(1519) (127) (167)
Total +/- 0 +854 -239 +67 -521 -161 +/- 0
change (0%) (+1.1%) (-0.3%) (+0.1%) (-0.7%) (-0.2%) (0%)
Table 2: Implications of Constraint Cube. Numbers in parentheses are valid if the constraint is not satisfied. The total change is calculated over all considered circuits
Circuit |RS| 0% <20% < 40% < 60% <80% <100% 100% s208.1 100.0 166 (166) 23 (23) 7 (7) 5 (5) 0 (0) 0 (0) 8 (8) s349 5.2 331 (324) 38 (6) 0 (11) 0 (7) 0 (19) 0 (0) 0 (2) s386 20.3 193 (188) 17 (15) 4 (4) 10 (11) 2 (4) 0 (0) 6 (10) s420.1 100.0 571 (571) 45 (45) 6 (6) 4 (4) 0 (0) 0 (0) 15 (15) s510 73.4 318 (314) 17 (15) 16 (21) 16 (12) 1 (1) 0 (0) 1 (6) s526 0.4 312 (311) 44 (29) 0 (1) 0 (5) 0 (0) 0 (0) 0 (10) s713 0.3 436 (257) 86 (209) 0 (6) 0 (4) 0 (15) 0 (15) 0 (16) s820 78.1 361 (361) 39 (39) 33 (22) 21 (21) 1 (12) 0 (0) 20 (20) s953 10−6558 (553) 281 (174) 0 (10) 0 (34) 0 (15) 0 (7) 0 (46) s1488 75.0 690 (690) 15 (15) 15 (10) 12 (9) 3 (9) 0 (2) 3 (3) Total +3.4% +1.1% -0.4% -0.7% -1.5% -0.4% -1.5% +Cube +3.4% +1.3% -0.4% -0.7% -1.7% -0.4% -1.5%
Table 3: Implications of Constraint RS
Circuit Rem 0% <20% <40% <60% <80% <100% 100% s344 8 324 (324) 5 (6) 10 (10) 2 (1) 19 (19) 0 (0) 1 (1) s386 58 151 (150) 8 (9) 2 (2) 4 (6) 1 (2) 1 (0) 7 (5) s420.1 88 524 (524) 10 (11) 1 (2) 2 (1) 0 (0) 0 (0) 16 (15) s1488 123 574 (574) 8 (14) 14 (10) 14 (7) 3 (8) 0 (0) 2 (2) s1196 1395 47 (41) 4 (18) 10 (16) 8 (12) 12 (11) 6 (0) 12 (1) s1423 898 10495 1357 3 (3) 3 (1) 0 (1) 0 (0) 0 (0)
(10482) (1371)
s9234.1 1177 5995 2273 1 (1) 0 (0) 0 (0) 0 (0) 0 (0) (5970) (2298)
s13207.1 1563 4850 875 11 (13) 6 (6) 2 (2) 2 (2) 1 (1) (4684) (1039)
s15850.1 16550 10062 3192 23 (29) 41 2 (3) 0 (0) 1 (0) (10021) (3207) (61)
s35932 538 1178 82 (97) 51 (42) 118 10 (14) 0 (0) 39 (39)
(1178) (108)
Total +0,96 -1,02 +0,01 +0,02 -0,03 +0,02 +0,06 + Cube +0,96 -0,78 -0,08 +0,07 -0,22 -0,01 +0,06 + RS +2,56 +0,27 -0,50 -0,23 -1,45 -0,06 -0,59
Table 4: Implications of Constraint SI
20%” etc. The final columns show FUJISAN’s run time in seconds and peak memory consumption in MB.
It can be seen that few TP cubes have only functional in- stances (6.6% on average), even with respect to Constraint FT, which is the weakest criterion. Hence, running test com- pression on the test data as generated by TIP would result in a large number of non-functional transitions applied to the cir- cuit and thus overtesting. A significant amount of TP cubes have no functional instances at all (Class 0%). If this is un-
acceptable but no ATPG supporting the required functional constraints is available, the following heuristic could reduce the number of such pairs: re-run the ATPG with different parameters (such as a different decision strategy) targeting faults which resulted in Class 0% pairs and apply FUJISAN to determine whether these newly generated pairs have any functional instances.
Table 2 reports the implications of Constraint Cube. Note that it quotes absolute numbers of pairs and not percentages. The change due to the constraint is the difference between a table entry and the number in parentheses (which is the num- ber of pairs in a class if constraint Cube is not considered). The final row contains the sum of changes over all consid- ered circuits. Since not all circuits are shown in the table due to space limitations, the sum of changes over the circuits in the table is not equal to the number in the last row.
Constraint Cube has no influence on Classes 0% and 100%. If a TP cube has a non-empty subset of functional instances, then there must also be a non-empty subset of that subset which is a cube, so no pair can move to Class 0% from a different class due to Constraint Cube. If all of the in- stances of a cube are functional, then the cube determined by FUJISAN is just the original cube itself and it still belongs to Class 100%. For other classes, a shift from high-probability to low-probability classes can be observed. Hence, the need to represent data in a format which encoding algorithms can read makes the overtesting problem more severe, although the extent is limited.
Table 3 illustrates the consequences of enforcing Con- straint RS (reachable state) assuming the all-0 state as the initial state. Column 2 (|RS|) shows the percental fraction of reachable states compared to all states. The implications are significant if that fraction is low. The second-last row shows the changes aggregated over all circuits for which reachable states could be calculated. The last row shows aggregated data if Constraints RS and Cube are considered simultane- ously. The additional influence of Constraint Cube appears to be limited.
The implications of Constraint SI (steady input) are given in Table 4. The pairs which violated the constraints by hav- ing opposite values on matching PIs of the first and second vector have been removed beforehand, and their number is reported in Column Rem. Their fraction varies from insignif- icant (s344) to over 50% for s15850.1. It is interesting that the number of pairs in Class 100% increases. This is be- cause some non-functional instances are removed by speci- fying additional PI values. Apart from that, the changes are not very significant. In particular, not too many pairs lose all of their functional instances due to Constraint SI. The final rows show the aggregated numbers for Constraint SI only; in combination with Cube; and in combination with Cube and RS.
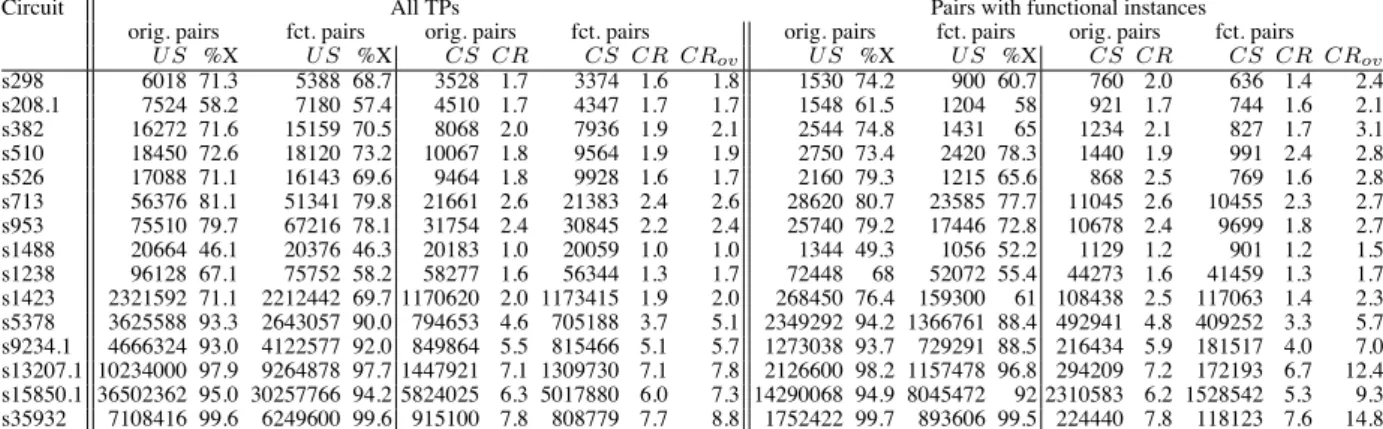
Table 5 gives results on test compression. Columns 2 through 10 report results for all of the TPs generated by TIP. Columns 2 and 4 contains the number of bits before and af- ter FUJISAN was run (U S stands for “uncompressed size”), and columns 3 and 5 give the percentage of Xes in the re-
Circuit All TPs Pairs with functional instances orig. pairs fct. pairs orig. pairs fct. pairs orig. pairs fct. pairs orig. pairs fct. pairs
U S %X U S %X CS CR CS CR CRov U S %X U S %X CS CR CS CR CRov
s298 6018 71.3 5388 68.7 3528 1.7 3374 1.6 1.8 1530 74.2 900 60.7 760 2.0 636 1.4 2.4
s208.1 7524 58.2 7180 57.4 4510 1.7 4347 1.7 1.7 1548 61.5 1204 58 921 1.7 744 1.6 2.1
s382 16272 71.6 15159 70.5 8068 2.0 7936 1.9 2.1 2544 74.8 1431 65 1234 2.1 827 1.7 3.1
s510 18450 72.6 18120 73.2 10067 1.8 9564 1.9 1.9 2750 73.4 2420 78.3 1440 1.9 991 2.4 2.8
s526 17088 71.1 16143 69.6 9464 1.8 9928 1.6 1.7 2160 79.3 1215 65.6 868 2.5 769 1.6 2.8
s713 56376 81.1 51341 79.8 21661 2.6 21383 2.4 2.6 28620 80.7 23585 77.7 11045 2.6 10455 2.3 2.7 s953 75510 79.7 67216 78.1 31754 2.4 30845 2.2 2.4 25740 79.2 17446 72.8 10678 2.4 9699 1.8 2.7 s1488 20664 46.1 20376 46.3 20183 1.0 20059 1.0 1.0 1344 49.3 1056 52.2 1129 1.2 901 1.2 1.5 s1238 96128 67.1 75752 58.2 58277 1.6 56344 1.3 1.7 72448 68 52072 55.4 44273 1.6 41459 1.3 1.7 s1423 2321592 71.1 2212442 69.7 1170620 2.0 1173415 1.9 2.0 268450 76.4 159300 61 108438 2.5 117063 1.4 2.3 s5378 3625588 93.3 2643057 90.0 794653 4.6 705188 3.7 5.1 2349292 94.2 1366761 88.4 492941 4.8 409252 3.3 5.7 s9234.1 4666324 93.0 4122577 92.0 849864 5.5 815466 5.1 5.7 1273038 93.7 729291 88.5 216434 5.9 181517 4.0 7.0 s13207.1 10234000 97.9 9264878 97.7 1447921 7.1 1309730 7.1 7.8 2126600 98.2 1157478 96.8 294209 7.2 172193 6.7 12.4 s15850.1 36502362 95.0 30257766 94.2 5824025 6.3 5017880 6.0 7.3 14290068 94.9 8045472 92 2310583 6.2 1528542 5.3 9.3 s35932 7108416 99.6 6249600 99.6 915100 7.8 808779 7.7 8.8 1752422 99.7 893606 99.5 224440 7.8 118123 7.6 14.8
Table 5: Test compression results considering Constraint FT
Circuit orig. pairs fct. pairs orig. pairs fct. pairs
U S %X U S %X CS CR CS CR CRov
s298 986 76.2 580 28.1 (60.7) 443 2.2 685 0.8 1.4 (2.4) s382 2208 75.9 1242 32.1 (65.0) 1038 2.1 1308 0.9 1.7 (3.1) s526 2112 79.5 1188 31.5 (65.6) 855 2.5 1335 0.9 1.6 (2.8) s713 9288 82.8 7654 71.4 (77.7) 3226 2.9 3960 1.9 2.3 (2.7) s953 25290 79.1 17141 41.3 (72.8) 10590 2.4 14708 1.2 1.7 (2.7) s1488 1344 49.3 1056 51.4 (52.2) 1129 1.2 905 1.2 1.5 (1.5)
Table 6: Test compression and Constraint RS spective test sets. As discussed above, the amount of test data is reduced from2N + 2F to 2N + F if a TP has at least one functional instance. Otherwise, FUJISAN does not modify it (based on the philosophy that it is better to detect a fault with a non-functional test than not to detect it at all) and 2N + 2F bits are stored. We applied the 9C compression al- gorithm [19], which is a simple yet representative technique, to both of the test sets. We used the codewords and the pa- rameter K = 8 given in [19]. The number of bits in the compressed data is denoted as CS (”compressed size”) and the compression ratio is denoted as CR. The overall com- pression ratio CRov is defined as U S of a test set before running FUJISAN divided by CS of the functional test set obtained by FUJISAN. Columns 11 through 19 contain the same information for the subset of the test set consisting of TPs with at least one functional instance.
The percentage of Xes goes down in most (but not all) cases after application of FUJISAN. The compression ratio also goes down, and the extent of the decrease is well corre- lated with the extent of the decrease of the percentage of Xes. However, the size of the compressed functional test is always below the size of the compressed original test, with one no- table exception of s1423. For this circuit, the compression ratio reduction is so heavy that it outweighs the decrease in bits to be saved from2N + 2F to 2N + F per pair. Fi- nally, the results for the complete data (Columns 2–10) and the subset with functional instances (Columns 11–19) show the same trend but the magnitude of changes is larger for the subset. This is because the complete data is amortized by the non-functional test pair cubes not modified by FU- JISAN. Consequently, from this point we present only the data for the subset.
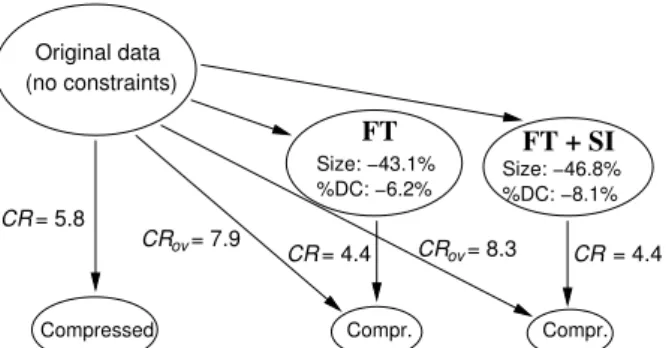
CRov= 1.9 CRov= 2.5
Original data (no constraints)
FT FT + RS
= 2.2
Compressed Compr.
CR
= 1.9 CR
%DC: −3.6%
Size: −23.9% Size: −25.4%
%DC: −20.8%
= 1.4 CR
Compressed
Figure 1: Aggregated results for Constraints FT and RS (only circuits for which reachable states have been calcu- lated)
Table 6 shows the impact of adding Constraint RS for cir- cuits with a small fraction of reachable states. Numbers in parentheses are taken from Table 5 for comparison. The re- ductions in both the don’t care (X) fraction and the compres- sion ratio are severe. Sometimes the compression ratio falls below 1, i.e., the “compressed” data is larger than the orig- inal data. The compressed functional set is larger than the compressed original test set for several circuits.
Figure 1 shows the aggregated results for Constraints FT and RS in diagram form. Imposing Constraint FT allows to reduce the amount of applied data (“Size”) because2N + F instead of2N + 2F bits are now required, but the percent- age of Xes (“%X”) also decreases. As a consequence, the compression ratio declines, but the overall compression ratio CRov is still higher than CR of original data. However, if Constraint RS is considered, the percentage of Xes drops so much that CRov falls below CR of the original data (note that the slight difference in average size reduction is due to exclusion of a different number of non-functional pairs). This means that, although less data is to be compressed, the size of the compressed data is larger for functional testing.
Figure 2 presents the aggregated results for Constraints FTand SI (only pairs without conflicting PI assignments in the original test data have been considered). The decrease in X percentage is much less than for Constraint RS, and
Original data (no constraints)
FT
Compressed Compr.
CR
CR CR
Size: −43.1%
%DC: −6.2% Size: −46.8%
%DC: −8.1%
= 5.8
= 4.4 = 4.4
CRov
CRov
= 7.9 = 8.3
Compr.
FT + SI
Figure 2: Aggregated results for Constraints FT and SI (all circuits)
additional N bits per TP can be saved as described above. As a consequence, considering both constraints results in the most compact compressed data. Note that the reduction in size and the compression ratios are higher than in Figure 1, because larger circuits with many more FFs than PIs and a higher fraction of Xes are considered.
5 Conclusions and Future Work
We proposed a methodology to prevent overtesting due to scan-based delay test in a test compression flow. We in- troduced a tool, called FUJISAN, which restricts TP cubes generated by an ATPG with respect to a given set of func- tional constraints and hands them to the encoding routine. In contrast to existing approaches, the resulting TPs have a significant number of don’t cares (Xes) and thus can be compressed. FUJISAN works with any ATPG which is suit- able for a test compression flow, i.e., can generate tests with Xes, and any encoding procedure. The ATPG does not have to support any functional constraints, although such support will help yield better results. There is no requirement on the targeted delay fault model. FUJISAN is minimally intrusive for the existing flow as no modification of ATPG or the en- coding procedure is needed.
We used FUJISAN to study the extent of overtesting for an off-the-shelf path delay fault ATPG with respect to vari- ous constraints and found it to be severe. In particular, the state reachability constraint lead to a significant decrease of functional instances. We also evaluated the effect of impos- ing functional constraints on test compression. We explored the tradeoff between the reduction in the size of the data to be compressed because of implicit relationships induced by the functional constraints on one hand and the decline of the compression ratio due to increased specification on the other hand. We found that most functional constraints result in de- crease of the overall test data. One exception was again the state reachability constraint for which a drop in compression ratio was observed.
FUJISAN currently supports only exact methods. We plan incorporation of approximate techniques and hierarchi- cal techniques such as [20] to make it scale for industrial-size circuits as future work. A further needed feature is the au- tomatic import of functional constraints from assertions in high-level HDL code.
Acknowledgments
This work was supported in part by 21st Century COE (Cen- ter of Excellence) Program “Ubiquitous Networked Media Computing” and in part by JSPS (Japan Society for the Pro- motion of Science) under Grants-in-Aid for Scientific Re- search B(2)(No. 15300018).
6 References
[1] H. Hao and E.J. McCluskey. Resistive shorts within CMOS gates. In Int’l Test Conf., pages 292–301, 1991.
[2] A. Fudoli, A. Ascagni, D. Appello, and H. Manhaeve. A practical evaluation of IDDQ test strategies for deep submicron production test application. experiences and targets from the field. In European Test Workshop, pages 65–70, 2003.
[3] J. Saxena, K.M. Butler, V.B. Jayaram, S. Kundu, N.V. Arvind, P. Sreeprakash, and M. Hachinger. A case study of IR-drop in struc- tured at-speed testing. In Int’l Test Conf., pages 1098–1104, 2003. [4] M.G. Pecht, R. Radojic, and G. Rao. Managing Silicon Chip Reliabil-
ity. CRC Press, 1998.
[5] P. Engelke, I. Polian, M. Renovell, B. Seshadri, and B. Becker. The pros and cons of very-low-voltage testing: An analysis based on resis- tive short defects. In VLSI Test Symp., pages 171–178, 2004. [6] I. Pomeranz. On the generation of scan-based test sets with reachable
states for testing under functional operation conditions. In Design Autom. Conf., pages 928–933, 2004.
[7] J. Rearick. Too much delay fault coverage is a bad thing. In Int’l Test Conf., pages 624–633, 2001.
[8] X. Liu and M. Hsiao. Constrained ATPG for broadside transition test- ing. In Int’l Symp. on Defect and Fault Tolerance in VLSI Systems, pages 175–184, 2003.
[9] Y.-C. Lin, F. Lu, K. Yang, and K.-T. Cheng. Constraint extraction for pseudo-functional scan-based delay testing. In Asia and South Pacific Design Autom. Conf., pages 166–171, 2005.
[10] Y.-C. Lin, F. Lu, and K.-T. Cheng. Pseudo-functional scan-based bist for delay fault. In VLSI Test Symp., pages 229–234, 2005.
[11] A. Krsti´c, J.-J. Liou, K.-T. Cheng, and L.-C. Wang. On structural vs. functional testing for delay faults. In Int’l Symp. on Quality Electronic Design, pages 438–441, 2003.
[12] J. Rajski, J. Tyszer, M. Kassab, and N. Mukherjee. Embedded deter- ministic test. IEEE Trans. on CAD, 23(5):776–792, 5 2004. [13] R. Madge, B.R. Benware, and W.R. Daasch. Obtaining high defect
coverage for frequency-dependent defects in complex ASICs. IEEE Design$&$ Test of Comp., 20(5):46–53, 10 2003.
[14] R.E. Bryant. Graph - based algorithms for Boolean function manipu- lation. IEEE Trans. on Comp., 35(8):677–691, 1986.
[15] B.I. Dervisoglu and G.E. Stong. Design for testability: Using scanpath techniques for path-delay test and measurement. In Int’l Test Conf., pages 365–374, 1991.
[16] J. Savir. Broad-side delay test. IEEE Trans. on CAD, 13(8):1057– 1064, 1994.
[17] M. Henftling and H. Wittmann. Bit Parallel Test Pattern Generation for Path Delay Faults. In European Design andTest Conf., pages 521– 525, Mar. 1995.
[18] P. Tafertshofer, A. Ganz, and M. Henftling. A SAT-based implication engine for efficient ATPG, equivalence checking, and optimization of netlists. In Int’l Conf. on CAD, pages 648 – 655, 1997.
[19] M. Tehranipour, M. Nourani, and K. Chakrabarty. Nine-coded com- pression technique with application to reduced pin-count testing and flexible on-chip decompression. In Design, Automation and Test in Europe, pages 173–178, 2004.
[20] V.M. Vedula and J.A. Abraham. A novel methodology for hierarchical test generation using functional constraint composition. In Int’l High- Level Validation and Test Workshop, pages 9–14, 2000.