Cr os s - c ul t ur al adapt at i on, r el i abi l i t y, and
val i di t y of t he J apanes e ver s i on of t he
Cum
ber l and ankl e i ns t abi l i t y t ool
著者
Kunugi Shun, M
as unar i Aki hi ko, N
oh Byungj oo,
M
or i Tos hi o, Yos hi da N
ar ut o, M
i yakaw
a Shum
pei
j our nal or
publ i c at i on t i t l e
D
i s abi l i t y and r ehabi l i t at i on
vol um
e
39
num
ber
1
page r ange
50- 58
year
2017
権利
Thi s i s an Ac c ept ed M
anus c r i pt of an ar t i c l e
publ i s hed by Tayl or &
Fr anc i s i n D
i s abi l i t y
and Rehabi l i t at i on on 2017 , avai l abl e onl i ne:
ht t p: / / w
w
w
. t andf onl i ne. c om
/
10. 3109/ 09638288. 2016. 1138555.
U
RL
ht t p: / / hdl . handl e. net / 2241/ 00144963
RESEARCH PAPER
Cross-cultural adaptation, reliability, and validity of the Japanese
version of the Cumberland ankle instability tool
SHUN KUNUGI
a, AKIHIKO MASUNARI
a, b, BYUNGJOO NOH
c, TOSHIO MORI
a,
NARUTO YOSHIDA
d, & SHUMPEI MIYAKAWA
a*a
Department of Sports Medicine, Graduate School of Comprehensive Human Sciences,
University of Tsukuba, Ibaraki, Japan
;
bCenter for Medical Sciences, Ibaraki Prefectural
University of Health Sciences, Ibaraki, Japan;
cDepartment of Kinesiology and Integrative
Physiology, Michiga Technology University, Michigan, USA;
dFaculty of Health Care,
Teikyo Heisei University, Tokyo, Japan
* Corresponding author:
Shumpei Miyakawa MD, PhD
Laboratory of Sports Medicine
Department of Sports Medicine, Graduate School of Comprehensive Human Sciences
University of Tsukuba
1-1-1 Tennodai, Tsukuba 305-8574, Japan
E-mail: [email protected]
Fax: +81-29-853-2575
Phone: +81 29-853-2575
ABSTRACT
Purpose To study validity and reliability of a Japanese version of the Cumberland Ankle Instability Tool
and to determine the optimal cut-off score.
Methods In this study, the questionnaire was cross-culturally adapted into Japanese. The psychometric
properties tested in the Japanese version of the CAIT were measured for criteria validity, internal
consistency and test–retest reliability in 111 collegiate soccer athletes. We also established the
questionnaire cut-off score for discriminating between individuals with and without CAI.
Results There was a significant correlation between the Japanese version of the CAIT and the Karlsson
score (r = 0.604, p < 0.001). The questionnaire had a high internal consistency (Cronbach’s α = 0.833) and
reliability [intraclass correlation coefficient (ICC) = 0.826, 95% confidence interval (CI): 0.732–0.888].
The optimal cut-off score was ≤ 25, which was consistent with previous reports.
Conclusions The Japanese version of the CAIT has been shown to be a valid and reliable questionnaire for
determining the presence of CAI. We expect that researchers and clinicians will use the Japanese version of
the CAIT in Japan.
Implications for Rehabilitation
•
Chronic Ankle Instability (CAI), which not only increases recurrence rate of ankle sprain
but also decreases athletic performance, is a residual symptom after ankle sprain.
will be critically useful in assessment procedure for CAI.
•
It is preferable for clinicians and researchers to use the native language version of the
Introduction
Ankle sprain is one of the most common injures in sports activities. The incidence and recurrence rate of
ankle sprain is high in team sports such as soccer. [1,2] As many as 73% of all athletes have recurrent ankle
sprain and 59% of these athletes have significant disability and residual symptoms impairing their athletic
performance. [3] Approximately 20–30% of athletes with acute ankle sprains develop mechanical ankle
instability (MAI) and/or functional ankle instability (FAI), resulting in residual symptoms called chronic
ankle instability (CAI). [4,5] Athletes with FAI show impairment on jump performance that demands a
change of direction, such as a side hop and figure-8 hop. [6] The impairment in this athletic performance
result from eversion muscle weakness, diminished proprioception [7] and impaired postural control. [8]
These impairments are associated with a significantly increased risk of ankle sprain. [9] On the other hand,
athletes with MAI have mechanical insufficiencies, including pathological laxity, and impaired
arthrokinematics.They have the potential of synovial and degenerative changes. [10] However, FAI and
MAI are present in CAI, and both are not completely independent and should be assessed together. [11]
Pathologic laxity is assessed clinically by physical examination such as a manual test and stress
radiography. [12] Examination of stress using MRI also has advantages in the assessment of mechanical
instability. [13] Quantitative and visible evaluation with diagnostic imaging permits measurement of the
severity of MAI. However, functional instability has been difficult to quantitatively measure. In Japan, the
Karlsson score [14] and the Japanese Society for Surgery of the Foot standard rating system [15,16] have
in many studies, [17] these questionnaires have not been translated into Japanese. The inconsistency in
participant selection criteria across studies presents a potential obstacle to collectively assess CAI. Thus,
standards for participant selection criteria are required.
Hiller et al. [18] developed the Cumberland Ankle Instability Tool (CAIT; Appendix 1), which is a
reliable and valid questionnaire for identifying patients with FAI. The CAIT is a 9-item questionnaire that
is designed to evaluate several aspects of FAI. The total score of the 9 items ranges from 0 (severe
instability) to 30 (normal stability). The International Ankle Consortium recommends that self-reported
ankle instability should be confirmed using valid and reliable questionnaires such as the CAIT. [19] Hence
the CAIT will be used in various countries because it has already been translated into Portuguese [20] and
Spanish. [21] However, the CAIT has some problems that include the use of various independently selected
cutoff scores (i.e. ≤23, ≤24, ≤25 and ≤27) [18, 22–24] to determine CAI. In addition, the questionnaire was
developed in English, thereby limiting its applicability to English speakers. There are several populations
that do not speak English and are consequently unable to use the English CAIT. In the case of that
clinicians and researchers assess a patient for CAI in this fields, it is reliable and valid that they use a native
language questionnaire and standard criteria for CAIT cutoff score. In Japan, some researchers [25,26] have
used a questionnaire that was written in English to identify participants with CAI. However, the
questionnaire has not been shown to be valid and reliable. Therefore, the purpose of this study was to
Materials and methods
Adaptation procedures
Translation of the English CAIT into Japanese was performed using the guidelines for the process of
cross-cultural adaptation of self-reports measures [27] as a reference. Two bilingual experts were Japanese,
one who was a medical doctor and the other who was a NATA-certified athletic trainer, each translated the
English CAIT into Japanese. Differences in the translation were discussed and a consensus was reached.
Back-translation was conducted by another bilingual translator who was blinded to the original English
CAIT. Differences in the two versions were discussed and a consensus was reached. Finally, some
modifications were made to correct cultural differences and to preserve equivalence with the English
version of the CAIT. For example, the term “on the ball of my foot” was translated as “on the tip of their
toes”, which means generally “on the fore fleshy part of my foot” in Japanese. In addition, the term
“hopping” was translated into Japanese as “jumping on one leg”. The Japanese version of the CAIT is
presented in Appendix 2.
Participants
A total of 111 native Japanese speakers were recruited from a universitymen’s soccer club and the
following those malesoccer players were included in this study: CAI group (61 participants with CAI) and
Control group (50 control participants). The inclusion criteria for the CAI group included a history of at
and/or chronic pain in the ankle during daily life or sports activity. These inclusion criteria were determined
on the basis of previous studies. [28,29] The Control group had none of the above ankle issues. The
exclusion criteria were based on previous studies [19,30] and included the following: (a) a history of
previous surgery of musculoskeletal structures and fracture requiring realignment of either limb of the
lower extremity, (b) acute injury to the musculoskeletal structures of the other lower extremity joints in the
previous 3 months, which impacted joint integrity and function, resulting in at least one day of interrupted
desired physical activity, and (c) performing balance training on a routine basis. In case of the participants
had bilateral CAI, the self-reported more unstable ankle were included in the CAI group. The Japanese
version of the CAIT and the Karlsson score were not used as inclusion criteria for any group. Participant
demographics are described in Table 1. To assess reliability, 41 of the 111 participants included in the
retest group (Table 2), which corresponded to 82 feet (Table 2), answered about both legs and completed a
retest of the Japanese version of the CAIT 3 weeks after the initial test. The individuals in the retest group
had not injured themselves in the previous 3 weeks.
This study was approved by the University of Tsukuba’s Comprehensive Human Sciences Ethical
Committee. All subjects provided written or oral consent to participate in the study after being provided
with an explanation of the study’s intent and methods (No.26-75).
Psychometric properties and discriminative ability
were analysed: criterion-related validity, internal consistency, and test–retest reliability. Validity was
assessed by criterion-related validity whether the Japanese version of the CAIT correlated with a related
questionnaire for CAI. Reliability divided into consistency and repeatability was assessed by internal
consistency and test-retest reliability, respectively. Discriminative ability was assessed to determine
whether the Japanese version of the CAIT could distinguish between subjects with and without CAI.
Criterion-related validity. The criterion-related validity of the Japanese version of the CAIT was
assessed using the Karlsson score. Both questionnaires were administered to both groups. The Karlsson
score as an external criterion was written in comparatively simple English and designed to evaluate the
ankle joint stability and function. The Karlsson score is an 8-item questionnaire and the total score of the 8
items ranges from 0 to 100. A score of ≥80 points is classified as an acceptable (excellent or good) result,
whereas a score of <79 points is classified as an unacceptable (fair or poor) result. [14] The scoring scale is
a useful aid to assess ankle joint function in a standardized manner. Therefore, the questionnaire has been
used to evaluate FAI in some studies targeted towards Japanese people. [26,31]
Internal consistency. The Internal consistency of the Japanese version of the CAIT was assessed using
Cronbach’s α coefficient. [32] A questionnaire is considered internally consistent if the item are at least
moderately correlated with each other and each item is correlated with the total score (α = 0.75–0.95). [32]
Test–retest reliability. To determine test–retest reliability, the Japanese version of the CAIT was
administered to a retest group of 41 participants, which corresponded to 82 feet, 3 weeks after the initial
test. Test–retest reliability was assessed using the intraclass correlation coefficient (ICC2.1). For this
analysis, we used scores obtained in the first and second tests for patients in the retest group who completed
the Japanese version of the CAIT.
Discriminative ability. Discriminative ability was tested to determine whether the Japanese version of
the CAIT could distinguish between subjects with and without CAI. A receiver operating characteristic
(ROC) curve [33] was constructed to confirm the cutoff point of the Japanese version of the CAIT. The
cutoff point was determined using the Youden index. [34] For this analysis, we used scores obtained in the
first test for all participants who completed the Japanese version of the CAIT and data with or without CAI
defined in this study.
Statistics
All analyses were conducted using SPSS version 21 (Chicago, IL). Paired t-tests were used to compare
participants’ demographics between groups.
Criterion-related validity. Criterion-related validity was assessed using Spearman’s correlation
coefficient between the Karlsson score and the Japanese version of the CAIT. The Spearman’s correlation
coefficient were as follows: poor, <0; slight, 0.00–0.20; fair, 0.21–0.40; moderate, 0.41–0.60; substantial,
Internal consistency. Internal consistency was assessed using Cronbach’s α coefficient. A positive
rating for internal consistency was considered when factor analysis was applied and Cronbach’s α
coefficient was between 0.70 and 0.95. [32]
Test–retest reliability. Test–retest reliability was assessed using the intraclass correlation coefficient
(ICC2.1) as reference previous study. [20] The ICC2.1 scores were as follows: poor, <0; slight, 0.00–0.20;
fair, 0.21–0.40; moderate, 0.41–0.60; substantial, 0.61–0.80 and almost perfect, >0.81. [35]
Discriminative ability. An ROC curve was constructed with the “Japanese version of the CAIT” as a
dependent variable and “group member” (CAI group or Control group) as the independent variable. To
identify a significant ROC curve, the area under the curve (AUC) was calculated using a one-tailed test.
After calculating the diagnostic sensitivity and specificity for each potential cutoff score, the ideal cutoff
point was determined using the maximum Youden index, which was calculated as follows: sensitivity +
specificity − 1.
Each cutoff score was evaluated using the positive likelihood (LR+) [sensitivity/(1 − specificity)] and
the negative likelihood (LR−) [(1 − sensitivity)/specificity].
Statistical significance was set at <5%.
Results
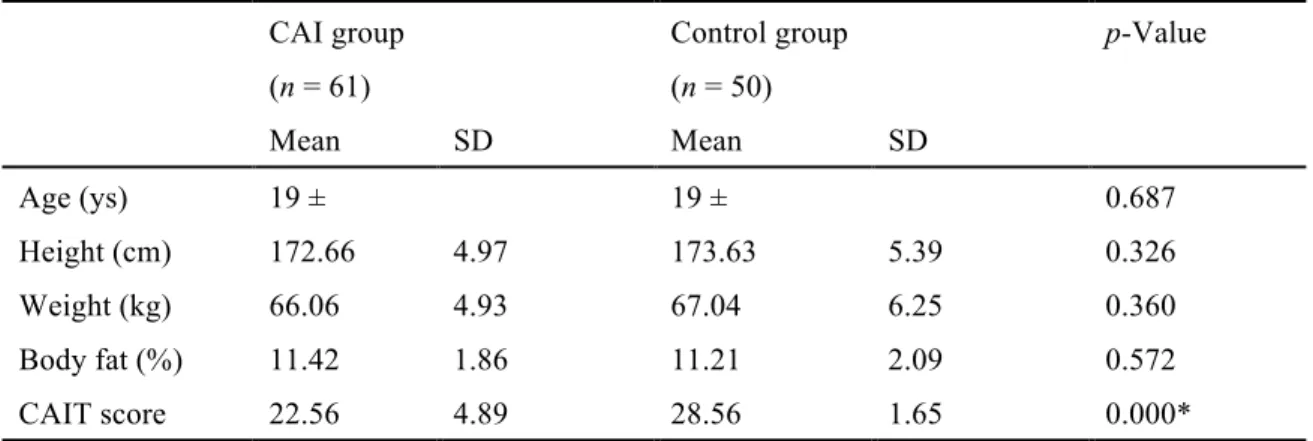
There were no significant differences in demographic characteristics between the CAI and Control groups.
Criterion-related validity
Criterion-related validity was assessed using Spearman’s correlation coefficient. There was a moderate
correlation between the Japanese version of the CAIT and the Karlsson score (r = 0.604, p < 0.001; Figure
1).
Internal consistency
Cronbach’s α coefficient for the Japanese version of the CAIT score showed a high internal consistency
(0.833). Cronbach’s α coefficient if each item was deleted and each correlation coefficient between the
score of each item and total scores except the each item were shown in Table 3. In the item analysis, no
improvement was observed each time a particular item was deleted from the scale, except for item 9, which
showed a slight increase when it was omitted (Table 3).
Test–retest reliability
In the retest group, the mean first and second test scores of the Japanese version of the CAIT were 27.38
SD 3.10 and 27.93 SD 3.29, respectively. The Japanese version of the CAIT had almost perfect reliability
[ICC2.1 = 0.826; 95% confidence interval (CI): 0.732–0.888, p < 0.001].
Discriminative ability
The mean scores of the Japanese version of the CAIT for the CAI group (n = 61) and Control group (n =
51) were 22.56 SD 4.89 and 28.42 SD 1.65, respectively (Table 1). The ROC curve showed that the
Japanese version of the CAIT score significantly discriminated between the groups (AUC = 0.932, p <
Japanese version of the CAIT score of 25 was the cutoff point to distinguish between the groups. High
sensitivity (0.705) and specificity (0.980) were calculated at the cutoff point. The LR+ and LR− values
were 35.35 and 0.30, respectively (Table 4).
Discussion
The CAIT was developed in English, thereby limiting its applicability to English speaking populations;
non-English speakers are unable to use the English CAIT. Previous research in Japan has shown that some
questionnaires written in English were used to assess CAI. However, the participants were Japanese
speakers rather than English speakers. Few tools are available to assess CAI in Japanese speakers.
Therefore, our goal was to translate the CAIT into Japanese and to assess the questionnaire’s validity,
reliability and discriminative ability. Translation was performed using a guideline, and some changes were
made and some terms were added. Compared with the English CAIT, no significant differences were
observed in the psychometric property of the translated CAIT. Therefore, it was shown that the Japanese
version of the CAIT was a reliable and valid questionnaire.
Criterion-related validity was assessed between the Karlsson score and the Japanese version of the
CAIT using Spearman’s correlation coefficient. The questionnaire had a moderate correlation with the
Karlsson score. A previous study has shown that there is a high correlation between the CAIT and subject’s
overall perception of ankle instability. [18] The Karlsson score is also an assessment tool for ankle joint
Cronbach’s α coefficient of the Japanese version of the CAIT was 0.833. A coefficient value from
0.70 to 0.95 represents very good internal consistency. [32] The coefficient of the English CAIT is 0.83
[18] and that of the Brazilian Portuguese version is 0.86–0.88, [20] which is approximately equal to that
obtained in this study. To determine the influence of each item on Cronbach’s α coefficient, we
systematically excluded each item from the Japanese version of the CAIT. The coefficient was slightly
increased when item 9 was deleted, but no improvement was observed for the rest of the items. In the
Spanish version of the CAIT, Cronbach’s α coefficient was slightly increased when items 5 and 6 were
deleted, because items 5 and 6 refer to unusual activity such as feeling unstable when standing on one leg
or hopping from side to side. [21] In contrast, no individual items were inserted into the instrument in the
Brazilian Portuguese version of the CAIT. [20] In our study, no improvement was observed when each of
items 5 and 6 were deleted, which may be because all participants were collegiate soccer athletes who
performed these movements, such as standing on one leg and hopping from side to side, on a daily basis.
Moreover, deleting item 9 slightly increased Cronbach’s α coefficient because item 9, which is strongly
influenced by memory, might be weakly relevant in case of present ankle stability.
Test–retest reliability of the Japanese version of the CAIT was assessed using ICC2.1 with the initial
and follow-up score in the retest group. The ICC2.1 value was 0.826 with a 95% CI of 0.732–0.888 (p <
0.001). The value was classified as ‘almost perfect’ according to Landis’s classification, but slightly
inferior to the value of the English version (0.96), [18] Brazilian Portuguese version (0.95) [20] and
contrast, the present study was longer than these intervals. On testing repeatability, the subject’s memory
influences the second test, particularly when the term is short; however, a long term may alter the state of
the subject’s memory. Thus, the reliability of the Japanese version of the CAIT is slightly inferior to that of
the other versions.
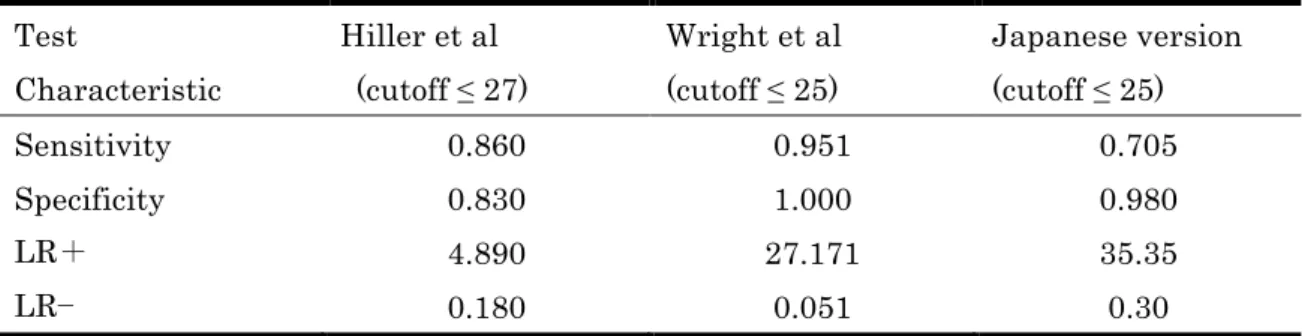
The discriminative ability and cut-off score of the Japanese version of the CAIT was determined by
describing the ROC curve (AUC = 0.932) and calculating the Youden Index (maximum index: 0.685) at a
score of 25.5. The sensitivity (0.705), specificity (0.98), LR+ (35.35) and LR− (0.30) were calculated at
this cut-off score. Hiller et al. (2006) showed that for the English CAIT, a score of ≤27 was the cut-off to
distinguish between participants with and without a history of ankle sprain. However, to distinguish
between CAI and uninjured groups, Wright et al. [24] recalibrated the ideal cut-off score to ≤25, which was
the same as the score of the Japanese version. The high sensitivity (0.951) and specificity (1.000), LR+ (not
applicable) and LR− (0.049) of the English CAIT were calculated at a score of 25.5. LR+ was not
calculated at this score, and the next nearest cut-off value resulted in an LR+ of 27.171. The clinimetric
properties are described in Table 5. LR+ of the Japanese version of the CAIT was slightly higher than that
of the English CAIT. Therefore, the questionnaire may more accurately select patients with CAI. However,
LR− was 0.30, which is an inadequate score to identify patients without CAI. Although the Japanese
version of the CAIT score of ≤25 has some differences from English version, this is the optimal cut-off to
distinguish between patients with and without CAI.
The present study has some limitations. First, MAI of the participants was not assessed using an objective
assessment of structures, such as stress X-ray. MAI influences the unstable feeling with and without FAI,
and thus, the CAIT score may be affected by the presence and absence of MAI. Moreover, copers [36] who
have a history of ankle sprain but no ongoing instability were not classified in this study. Wright et al. [24]
showed that the ideal CAIT cutoff score was slightly lower when copers were divided into those with CAI
and those who were uninjured, compared with when they were not divided. Similarly, the score of the
Japanese version may change when copers are separated from those with other ankle statuses. Although
FAI and MAI were not completely independent, MAI and copers should be separated from CAI in future
research. These approaches may more rigorously identify the severity of ankle instability.
Conclusions
The Japanese version of the CAIT is a valid and reliable questionnaire for assessing CAI. The ideal cutoff
score to assess the presence or absence of CAI is 25. In addition, the questionnaire can be easily applied
and can immediately and correctly provide clinicians and researchers with the patient’s ankle status. In
Japan, it is preferable for clinicians and researchers to use the Japanese version of the CAIT and a cutoff
score of 25 when assessing patients for CAI.
Acknowledgements
and every collegiate soccer athletes who kindly agreed to tale part in this research.
Declaration of Interest
References
[1]Fong D, Hong Y, Chan, LK, et al. A systematic review on ankle injury and ankle sprain in sports. Sports
Med. 2007;37:73–94.
[2]Smith RW, Reischl SF. Treatment of ankle sprains in young athletes. Am J Sports Med.
1986;14:465–471.
[3]Yeung M, Chan K, So C, et al. An epidemiological survey on ankle sprain. Brit J Sports Med.
1994;28:112–116.
[4] Chan KW, Ding BC, Mroczek KJ. Acute and chronic lateral ankle instability in the athlete. Bull NYU
Hosp Joint Dis. 2011;69:17–26.
[5]Rijn RM, van O, van AG, et al. What is the clinical course of acute ankle sprains? A systematic
literature review. Am J Med. 2008;121:324–331.
[6]Docherty CL, Arnold BL, Gansneder BM, et al. Functional-performance deficits in volunteers with
functional ankle instability. J Athletic Train. 2005;40:30–34.
[7]Willems T, Witvrouw E, Verstuyft J, et al. Proprioception and muscle strength in subjects with a history
of ankle sprains and chronic instability. J Athletic Train. 2002;37:487–493.
[8]Arnold B, Motte S, Linens S, et al. Ankle instability is associated with balance impairments: a
meta-analysis. Med Sci Sports Exercise. 2009;41:1048–1062.
[9]Witchalls J, Blanch P, Waddington G, et al. Intrinsic functional deficits associated with increased risk of
ankle injuries: a systematic review with meta-analysis. Brit J Sports Med. 2012;46:515–523.
[10]Hertel J. Functional anatomy, pathomechanics, and pathophysiology of lateral ankle instability. J
Athletic Train. 2002;37:364–375.
[11]Hubbard TJ, Kramer LC, Denegar CR, et al. Correlations among multiple measures of functional and
mechanical instability in subjects with chronic ankle instability. J Athletic Train. 2007;42:361–366.
[12]Beynnon BD, Webb G, Huber BM, et al. Radiographic measurement of anterior talar translation in the
ankle: determination of the most reliable method. Clin Biomech. 2005;20:301–306.
[13]Seebauer CJ, Bail HJ, Rump JC, et al. Ankle laxity: stress investigation under MRI control. Am J
Roentgenol. 2013;201:496–504.
[14]Karlsson J, Peterson L. Evaluation of ankle joint function: the use of a scoring scale. Foot.
1991;1:15–19.
[15]Niki H, Aoki H, Inokuchi S, Ozeki, S, et al. Development and reliability of a standard rating system for
outcome measurement of foot and ankle disorders I: development of standard rating system. J
Orthopaedic Sci.2005;10:457–465.
[16]Niki H, Tatsunami S, Haraguchi N, et al. Development of the patient-based outcome instrument for the
foot and ankle. Part 1: project description and evaluation of the outcome instrument version 1. J
Orthopaedic Sci. 2011;16:536–555.
[17]Eechaute C, Vaes P, Aerschot L, et al. The clinimetric qualities of patient-assessed instruments for
measuring chronic ankle instability: a systematic review. BMC Musculoskeletal Disord. 2007;8:6.
and reliability testing. Arc Physical Med Rehabil. 2006;87:1235–1241.
[19]Gribble PA, Delahunt E, Bleakley CM, et al. Selection criteria for patients with chronic ankle
instability in controlled research: a position statement of the International Ankle Consortium. J Athletic
Train. 2014;49:121–127.
[20]Noronha MD, Refshauge KM, Kilbreath SL, et al. Cross-cultural adaptation of the
Brazilian-Portuguese version of the Cumberland Ankle Instability Tool (CAIT).Disabil
Rehabil. 2008;30:1959–1965.
[21]Cruz-Díaz D, Hita-Contreras F, Lomas-Vega R, et al. Cross-cultural adaptation and validation of the
Spanish version of the Cumberland Ankle Instability Tool (CAIT): an instrument to assess unilateral
chronic ankle instability. Clin Rheumatol. 2013;32:91–98.
[22]Noronha M, Refshauge KM, Kilbreath SL, et al. Loss of proprioception or motor control is not related
to functional ankle instability: an observational study. Aust J Physiother. 2007;53:193–198.
[23]Sawkins K, Refshauge KM, Kilbreath SL, et al. The placebo effect of ankle taping on ankle instability.
Med Sci Sports Exercise. 2007;39:781–787.
[24]Wright C, Arnold B, Ross S, et al. Recalibration and validation of the Cumberland Ankle Instability
Tool cutoff score for individuals with chronic ankle instability. Arch Physical Med Rehabil.
2014;95:1853–1859.
[25]Koshino Y, Yamanaka M, Ezawa Y, et al. Lower limb joint motion during a cross cutting movement
differs in individuals with and without chronic ankle instability. Physical Therapy Sport.
2014;15:242–248.
[26]Yoshida N, Kobayashi N, Masunari A, et al. Changes in the muscle reaction time of ankle periarticular
muscles by balance training. J Physical Fitness Sports Med. 2013;2:493–500.
[27]Beaton D, Bombardier C, Guillemin F, et al. Guidelines for the Process of Cross-Cultural Adaptation
of Self-Report Measures. Spine. 2000;25:3186–3191.
[28]Delahunt E, Coughlan GF, Caulfield B, et al. Inclusion criteria when investigating insufficiencies in
chronic ankle instability. Med Sci Sports Exercise. 2010;42:2106–2121.
[29]Monaghan K, Delahunt E, Caulfield B. Ankle function during gait in patients with chronic ankle
instability compared to controls. Clin Biomech (Bristol, Avon). 2006;21:168–174.
[30]Delahunt E, Monaghan K, Caulfield B. Altered neuromuscular control and ankle joint kinematics
during walking in subjects with functional instability of the ankle joint. Am J Sports Med.
2006;34:1970–1976.
[31]Futatsubashi G, Sasada S, Tazoe T, et al. Gain modulation of the middle latency cutaneous reflex in
patients with chronic joint instability after ankle sprain. Clin Neurophysiol. 2013;124:1406–1413.
[32]Terwee C, Bot S, Boer M, et al. Quality criteria were proposed for measurement properties of health
status questionnaires. J Clin Epidemiol. 2006;60:34–42.
[33]Deyo RA, Centor RM. Assessing the responsiveness of functional scales to clinical change: an analogy
to diagnostic test performance. J Chronic Dis.1986;39:897–906.
[34]Youden W. Index for rating diagnostic tests. Cancer. 1950;3:32–35.
1977;33:159–174.
[36]Hertel J, Kaminski TW. Second international ankle symposium summary statement. J Orhop Sports
Appendix Legends
Appendix 1. The CAIT Questionnaire
Appendix 2. The Japanese version of the CAIT
Table Legends
Table 1. Participant characteristics
Table 2. Retest group characteristics
Table 3. Internal consistency
Table 4. Inspection capability at each potential CAIT cutoff
Table 5. Comparison of CAIT clinimetric properties between studies
Figure Legends
Figure 1. Relationship between the Japanese version of the CAIT score and the Karlsson score (r = 0.604,
*p < 0.001). Each point represents an individual subject (n= 111).
Figure 2. ROC curve for the Japanese version of the CAIT score. The curve represents the ROC curve, and
the diagonal line represents the reference line for the significant ROC curve. *Cutoff value with the highest
Table 1. Participant characteristics
CAI group Control group p-Value
(n = 61) (n = 50)
Mean SD Mean SD
Age (ys) 19 ± 19 ± 0.687
Height (cm) 172.66 4.97 173.63 5.39 0.326
Weight (kg) 66.06 4.93 67.04 6.25 0.360
Body fat (%) 11.42 1.86 11.21 2.09 0.572
CAIT score 22.56 4.89 28.56 1.65 0.000*
There is significant difference between two groups (*p < 0.05)
Table 2. Retest group characteristics
Retest group
(n = 41)
Mean SD
Age (ys) 18 ±
Height (cm) 171.02 4.73
Weight (kg) 64.45 5.81
Body fat (%) 10.39 2.03
Table 3. Internal consistency
Corrected Item: total
correlation
Cronbach’s α if item was
deleted
Item 1 0.629 0.805
Item 2 0.760 0.796
Item 3 0.761 0.797
Item 4 0.605 0.816
Item 5 0.502 0.825
Item 6 0.469 0.825
Item 7 0.715 0.797
Item 8 0.488 0.823
Item 9 0.357 0.859
No improvement was observed every time that one item was deleted from the scale, except for item
Table 4. Inspection capability at each potential CAIT cut-off
CAIT Sn 1 – Sp Sp Youden
Index
LR+ LR−
6.0 0.000 0.000 1.000 0.000 NA 1.000
7.5 0.016 0.000 1.000 0.016 NA 0.984
9.0 0.033 0.000 1.000 0.033 NA 0.967
11.5 0.049 0.000 1.000 0.049 NA 0.951
13.5 0.082 0.000 1.000 0.082 NA 0.918
15.5 0.098 0.000 1.000 0.098 NA 0.902
17.5 0.131 0.000 1.000 0.131 NA 0.869
18.5 0.213 0.000 1.000 0.180 NA 0.820
19.5 0.180 0.000 1.000 0.213 NA 0.787
20.5 0.246 0.000 1.000 0.246 NA 0.754
21.5 0.262 0.000 1.000 0.262 NA 0.738
22.5 0.295 0.000 1.000 0.295 NA 0.705
23.5 0.459 0.000 1.000 0.459 NA 0.541
24.5 0.574 0.000 1.000 0.574 NA 0.426
25.5 0.705 0.020 0.980 0.685 35.25 0.301
26.5 0.852 0.220 0.780 0.632 3.872 0.189
27.5 0.934 0.340 0.660 0.594 2.747 0.100
28.5 0.984 0.380 0.340 0.604 2.589 0.025
29.5 1.000 0.620 0.380 0.380 1.612 0.000
31.0 1.000 1.000 0.000 0.000 1.000 NA
Abbreviations: NA; not applicable, Sn; sensitivity, Sp; specificity, LR+; positive likelihood, LR−;
negative likelihood
Table 5. Comparison of CAIT clinimetric properties between studies
Test
Characteristic
Hiller et al
(cutoff ≤ 27)
Wright et al
(cutoff ≤ 25)
Japanese version
(cutoff ≤ 25)
Sensitivity 0.860 0.951 0.705
Specificity 0.830 1.000 0.980
LR+ 4.890 27.171 35.35