An Electrochemical Study on
Novel Nano-designed Composite Electrode Materials
for Safe and High-performance Lithium Ion Batteries
By Kazuaki Kisu
Thesis submitted to
Department of Applied Chemistry,
Faculty of Technology,
Tokyo University of Agriculture and Technology
Contents
Preface
Chapter 1. Introduction
1.1. General introduction and lithium ion battery
1.2. Next generation high performance lithium ion battery
1.2.1. Conventional anode materials of graphite and the other carbon materials 1.2.2. Alloying and conversion type anode material to improve the energy density 1.2.3. Conventional cathode materials for lithium ion battery
1.2.4. Cathode material for high power lithium ion battery system 1.3. Objectives
References
Chapter 2. Origin of Anomalous Large Reversible Capacity for SnO2 conversion reaction 2.1. Introduction
2.2. Experimental 2.2.1. Materials
2.2.2. Preparation of nc-SnO2/KB Composite under UC Treatment 2.2.3. Physicochemical Characterizations of the nc-SnO2/KB Composite
2.2.4. Electrochemical and Battery Characterizations of nc-SnO2/KB Composite 2.2.5. In-Situ XAFS Measurement
2.3. Results and Discussion
2.3.1. Crystallographic characterization 2.3.2. Thermal characterization
2.3.3. Electron Microscopic Observation 2.3.4. Electrochemical characterization 2.3.5. Microscopy after charge/discharge test 2.3.6. Voltammetry and Cycleability
2.3.7. Quantify the degree of Reversibility of the SnO2 Conversion reaction 2.3.8. In-situ X-ray absorption fine structure measurement
2.3.9. Microscopy of bulk SnO2 electrode after charge/discharge test 2.3.10. Composite structure model of SnO2/KB composite
during charge discharge test 2.4. Summary
Chapter 3. Ultrafast Nano-Spherical Single-Crystalline of LiMn0.792Fe0.198Mg0.010PO4 Solid-Solution Confined among Unbundled Interstices of SGCNT 3.1. Introduction
3.2. Experimental 3.2.1. Materials
3.2.2. LiMn0.792Fe0.198Mg0.010PO4/SGCNT synthesis 3.2.3. Physicochemical characterization
3.2.4. Electrochemical characterization 3.3. Results and discussion
3.3.1. Material Design and Synthetic Optimization 3.3.2. Structural Control to Nano-sized Solid-solution 3.3.3. Electrochemical Performance
3.3.4. Ultrafast Behavior and its Origin 3.4. Summary
References
Chapter 4. Ultrafast Nanocrystalline-Li3V2(PO4)3 /Carbon Nanofiber Composites Cathode for Hybridcapacitor System
4.1. Nanocrystalline-Li3V2(PO4)3 /Carbon Nanofiber Composite 4.1.1. Introduction
4.1.2. Experimental 4.1.2.1. Materials
4.1.2.2. Preparation of Li3V2(PO4)3/CNF composite under UC treatment 4.1.2.3. Physicochemical characterizations of the Li3V2(PO4)3/CNF composite 4.1.2.4. Electrochemical and battery characterizations of
Li3V2(PO4)3/CNF composite 4.1.3. Results and discussion
4.1.3.1. Material Design and Synthetic Optimization 4.1.3.2. Electrochemical Performances
4.1.3.3. Ultrafast behavior and long-term cyclability 4.1.3.4. Structural Control to Nano-sized crystal 4.1.4. Summary
4.2. Nanocrystalline-Li3V1.8Al0.2(PO4)3 /Carbon Nanofiber Composite 4.2.1. Introduction
4.2.2. Experimental 4.2.2.1. Materials
4.2.2.2. Preparation of Li3V2(PO4)3/CNF composite under UC treatment 4.2.2.3. Physicochemical characterizations of the Li3V2(PO4)3/CNF composite 4.2.2.4. Electrochemical and battery characterizations of
Li3V2(PO4)3/CNF composite 4.2.3. Results and discussion
4.2.3.1. Material Design and Synthetic Optimization 4.2.3.2. Electrochemical Performance
4.2.4. Summary References
Chapter 5. General conclusion
Reference materials
List of Papers Related to This Research List of Reference Articles
Preface
Lithium-ion batteries (LIBs) are rechargeable energy devices, which are in widespread use
as electric power supplies for portable electric devices and power tools, because of their high
volumetric energy density and high cycleability. In addition, LIBs are expected to be the
alternative electric power supplies for conventional nickel-hydride batteries used in hybrid
electric vehicles (HEVs) and pure electric vehicles (EVs). The newly released HEVs of BYD
Inc. (China) at the end of 2009 are announced to be equipped with the LIBs, and various
automakers are reported to release the LIB-equipped HEVs from 2010. Many investors expect
that the value of the LIB market is going to grow to 2 trillion yen in 2020, which is 4 times
higher than that of 2009 (50 billion yen). In actuality, however, the energy density and power
capability is still insufficient to meet the demands of customer electronics, and more
importantly, electronic automotive applications.
The main reason of these limitations is the active electrode materials in LIBs, namely anode
and cathode materials. For example, graphite is the most widely used anode material in
commercial LIBs. However, it cannot meet the requirements for high capacity LIBs because its
theoretical value is only 372 mAh g-1, which has already been nearly reached. On one hand,
commercial cells utilize the layer-structured LiCoO2 as a positive electrode, but the high cost
and toxicity of cobalt prohibit its use in large-scale. One of the cobalt-alternative materials for
high rate use is the spinel-type LiMn2O4. There are several reports on those materials for
high-rate usage, however, the reported discharged performance are limited within 50 - 150C,
which is not sufficient for the required power capability in automotive applications.
In my doctor’s thesis, tin dioxide (SnO2) was selected as an anode material with its
theoretical energy density of 1494 mAh g-1 which is close to the quadruple of the graphite, and
polyanion (phosphate) types such as lithium manganese iron phosphate (LiFexMnyPO4; x + y =
of their safe nature and electrochemical stability. These three materials have been regarded as a
promising electrode material for LIB use. Unfortunately, none of them have so far fulfilled their
full potential due to several drawbacks such as poor cycleability, low ionic conductivity and low
electric conductivity.
To overcome such obstacles, three strategies were chosen; i) nanosizing of particle size of
the active materials (SnO2, LiFeMnPO4, and Li3V2(PO4)3) in order to reduce the stress of
particle volume change during charge-discharge and to reduce the ionic and electric path length
of the particles, ii) doping of other metal ion such as Mg a in order to enhance the ionic and
electic conductivity of the compounds itself, and iii) nanocompositing of these nano-sized
particles with nanocarbon such as carbon blacks (Ketjen Black (KB))and carbon nanotubes
(supergrowth carbon nanotube (SGCNT) and carbon nanofiber (CNF)) which are highly electric
conductive and possesses high specific surface area (> 200 m2 g-1) in order to assure fast electric
conduction from metal current collectors (Al and Cu) and stabilize the interface of nanoparticles
by accommodating of the particles within their hollow structure or interstices. These three
strategies were simultaneously achieved by using the ultracentrifugation (UC) treatment, which
is an original technique from our laboratory, using ultracentrifugation force of 75,000G.
In this thesis, one can see the data of SnO2/KB, LiMn0.792Fe0.198Mg0.010PO4/SGCNT, and
Li3V2(PO4)3/CNF, which not only overcame their drawbacks, but also overwhelmed the so-far
reported publications by years of 2014. In addition, detailed mechanism characterization was
devoted in the manuscript in order to explain the reasons of excellent electrochemical
Chapter 1
1.1. General introduction and lithium ion battery
Energy storage devices are some of the most promising and important environmental technologies that are highly influential in advancing our civilization's abilities and standard of living.1 Among these energy storage devices, lithium-ion battery is currently the widest and most promising electrochemical energy storage device for many important applications, such as portable electronic consumer devices, electro vehicles (EVs), and a smart-grid. The common concept of present lithium ion batteries, at the cathode side, on transition metals oxides or phosphates active materials (LiCoO2,2 LiMn2O4,3 LiCo1/3Mn1/3Ni1/3O2,4 and LiFePO45), while graphite6 or Li4Ti5O127 is commonly used as anode active material. Cathode and anode are separated by a membrane made of polypropylene/polyethylene8 filled with electrolyte which contains lithium salt (LiPF6,9 LiBF4,10 and LiTFSI11) in alkyl organic carbonate12 (EC, DEC, DMC, PC) at different ratio. The separator prevents the electrical contact between both electrodes and, at the same time, it allows the diffusion of lithium ion from cathode to anode during the charging and the reverse discharging process. Fig. 1-1 illustrates the basic lithium ion battery system that leads the current battery market, and serves as the starting point for
following doctoral thesis. For example, the chemical reactions occurring in typical lithium ion battery based on LiCoO2 cathode and graphite anode are as follows;
Anode : Graphite C + xLi+ + xe-
↔ LixC6
Cathode material : LiCoO2 LiCoO2 ↔ Li1-xCoO2 + xLi+ + xe- ( 0 ≤ x ≤ 1 )
1.2. Next generation high performance lithium ion battery
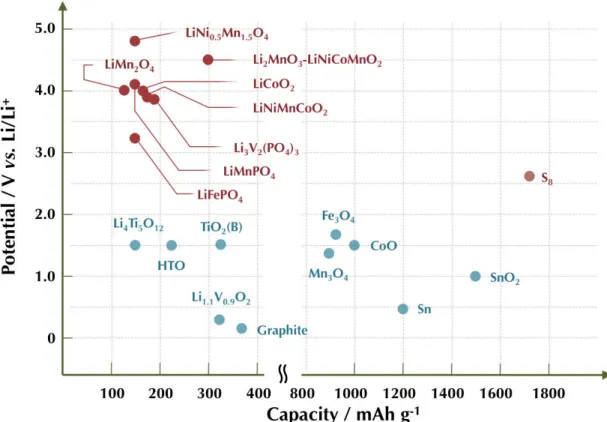
High performance lithium ion batteries are now a direct requirement in the change to renewable and sustainable energy applications such as vehicles, power tools, and UPS. In order to replace the conventional gasoline powered vehicles with the EVs, however, there have therefore been growing needs to build lithium ion batteries both with high energy densities and high power densities. The optimization of both electrode of anode and cathode material is effective in improving power densities without sacrificing their high energy densities. As described in the previous section, the commercially used lithium ion batteries include graphite anode and cathodes from the following list: LiCoO2, LiMn2O4, and LiFePO4. Active materials, in order to be considered suitable candidates (Si metal, Sn metal, SnO2, MoS2 as anode material, LiMnPO4, Li3V2(PO4)3, Li2FeSiO4, Li2MnSiO4 as cathode material as shown Fig. 1-2) for next generation lithium ion batteries, should fulfill the requirements of reversible capacity, good lithium ion and electrical conductivity, long term cycleability, high rate capability, low cost, and low environmental impact. Many efforts have been done in the investigation of both electrodes for high energy density and high power density. However, these candidates have not been able to be more than conventional electrode materials because of intrinsic low electrical conductivity, lithium ion conductivity, volume expansion leading to low cycleability, and safety. As the solution for these problems, nano-size and tailored morphology represent the key feature capable of leading these innovative materials from being theoretically relevant to an effective technological breakthrough. The expected advantages from using nanotechnology in LIBs can be listed13
i) Realization of active materials with high surface to volume ratio, therefore
intensification of the presence of active sites for lithium storage. This would result in a considerable in- crease of the specific capacity. Furthermore, the high surface area would imply a high contact area with the electrolyte, hence leading to high lithium-ion flux across the electrode/ electrolyte interface.
ii) Considering that some of the electrochemical reactions are hard to be triggered in bulk materials, shifting the anode research to the nanoscale would result in removing these limitations.
enhanced power capability. iv) Higher electron transfer rates.
Figure 1-2. Schematic illustration of active anode/cathode candidate for the next generation lithium ion batteries. Potential vs. Li/Li+ and the corresponding capacity density are shown.
In addition, it is important to mention that safety considerations are not less important than performance, since an accident with an EV due to battery failure may take the field many years backwards. High energy density means high safety risks, and it is the responsibility of the scientists who lead the research and developments efforts in these field not to allow the commercialization of new lithium ion battery systems before it is clear that they meet all the safety requirements.13
material for lithium ion secondary battery in point of safety and durability. Whereby, many
efforts have focused on investigation to fabricate the host materials which are able to possess
the lithium into itself. Among them, graphite, because of its ability to intercalate both rapidly
and reversibly one lithium per six carbons (leading to a capacity of 372 mAh g-1) at a potential < 0.5 V vs. Li/Li+, is presently used as the anode material in commercial lithium ion batteries.6 However, graphite also has a intrinsic problems such as volumetric and gravimetric capacity,
first irreversible capacity, super high rate capability, and safety. In an effort to get through the
further improvement of anode material, many researchers have generated a lot of candidates
which are contained the other carbon material such as hard carbon, lithium titanate oxide, an
alloying type such as silicon and tin metal, conversion type anode material, and so on.
A general feature of intercalation into graphite is the stepwise formation of a periodic array
of unoccupied layer gaps at low concentrations of guest species, called stage formation. This
stepwise process can be described by the stage index, which is equal to the number of graphene
layers between two nearest guest layers.
1.2.2. Alloying and conversion type anode material to improve the energy density The current choice of anode materials for lithium-ion batteries is graphite due to its long
cycle life, abundant material supply and relatively low cost. However, Although graphite
remains the most widely used anode material in commercial LIBs, it cannot meet the
requirements for high-capacity LIBs, because its theoretical value is only 372 mAh g-1, which has already nearly been reached. Thus, alternative high-capacity anode materials are required
and have been vigorously investigated. For example, metal oxides such as Mn3O4,14 Fe2O3,15 Fe3O4,16 CoO,17 Co3O4,18 NiO,19 CuO,20 ZnO,21 MoO3,22 SnO2,23 and SiO2,24 which act as anode materials undergoing conversion reactions, have attracted intense interest because of their high
theoretical capacities (700-1500 mAh g-1), regardless of some issues such as inappropriate voltage range (from 0 to 2~4 V vs. Li/Li+ ) and initial irreversible capacity for practical application of LIBs.
1.2.3. Conventional cathode materials for lithium ion battery
years despite displaying relatively limited electrochemical performance. As the cathode material for lithium ion secondary battery, required properties are high energy density ( = high reversible capacity × high redox potential), improvement for cycleability, enhancement of rate capability, high safety, environmental suitability, and so on. Among them, high reversible capacity relates with the number of the lithium ion sites in the crystal, and high redox potential lilies on electronic state of crystal. In order to improve the rate capability, it is necessary to possess the lithium ion path within crystal structure, and high crystal stability is important factor for long term cycleability too. All things such as lithium ion sites and path considered, the available cathode materials are limited to three types; layered type (LiCoO2, LiNiO2,25 and so on), spinel type (LiMn2O4, LiNi0.5Mn1.5O4
26
), poly-anion type (LiFePO4, 5
LiMnPO4, 27
Li3V2(PO4)3, 28
Li2FeSiO4, 29
LiVPO4F, 30
and so on).
1.2.4. Cathode material for high power lithium ion battery system
As for application of high energy and power Lithium ion batteries, there are many candidates of cathode material. For example, the coating of LiCoO2 nanoparticles with CuO have demonstrated significant improvement in performance owing to the advantages associated with nanoscale cathode materials and the structural stability induced by coatings as discussed earlier. One example is the coating of LiCoO2 nanoparticles with thin CuO coating.
31 For another example, Kim et. al. fabricated ultra-thin LiMn
2O4 nanowires through solid state
reactions at relatively lower temperatures. Even at cycling rates as high as 150C, these ultra-thin spinel LiMn2O4 nanowires provided capacities of 78 mAh g
-1 with excellent stability over 100
achieving through reducing the particle size, control structure, carbon coating, and carbon composite.
1.3. Objectives
In this thesis, I have been attempted to design and create high-rate and electrochemically stable electrode materials by nano-structuring of energy storage materials, such as SnO2, LiMn0.8Fe0.2PO4 and Li3V2(PO4)3. In chapter 2, in order to obtain the high reversible SnO2 nano particle, I prepared a novel UC-treated SnO2/KB composite that readily transforms into a blended amorphous structure composed of LixSnO1.45 (x = 0-7.3). In chapter 3 and 4, as a higher power density, composites of nano-crystalline LiMn0.792Fe0.198Mg0.010PO4 and Li3V2(PO4)3 with carbon material such as single/multi-walled carbon nano tubes (S/MWCNT) were prepared by UC method and subsequent flash annealing.
Reference
1. M. Armand and J. M. Tarascon, Nature, 2008, 451, 652-657.
2. M. Menetrier, I. Saadoune, S. Levasseur and C. Delmas, J. Mater. Chem., 1999, 9, 1135-1140. 3. H. Huang, C. H. Chen, R. C. Perego, E. M. Kelder, L. Chen, J. Schoonman, W. J. Weydanz and D.
W. Nielsen, Solid State Ionics, 2000, 127, 31-42.
4. C. S. Johnson, N. Li, C. Lefief, J. T. Vaughey and M. M. Thackeray, Chem. Mater., 2008, 20, 6095-6106.
5. A. K. Padhi, K. S. Nanjundaswamy and J. B. Goodenough, J. Electrochem. Soc., 1997, 144, 1188-1194.
6. C. S. Wang, G. T. Wu and W. Z. Li, J. Power Sources, 1998, 76, 1-10.
7. K. Naoi, S. Ishimoto, Y. Isobe and S. Aoyagi, J. Power Sources, 2010, 195, 6250-6254.
8. L.-F. Fang, J.-L. Shi, B.-K. Zhu and L.-P. Zhu, Journal of Membrane Science, 2013, 448, 143-150. 9. C. L. Campion, W. T. Li and B. L. Lucht, J. Electrochem. Soc., 2005, 152, A2327-A2334.
10. K. Hayamizu, Y. Aihara, H. Nakagawa, T. Nukuda and W. S. Price, J. Phys. Chem. B, 2004, 108, 19527-19532.
12. D. Aurbach, Y. Eineli, B. Markovsky, A. Zaban, S. Luski, Y. Carmeli and H. Yamin, J. Electrochem. Soc., 1995, 142, 2882-2890.
13. V. Etacheri, R. Marom, R. Elazari, G. Salitra and D. Aurbach, Energy Environ. Sci., 2011, 4, 3243-3262.
14. D. Yonekura, E. Iwama, N. Ota, M. Muramatsu, M. Saito, Y. Orikasa, W. Naoi and K. Naoi, Phys. Chem. Phys. Chem., 2014, 16, 6027-6032.
15. M. F. Hassan, Z. Guo, Z. Chen and H. Liu, Mater. Res. Bull., 2011, 46, 858-864.
16. P. Lian, X. Zhu, H. Xiang, Z. Li, W. Yang and H. Wang, Electrochim. Acta, 2010, 56, 834-840. 17. H. Qiao, L. Xiao, Z. Zheng, H. Liu, F. Jia and L. Zhang, J. Power Sources, 2008, 185, 486-491. 18. H. Kim, D.-H. Seo, S.-W. Kim, J. Kim and K. Kang, Carbon, 2011, 49, 326-332.
19. X. H. Huang, J. P. Tu, C. Q. Zhang, X. T. Chen, Y. F. Yuan and H. M. Wu, Electrochim. Acta, 2007, 52, 4177-4181.
20. H. Wang, Q. Pan, J. Zhao and W. Chen, J. Alloys Compd., 2009, 476, 408-413.
21. X. H. Huang, X. H. Xia, Y. F. Yuan and F. Zhou, Electrochim. Acta, 2011, 56, 4960-4965. 22. M. F. Hassan, Z. P. Guo, Z. Chen and H. K. Liu, J. Power Sources, 2010, 195, 2372-2376. 23. S. Oro, K. Urita and I. Moriguchi, Chem. Commun., 2014, 50, 7143-7146.
24. B. Guo, J. Shu, Z. Wang, H. Yang, L. Shi, Y. Liu and L. Chen, Electrochem. Commun., 2008, 10, 1876-1878.
25. M. J. Wang and A. Navrotsky, Solid State Ionics, 2004, 166, 167-173.
26. G. Q. Liu, L. Wen and Y. M. Liu, J. Solid State Electrochem., 2010, 14, 2191-2202. 27. G. H. Li, H. Azuma and M. Tohda, Electrochem. Solid State Lett., 2002, 5, A135-A137. 28. H. Huang, S. C. Yin, T. Kerr, N. Taylor and L. F. Nazar, Adv. Mater., 2002, 14, 1525-1528. 29. S. Ferrari, D. Capsoni, S. Casino, M. Destro, C. Gerbaldi and M. Bini, Phys. Chem. Chem. Phys.,
2014,16, 10353-10366.
30. J. Barker, M. Y. Saidi and J. L. Swoyer, J. Electrochem. Soc., 2003, 150, A1394-A1398. 31. Q. Hao, H. Ma, Z. Ju, G. Li, X. Li, L. Xu and Y. Qian, Electrochim. Acta, 2011, 56, 9027-9031. 32. H.-W. Lee, P. Muralidharan, R. Ruffo, C. M. Mari, Y. Cui and D. K. Kim, Nano Lett., 2010, 10,
Chapter 2
Origin of Anomalous Large Reversible
2.1. Introduction
Lithium-ion batteries (LIBs) are the most widely used type of rechargeable electrochemical
energy storage device because of their high volumetric energy density and excellent service life.
However, their energy and power capabilities are still insufficient to meet the demands of
consumer electronics and, more importantly, electronic automotive applications.1 Although
graphite remains the most widely used anode material in commercial LIBs, it cannot meet the
requirements for high-capacity LIBs, because its theoretical value is only 372 mAh g-1, which
has already nearly been reached.2 Thus, alternative high-capacity anode materials are required
and have been vigorously investigated. For example, metal oxides such as V2O3,3 MnO,4
Mn3O4, 5
Fe2O3, 6
Fe3O4, 7
CoO,8 Co3O4, 9
NiO,10 CuO,11 ZnO,12 MoO3, 13
SnO2, 14
and SiO2, 15
which
act as anode materials undergoing conversion reactions, have attracted intense interest because
of their high theoretical capacities (700-1500 mAh g-1), regardless of some issues such as
inappropriate voltage range (from 0 to 2~4 V vs. Li/Li+ ) and initial irreversible capacity for practical application of LIBs. SnO2 is the one of the most well-characterized systems among
those conversion anodes because of its high theoretical capacity of 1494 mAh g-1 (quadruple of
the theoretical capacity of graphite) delivered in a relatively lower operation voltage range of
0-2 V.16 Furthermore, SnO2 is inexpensive, exhibits low toxicity, and is environmentally
benign.17
It is generally understood that SnO2 undergoes two types of redox reactions in which 8.4
electrons and Li+ are theoretically exchanged in total.18 First, the conversion reaction (SnO 2 + 4Li+ + 4e- Sn + Li2O) occurs at 1.54 V vs. Li/Li
+
during the lithiation process. This
conversion reaction was considered as completely irreversible until early beginning of 200019-21,
while some of recent reports suggest that it is partially reversible22,23. The subsequent alloying
process (Sn + 4.4Li+ + 4.4e
Li4.4Sn) occurs over a wider voltage range of 0.3-0.7 V and is recognized to be more reversible.24 One serious problem with the alloying reaction is the drastic
volumetric expansion (max. 359%) occurring during the complete alloying from Sn(0) to the
fully lithiated state of Li4.4Sn.
18 Such a large volume expansion19,24,25 induces surface cracking
and damage to the whole electrode, including both the tin (SnO2) and the carbon conductive
agents (e.g., acetylene black). This may cause a loss of electrical contact between SnO2 and the
pulverization associated with the large volumetric increase up to, typically, 100 cycles.26-28 Winter et. al.19 clearly demonstrated such cracking by performing careful SEM observations during the alloying process. Two important approaches have been proposed to overcome these pulverization problems. One is to use nanosized SnO2 to reduce the absolute volume changes of the reactive phases, and the other is to design a stabilized multiphase composition29 or microstructure in which nanoscale SnO2 is finely dispersed in a well-accommodated neighboring matrix that allows smooth lithiation. Several major attempts have been made to improve the cycling performance of SnO2 up to around 200 cycles.30 Among these approaches, “nanocompounding,” in which “nanofabrication” of the SnO2 and “nanocompositing” with carbon material are achieved simultaneously, has been particularly promising. The nanofabricated SnO2 can be prepared using either sol-gel or hydrothermal methods with Sn(II)Cl2
31 or Sn(VI)Cl 4
32 as the starting material. Furthermore, various organic compounds such
as glucose,33 phenol formaldehyde,34 ethylene glycol,35 and sucrose36 have been examined as carbon sources for multifunctional nanocompositing agents. Carbon nanotubes37,38 and graphene oxide39,40 have also been examined as a more effective carbon matrix. Nanocompounding normally yields SnO2 particles (5 to 10 nm) smaller than those in commercially available reagent-grade SnO2 (primary particle size = 100 nm; Aldrich). This nanocompounding certainly prolonged the cycle lifetimes, somewhat, to around 200 cycles, but a long cycling life over 200 cycles had not been achieved. The factors contributing to such short cycle lifetimes are considered to be (1) aggregation of the SnO2 nanoparticles over 200 cycles and (2) possible decomposition of the electrolytes catalyzed by the reduced Sn(0) nanoparticles. Recently, there are two reports on the SnO2/graphene composites, which show a high reversible capacity of 800-1350 mAh g-1 over 500-1,000 cycles.41,42 Such a long cycle life was achieved owing to the encapsulation of SnO2 nanoparticles (4-5 nm prepared via. hydrothermal method) by graphene 2D layers, which limits aggregation of tin nanoparticles generated during lithiation.
treatment, nanosized (ca. 2 nm) hydrous RuO2/KB composite was successfully prepared. 43 The
UC treatment drives an in-situ sol-gel reaction generating nanosized (< 5 nm) SnO2 particles that are hyperdispersed and confined within the KB matrix. In the present study, I chose SnO2 as a model material to dealt with the conversion essentials. I will describe the optimally dispersed and encapsulated nanophase crystalline SnO2 (nc-SnO2)/carbon composite exhibiting a highly reversible capacity of 837 mAh g-1 up to > 1,200 cycles. Detailed evaluation of the structural features and electrochemical properties of the UC-treated nc-SnO2/KB was also performed to propose a new mechanism that renders the conversion reaction highly reversible for prolonged cycle lifetimes.
2.2. Experimental
2.2.1. Materials
I first used Sn(II)Cl2·2H2O (Kanto Chemical Inc.) as a source of SnO2 and a hollow-structured Ketjen Black (KB; EC600JD, Ketjen Black International Company) with 50 nm primary particles with a specific surface area (SSA) of 1270 m2 g-1 as a carbon matrix to entangle with the growing nanoscale SnO2. 6 M HCl aq. (Wako Pure Chemicals) was added to the starting solution to enhance the dissolution of Sn(II)Cl2·2H2O prior to the UC treatment, and 1 M NaOH aq. (Wako Pure Chemicals) was used to drive sol-gel process via hydration and polycondensation. Distilled water (17 MΩ cm) was used as a medium for the entire preparation scheme.
2.2.2. Preparation of nc-SnO2/KB Composite under UC Treatment
hyperagitation at 75,000G. The second UC process induces the hydrolysis reaction in a
controlled manner to achieve in-situ nucleation of the SnO2 polynuclear precursors on KB. With this two-step UC process, the obtained particle size is well-controlled and is even smaller than
the mean sizes reported previously.43 The resultant solution with a dark precipitate consisting of precursor composites was filtered, washed with distilled water several times, and then dried at
180°C in vacuo for 12 h.
2.2.3. Physicochemical Characterizations of the nc-SnO2/KB Composite
The detailed nanostructure of the composites was characterized by high-resolution transmission
electron microscopy (HRTEM, Hitachi H9500 model) to evaluate the particle size distribution
of the nc-SnO2 and the disordered structure of the microcrystalline graphite of KB. X-ray diffraction (XRD, Rigaku SmartLab) measurements were performed to characterize the
crystalline structure of the nc-SnO2/KB in the composite. In order to characterize the stoichiometry of the composites, thermal analysis was performed under a synthetic air
atmosphere (O2 : 20%, N2 : 80%) using a thermogravimetry differential thermal analyzer (TG/DTE, Seiko Instruments TG/DTA6300).
2.2.4. Electrochemical and Battery Characterizations of nc-SnO2/KB Composite.
The half-cell was assembled with a Li metal electrode and a nc-SnO2/KB electrode using a 2032 coin-type cell. The electrolyte was a mixture of ethylene carbonate (EC) and diethyl
carbonate (DEC) containing 1 M lithium hexafluorophosphate (LiPF6) as an electrolyte salt. The nc-SnO2/KB electrode was prepared by mixing the composite (85% by mass), acetylene black (AB, Denka Acetylene Black HS-100, provided from DENKI KAGAKU KOGYO K.K
(DENKA); 5%), and polyvinylidene difluoride (PVdF; 10%) in N-methyl pyrrolidone (NMP).
The mixture was coated on Cu foil (current collector) and dried at 150°C in vacuo for 3 h. The
thickness of the nc-SnO2/KB electrode was controlled to ca. 20 µm. The average loading mass of active material was ca. 0.5 mg cm-2. Charge-discharge tests were performed in CC-CV(lithiation) and CC (delithiation) mode between 0.0 and 2.0 V at a current density of 0.2
2.2.5. In-Situ XAFS Measurement
In-situ X-ray adsorption fine structure (XAFS) measurements at the Sn K-edges were performed in a fluorescence mode on the composite samples at the beam line BL14B247 of the synchrotron radiation facility Spring-8 (Hyogo, JAPAN). The fluorescence signals were collected by a 19-element solid-state detector. Using this SnO2/KB composite electrode, laminate-type two-electrode cells were assembled with lithium metal foil. Charge-discharge tests were performed on the assembled laminate cell in the voltage range of 0-2.0 V during the 1st and 10th cycles at a rate of 0.2C. The XAFS spectra were recorded at an equilibrium state following a rest period of 20 min at each voltage. The obtained XAFS spectra were analyzed with the spectral fitting software REX2000 (Rigaku Corp.) to evaluate the ratio of Sn species with different valance states such as Sn0 (Sn metal), Sn4+ (SnO2), Sn
(Li4.4Sn).
2.3. Results and discussion
2.3.1 Crystallographic characterization
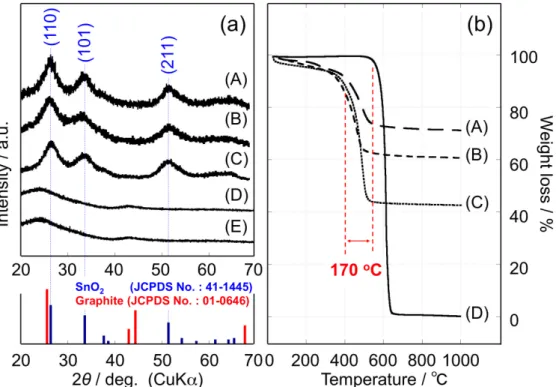
I varied the Sn dosing ratio from 30 wt% to 90 wt% in an attempt to synthesize SnO2/KB nanocomposites with the maximum SnO2 contents. The crystalline structure of the obtained SnO2/KB composite was confirmed by XRD analysis. A dosing ratio of over 90 wt% gave strong and sharp XRD signals for SnO along with broad peaks attributed to rutile SnO2. For SnO2 dosing ratios from 30 wt% to 80 wt%, only the rutile SnO2 was formed. Fig. 2-1a shows the XRD patterns of three SnO2/KB composites with SnO2 dosing ratios of 80 wt% (Fig. 2-1a(A)), 70 wt% (Fig. 2-1a(B)), and 50 wt% (Fig. 2-1a(C)). As mentioned above, the major phase was rutile SnO2 overlaid by broad peaks of KB. I found that dosages of 50 wt%-80 wt% gave reasonable SnO2/KB composites after our UC treatment. When the dosing ratio was increased from 50 wt% (Fig. 2-1a(C)) to 80 wt% (Fig. 2-1a(A)), all the XRD peaks became slightly sharper, indicating either a slight increase in the SnO2 crystal size or an increase in crystallinity. The three broad peaks for the (110), (101), and (211) planes are in good agreement with the reported XRD results for hydrothermally synthesized SnO2 (5-6 nm).
48,49 Assuming that
wt% SnO2), 2-1a(B) (70 wt%), and 2-1a(A) (80 wt%), respectively. The sizes calculated in the three different directions were the same for all composites. This suggests that the obtained single nanocrystals of SnO2 have spherical shapes. The proportionality of the calculated size to the SnO2 dosing ratio (50 wt%, 70 wt%, and 80 wt%) reflects the effect of the amount of KB on the size-control of the SnO2 particles. For dosing ratios below 50 wt%, the particle size was the same as for the dosage of 50 wt%, indicating the limit of the size-control effect of KB on SnO2 particles.
2.3.2. Thermal characterization
Thermogravimetric analysis (TGA) was performed on SnO2/KB composites under an air atmosphere in order to estimate the ratio of SnO2 and KB from the residual SnO2 weight after oxidative decomposition of KB. Fig. 2-1b shows TGA curves for three SnO2/KB samples with different dosing ratios, viz., 80/20 (Fig. 2-1b(A)), 70/30 (Fig. 2-1b(B)), and 50/50 (Fig. 2-1b(C)), and the pure KB (UC-treated KB, denoted as UC-KB, Fig. 2-1b(D)) as a reference. All TGA curves except that for the reference KB indicate two stages of weight loss. The initial weight loss in the temperature range of 25-200°C can be attributed to a small quantity of water and gases absorbed from the ambient. Next, the decomposition of the surface functional groups on the KB (such as lactone and carboxyl)50 is observed at 200-400°C. The amount of oxidative decomposition of the KB can be estimated by subtracting the weight at 800°C from that at 200°C. The resulting SnO2/KB ratios in the composites are found to be 75/25 (Fig. 2-1b(A)), 63/37 (Fig. 2-1b(B)), and 45/55(Fig. 2-1b(C)), respectively. These values are slightly lower than the respective dosing ratios. However, it is noteworthy that there are large differences in the decomposition temperature: the SnO2-containing KB (Fig. 2-1b(A), (B), (C)) combusted at 430°C, which is 170°C lower than the UC-KB decomposition temperature (600°C). Gao et. al. discovered a similar shift of the combustion temperature by about 100°C (decrease from 653 to 551°C) when the pristine CNTs and TiO2-grafted(5-10 nm particles) CNTs were combusted.
51
Figure 2-1. (a) XRD patterns obtained for UC-treated nc-SnO2/KB composites with various dosing ratios: (A) SnO2/KB = 80/20 by mass (75/25, calculated from results of TGA shown in (b)), (B) SnO2/KB = 70/30 (63/37), and (C) SnO2/KB = 50/50 (45/55). Patterns for (D) UC-treated KB (UC-KB) and (E) pristine KB (UC-untreated) are shown for reference. All three SnO2/KB composites have three broad peaks at 2θ = 27°, 34°, and 52°, corresponding to the (110), (101), and (211) planes for the tetragonal rutile structure (space group P42/mnm) of SnO2 (blue: JCPDS No. 41-1445). The XRD patterns for the UC-KB and pristine KB have identical characteristic peaks at 24° and 42° that are shifted to lower angles from the respective (002) and (101) planes for the hexagonal structure (space group P63/mmc) of graphite (red: JCPDS No. 01-0646). (b) TGA curves for UC-treated nc-SnO2/KB composites prepared with the same dosing ratios as in (a): (A) SnO2/KB = 75/25, (B) SnO2/KB = 63/37, (C) SnO2/KB = 45/55. The curve for (D) UC-treated KB (UC-KB) is shown for reference. The measurements were performed at a sweep rate of 5°C min−1
from ambient temperature to 1,000˚C under a synthetic air atmosphere.
2.3.3. Electron Microscopic Observation
The nanostructure of the three SnO2/KB composites was observed by HRTEM to evaluate their morphology and crystal structure. The lower magnification images presented on the
left-hand side of Fig. 2-2(A)-(C) show the highly dispersed SnO2 nanodots ranging from 2 to 6 nm in diameter within the KB matrix. The comparison of the bright-field and dark-field images
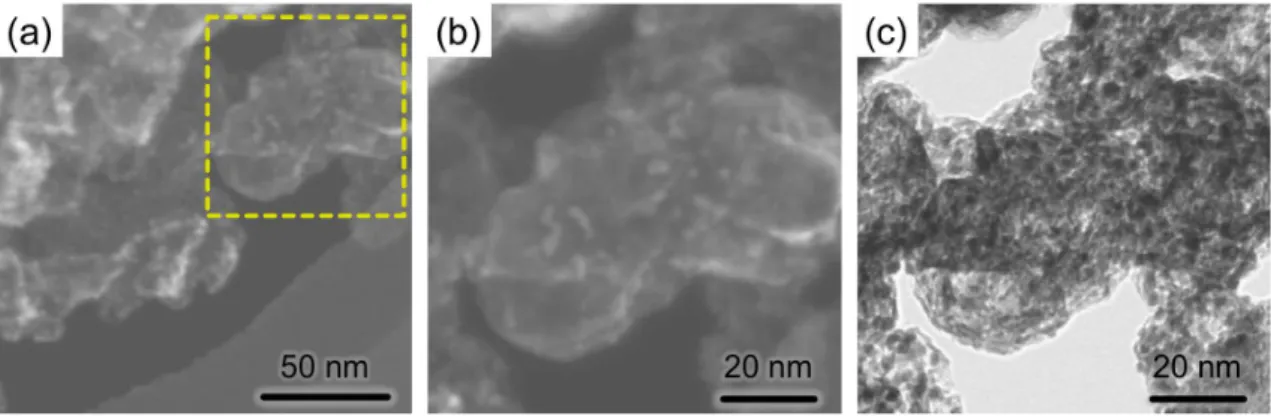
Figure 2-2. Bright-field ((a) and (b)) and dark-field (c) SEM images for the SnO2/KB (45/55) composite. In the bright-field image (a), one can see the agglomerated structure of KB spheres. A part of the agglomeration (the area surround by a yellow dotted square) was re-focused in higher resolution and shown in the image (b). With the closer view of KB structure (image (b)), only few SnO2 particles can be seen on the outer surface of KB. (c) The dark-field SEM image of the same part of KB structure (image (b)) was pictured in order to verify the encapsulation of SnO2 nanoparticles within the KB hollow structure. Contrary to the bright-field image (b), many small SnO2 nanodots with a diameter of few nanometers can be seen in the image (c), which is consistent with the HRTEM image for SnO2/KB (45/55) shown in Fig. 2-3(c).
particles remained encapsulated but seem to be slightly larger, as shown in the middle image in
Fig. 2-3(B). The rest of the particles are attached directly on the outer spheres of the KB nests.
For the 75 wt% SnO2 composite, however, one can hardly see the KB carbon structure (Fig.
2-3(A), middle), while particles are enlarged to 5-6 nm and cover the whole KB matrix. The
enlargement of the SnO2 particles is consistent with the Scherrer analyses of the XRD results
(Fig. 2-1a). Schematic illustrations are presented for each image on the right-hand side of Fig.
2-2. These illustrations of three SnO2/KB composites are also supported by the results of N2
adsorption experiments (see Fig. 2-6). The specific surface area (SSA) of the composites
linearly decreases with a SnO2-dosage increase from 0 wt% (pure KB) up to 67 %, while the
SSA starts to slightly increase from 67 to 75 wt%. The slight increase of the SSA from 67 wt%
can be due to the SnO2 nanoparticles piled on the outer sphere of KB, as shown in Fig. 2-3(A)
for the 75 wt% dosage. Unlike the other two samples, this 75 wt% SnO2 sample, which includes
particles piled together on the KB outer sphere, lost the direct electronic contact between the
particles and the microcrystalline graphitic carbons of the conductive KB, resulting in poor
Figure 2-3. HRTEM images (left; low magnification, middle; high magnification) of the composite formation for (A) SnO2/KB = 75/25, (B) SnO2/KB = 63/37, and (C) SnO2/KB = 45/55, as in Fig. 2-1. Schematic illustrations are presented for each image on the right-hand side. The magnified HETEM views (middle) for the composites show a clear dependency between the degree of the dispersion and the particle sizes of the UC -formed SnO2 within the hollow structure of KB after the UC treatment. The relation between the SnO2 dosing ratio for the SnO2/KB compounds and their specific surface area is shown in Fig. 2-6.
2.3.4. Electrochemical characterization
In order to confirm the effectiveness of the highly dispersed and encapsulated structure of
nanocrystalline SnO2 in the composites for the reversible lithiation-delithiation process, the cyclability of three SnO2/KB composites (SnO2 = 75, 63, and 45 wt%) was tested within the potential range from 0.0 to 2.0 V (Fig. 2-4). The obtained results show that the cyclability of
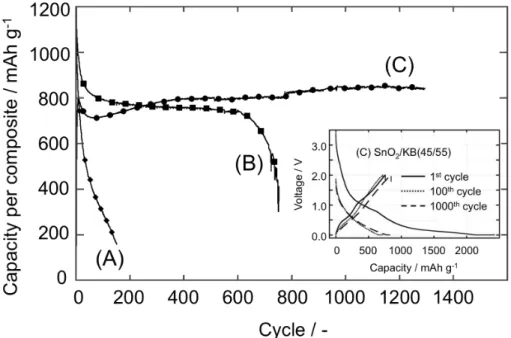
wt%-dosage (A), a capacity of 300 mAh g-1 was obtained at the 100th cycle, and the sample fully degraded after 170 cycles. This value is more or less consistent with the data presented in other representative recent papers (X. Li et. al.53, H. Song et. al.54, M. Alaf et. al.55, J. Huang et. al.56, and X. Fan et. al.36). Those papers reported the samples prepared with various nanocarbons (graphene and single/multi-walled CNTs) composited with loading ratios of 60-90 wt% of mostly sol-gel- or hydrothermal-derived nanosized SnO2 particles (5-30 nm in diameter), and their best performances (400-600 mAh g-1 at around 0.1-0.2C-rate) in the ranges between 50 and 200 cycles. Interestingly, a sample with a lesser dosage (63 wt%) gave the highest capacity of a little over 800 mAh g-1 up to 200 cycles and was proved to be cycleable up to 700 times (see Fig. 2-4(B)). Most strikingly, the sample with the 45% dosage exhibited the longest cycling performance (more than 1,200 cycles), showing a gradually increasing capacity from 720 to 837 mAh g-1, as shown in Fig. 2-4(C). In fact, the 45 wt% SnO
2 composite sample showed both exceptional cycling performance (1,200 cycles) and high coulombic retention (over 99%) simultaneously as shown in the inset of Fig. 2-4 (charge-discharge curves).
Figure 2-4. Cycling performance for three UC-treated nc-SnO2/KB composites with various dosing ratios: (A) SnO2/KB = 75/25 (by mass), (B) SnO2/KB = 63/37, and (C) SnO2/KB = 45/55. The cycling test was performed on half-cells consisting of Li/1 M LiPF6 (EC+DEC)/UC-SnO2/KB in the CC-CV (lithiation) and CC (delithiation) mode between 0.0 and 2.0 V at a current density of 300 mA g-1 (0.2C). The inset figure shows the charge-discharge curves at 1st, 100th, and 1,000th cycle for the composite (C) SnO
Such high performance has never been attained to date, according to previous reports.36,52-56 The reversible capacity of 837 mAh g-1 (at > 1,200 cycles) is equivalent to 1444 mAh g-1 relative to the mass of the SnO2 active material, suggesting that the conversion reaction itself became reversible. This 1444 mAh g-1 capacity is purely ascribable to the capacity of SnO2 in the 45 wt% dosage sample, since the capacity ascribed to the pure KB, 340 mAh g-1, has already been subtracted. The KB capacity (340 mAh g-1) was determined independently on the basis of a cycling test on a pristine UC-treated KB electrode (UC-KB, Fig. 2-5).
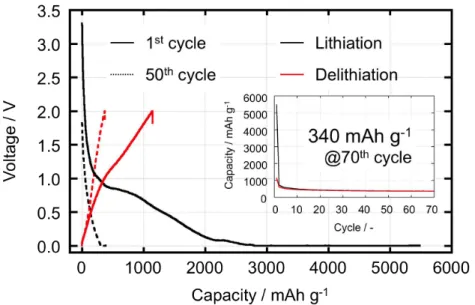
Figure 2-5. Charge discharge curves for the pure KB (UC-treated KB, denoted as UC-KB in the article) at 1st (heavy line) and 50th (broken line) cycle. The cycling test was performed on half cells consisting of Li/1 M LiPF6 (EC+DEC)/UC-KB in the CC-CV (lithiation) and CC (delithiation) mode between 0.0 and 2.0 V at a current density of 300 mA g-1 (the same current density as the data shown in Fig. 2-4). Inset shows the specific capacity of the discharge (lithiation) and charge (delithiation). The stable charge-discharge capacity of UC-KB was 340 mAh g-1 at 70th cycle.
In the case of SnO2/KB (45:55), the capacity per SnO2 after 1,200 cycles (1444 mAh g -1)
was calculated from the following equation;
Cap.SnO2 = (Cap. SnO2/KB * 1.00 – Cap.KB * 0.55) / 0.45
Cap.SnO2,, Cap.SnO2/KB, and Cap.SnO2/KB represent the capacity purely attributed to the SnO2 particles, the capacity per SnO2/KB (45/55) composite (837 mAh g
-1
capacity purely attributed to the KB (340 mAh g-1), respectively. These different cycling
durabilities due to the different dosing ratios (SnO2 = 45-70 wt%) can be explained by the
structure of each composite. SnO2 reacts with 8.4 lithium ions in the conversion and alloying
reaction, which causes a 359% volume expansion.18 In addition, generation of Li2O in the
conversion reaction causes further volume expansion. Thus, during the lithiation process of
SnO2, rapid aggregation will easily occur if the sufficient distance cannot be kept among SnO2
particles. From the results of TEM observation (Fig. 2-3) and the N2 adsorption experiments
(see Fig. 2-6), the SnO2/KB composites can be classified into two groups depending on the
SnO2 loading value: one is the high-dispersion composites with highly dispersed SnO2
nanoparticles confined within the hollow structure of KB when the SnO2 dosage is less than 67
wt%, and the other is the outer-deposition composites with the exposed and piled SnO2
Figure 2-6. [Top]Nitrogen adsorption–desorption isotherm curves for the (a) SnO2/KB = 75/25, (b) SnO2/KB = 63/37, (C) SnO2/KB = 45/55, and (d) pure KB (UC-treated KB, denoted as UC-KB). [Bottom] Relationship between the specific surface area (SSA) per SnO2/KB composite mass and the SnO2 content (0 to 75 wt%, 8 samples). In the figure, samples (a)-(c) correspond to the samples shown in Fig. 2-3(A)-(C), respectively. The SSA of the composites linearly decreases with a SnO2 dosage increase from 0 wt% (UC-KB) up to 67 wt%, while the SSA slightly increases from 67 to 75 wt%. The slight increase of the SSA from 67 wt% can be due to the SnO2 nanoparticles piled on the outer sphere of KB (see Fig. 2-3(A)). Namely, the 8 samples can be divided into 2 groups; one is the high-dispersion composites with highly dispersed SnO2 nanoparticles confined within the hollow structure of KB when the SnO2 dosage is less than 67 wt%, and the other is the outer-deposition composites with the exposed SnO2 nanoparticles outside of KB sphere when the SnO2 dosage exceeds 67 wt%.
2.3.5. Microscopy after charge/discharge test
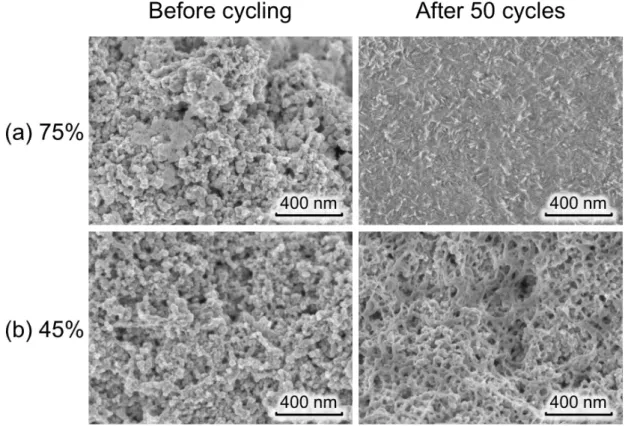
Figure 2-7. SEM images of the surface of SnO2/KB composite electrodes with SnO2 = (a) 75 and (b) 45 wt% before and after 50 cycles. These images (a) and (b) before cycling correspond to the electrode surface for Fig. 2-4(A) and (C), respectively. As shown in (a) 75 wt% after 50 cycles (top right), the polymeric mixture (possibly consisting of SEI and Li2O) uniformly covered the electrode surface and filled the pore of the composites, while the surface morphology of (b) 45 wt% more or less unchanged (down right).
The sample with the 45 wt% dosage after 50 cycles maintains the fine structure of the
pristine composite with a network structure containing a SEI (solid electrolyte interphase),
suggesting that the reversible electrochemical reaction of SnO2 nanoparticles occurs within the
KB sphere. On the other hand, structural changes are apparent for the sample with the 75 wt%
dosage, from the pristine composite to form a more uniform structure whose pores are
completely filled and electrode surface are totally covered by polymeric mixture. The polymeric
mixture is supposed to consist of the SEI and the SnO2-derived products (Sn and Li2O). The
complete covering of the composite surface by such a resistive products immediately increased
the internal resistance of the system, resulting in the short cycle life with a drastic capacity
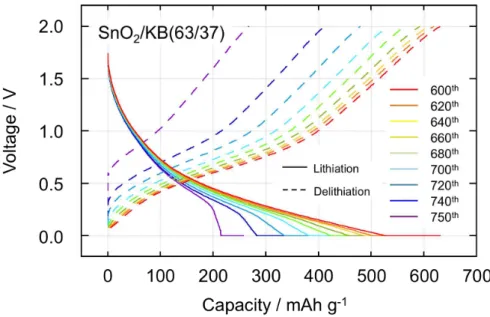
dosage of 45 wt%), the total encapsulation of SnO2 within the KB sphere keeps the SnO2 nanoparticles from the agglomeration, as the hollow structure of KB provides some space to buffer the volume change of SnO2 nanoparticles. Furthermore, the good contact between SnO2 nanoparticles and the microcrystalline graphite of KB ensure the good electrical path as a composite. All of these factors enhance the cyclability of the SnO2/KB (45/55). One interesting point is the electrochemical behavior of the SnO2/KB (63/37) composite (Fig. 2-4B), showing its stable cyclability until 600th cycle but sharp capacity decrease afterwards. Comparison of charge discharge curves for SnO2/KB (63/37) in the range of 600th and 750th (see Fig. 2-8) highlights two exponential changes within the 150 cycles; i) disappearance of the capacity at the voltage lower than 0.4 V during lithiation process, and ii) increase of internal resistance (IR) drops at the beginning of delithiation. Both phenomena suggest that the electrochemical reaction below 0.4 V including Sn alloying, lithiation of KB, and SEI formation, became largely resistive after 600th cycle.
Figure 2-8. Charge-discharge curves for the SnO2/KB (63/37) in the range of 600
th and 750th cycle. The cycle tests of SnO2/KB (63/37) are plotted in Fig. 2-4(B). The cycling test was performed on half cells consisting of Li/1 M LiPF6 in EC+DEC/(SnO2/KB = 63/37) in the CC-CV (lithiation) and CC (delithiation) mode between 0.0 and 2.0 V at a current density of 300 mA g-1. From these curves, one can see two changes occurring within the 150 cycles; i) disappearance of the capacity at the voltage lower
than 0.4 V during lithiation process, and ii) increase of internal resistance (IR) drops at the beginning of
delithiation. Both phenomena suggest that the electrochemical reaction below 0.4 V including Sn alloying,
Such a sudden increase of resistance can be explained by the structure of SnO2/KB (63/37)
composite. As shown in HRTEM observation (Fig. 2-3B) shows that some of SnO2
nanoparticles are exposed and attached directly on the outer spheres of the KB. These several “outer” SnO2 nanoparticles can reversibly react owing to the good contact on the conductive KB
carbon, even though the SEI and Li2O gradually accumulates around the “outer” particles. After
certain cycle time such as 600 cycles, however, these locally accumulated products start to link each other and to cover the whole entity of KB spheres including encapsulated SnO2. The totally
covered SnO2/KB spheres lost the connection from the conductive carbon network, resulting in
a large increase of resistivity and sharp capacity decrease. This result also demonstrates the importance of the optimized encapsulation of SnO2 in the hollow KB structure, achieved by the
SnO2 dosage of 45 wt% in this report, to accomplish an anomalous long cycle life over 1,200
cycles. The other interesting phenomenon shown in Fig. 2-4(C) is the gradual capacity rise during cycling by ca. 1 mAh g-1 (composite) per each 10 cycles, which is rarely observed in
electrodes made of intercalation compounds such as LiCoO2, LiMn2O4, and Li4Ti5O12. However,
there are many reports of capacity rises in the conversion reactions of metal oxide anode materials such as Fe2O3, Cu2O, and MnO2.
57-59
2.3.6. Voltammetry and Cycleability
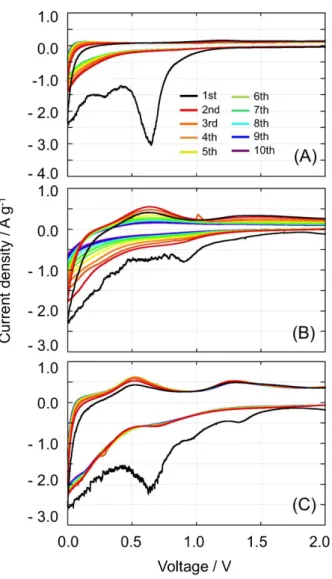
Figure 2-9. Cyclic voltammograms for the (A) pure KB (UC-treated KB (UC-KB)), (B) SnO2/KB = 75/25, and (C) SnO2/KB = 45/55.
The cyclic voltammetry test was performed on laminate-type cells consisting of Li/1 M LiPF6 (EC+DEC)/UC-SnO2/KB (or UC-KB)
in the voltage range of 0.0–2.0 V at a scan rate of 0.2 mV s−1.
For the UC-KB (Fig. 2-9(A)), a strong cathodic peak was observed around 0.7 V during the
first lithiation process, which corresponds to the formation of the SEI layer on the external
surface of the KB.Thefollowing peaks observed at 0.3, 0.1, and 0.0 V correspond to the SEI
formation as well as the Li+ intercalation between the graphene layers of KB.60,61 For the
SnO2/KB composites with 75 wt% and 45 wt% dosages (see Fig. 2-9(B) and (C)), there are
characteristic cathodic peaks at 0.9, 0.7, and 0.0 V, corresponding to the conversion reaction of
SnO2, SEI layer formation on KB, and the alloying reaction of Sn (xLi+ + Sn + xe-→ LixSn (x =
0-4.4)) and Li+ intercalation into KB graphene layers, respectively. During the anodic sweep
(delithiation process), two peaks were observed around 0.5 and 1.3 V. The peak at 0.5 V
represents the dealloying of LixSn (x = 0-4.4).
14 The other oxidation peak around 1.3 V can be
mentioning that the conversion reaction of SnO2 becomes reversible in the case of small
particles.23,41 Although these phenomena are not fully elucidated yet, Tarascon et. al. suggested
that the key to the reversibility of the conversion of transition metal oxides or other metal oxides with Li+ is the electrochemically driven formation of highly reactive metallic nanoparticles during the first lithiation process, which enables the reversible formation/decomposition of Li2O
upon subsequent cycles.62 The reversible oxidation peak around 1.3 V observed for our
composites supports those reports. Compared to the sample with the 45 wt% dosage, the sample with the 75 wt% dosage exhibits different CV results (see Fig. 2-9(B)). During the 1st cycle, the
voltages of the main peaks observed for the sample with the 75 wt% dosage are more or less the same as those observed for the 45 wt% dosage, while the contribution of peaks attributed to the KB became less pronounced. From the second cycle, the electrode with the 75 wt% dosage shows significant deterioration in its cyclic voltammogram, which is in very good agreement with the results of the cycling tests (see Fig. 2-4(A)).
2.3.7. Quantify the degree of Reversibility of the SnO2 Conversion reaction
An optimized SnO2/KB (45/55) composite exhibited a reversible discharge capacity at a
steady-state cycling. For example, at 10th cycle, the 45 wt% dosage composite showed 792 mAh g-1 relative to the mass of the composite, which is equivalent to 1347 mAh g-1 relative to the mass of the SnO2. Such a large capacity is very close to the theoretical capacity of SnO2
including both the alloying and conversion process (1494 mAh g-1), rather than the alloying
process alone (783 mAh g-1). However, it remains unclear whether the conversion reaction
really becomes reversible. In order to answer this question, we tried to quantify the degree of reversibility of the SnO2 conversion reaction for our composites by determining the number of
Conversion reaction : SnO1.41 + 2.82 Li +
+ 2.82 e- Sn + 1.41Li2O (1-2 V)
Alloying reaction : Sn + 4.76 Li+ + 4.76 e
Li4.76Sn (0-1 V)
Total reaction : SnO1.41 + 7.58 Li+ + 7.58 e- Li7.58SnO1.41 (0-2 V)
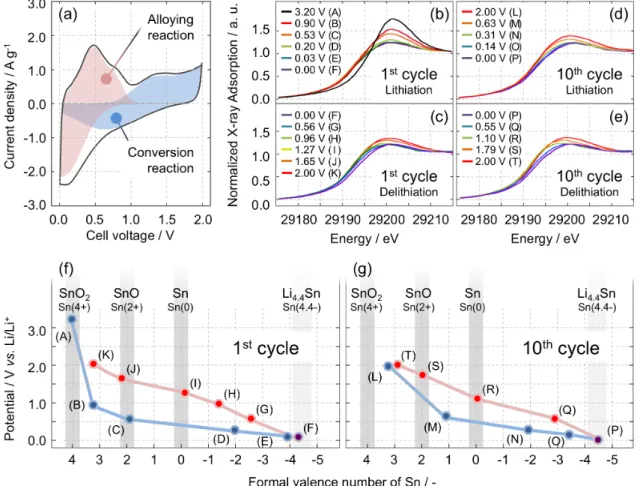
Figure 2-10. Top: (a) Cyclic voltammogram of SnO2/KB composite after 10 cycles and (b)-(e)
normalized Sn K-edge XANES absorption spectra in the range of 29185–29215 eV for the LixSnO2
system with electrochemically inserted/deinserted lithium ions during 1st and 10th cycle. Spectra (b)
corresponds to the1st lithiation, (c) to the 1st delithiation, (d) to the 10th lithiation, and (e) to the 10th
delithiation process. Bottom: Changes in the evaluated “formal valence number” of Sn during the lithiation-delithiation process (vs. Li/Li+) for the (f) 1st cycle and (g) 10th cycle. The formal valence
number of Sn for the composites was calculated from the following equations; in the case of 1) the formal valence number is above Sn, V = ((A – A(Sn))/(A(SnO2) – A(Sn))*V(SnO2), 2) the formal valence
number is below Sn, V= ((A(Sn)-A)/(A(Sn)-A(Li4.4Sn))*V(Li4.4Sn). V: the formal valence number , A:
2.3.8. In-situ X-ray absorption fine structure measurement
Furthermore, in order to verify the postulated formula from the spectroscopic measurements, the electronic state and local structure of Sn was investigated by performing in-situ X-ray absorption fine structure (XAFS) measurements during the 1st and 10th cycles. Fig. 2-4b-e shows the X-ray absorption near-edge structure (XANES) spectra of the Sn K-edge for the SnO2/KB(45/55) composites during the 1
st lithiation (Fig. 2-10b) and delithiation (Fig. 2-10c).
The Sn K-edge spectra include information about the transition from 1s to the 5p unoccupied orbital. During the lithiation and delithiation of Sn compounds, the electron transfer occurs to and from the 5p orbital. Accordingly, the integrated area of the Sn K-edge spectrum shows the numbers of electrons, i.e., the valence state, of the Sn atoms in its compounds. In this article, the parameter for determining the valence state is defined as the “formal valence number”, which is calculated from the relative ratio of the integrated area of the Sn K-edge spectrum obtained for our composite and for reference materials (SnO2, Sn, and Li4.4Sn). For example, the formal
valence number of Li4.4Sn is written as 4.4-. The Sn K-edge spectra of SnO2 and Sn foil are used
as references for Sn(4+) and Sn(0), respectively. Fig. 2-10f shows the formal valence number of Sn in the 1st cycle. During the lithiation process from potentials (A) to (F), the valence state decreased from (4.0+) to (4.3-). The valence state reaches zero around 0.5 V and continues to decrease to -4.3 from 0.5 down to 0 V. The negative value of the Sn valence state indicates that the electron density of Sn atoms exceeds the inherent Sn electron density because of the alloying reaction between lithium and tin metal. During the 1st delithiation, the valence state
linearly increases as a function of the voltage (from (F) to (K)). Such a valence change with a large hysteresis between lithiation and delithiation process is analogous to the shape of the charge-discharge curve of uc-SnO2/KB (45:55) as shown in the inset of Fig. 2-4. The large
hysteresis between 1st lithiation and delithiation can be due to the large electromotive force to decompose Li2O
63
and the large difference in mobility that is expected between Sn cations and Li+ 64. Eventually, the formal valence number of Sn reaches 3.1+ at 2.0 V (K). This indicates
that the Sn in this composite did not completely recover to its initial state (4.0+) during the conversion reaction in the 1st cycle. Fig. 2-10d and e show the changes in the Sn K-edge
XANES spectra of the 45 wt%-dosage composite during the 10th cycle. Fig. 2-10g shows the
can be seen that the formal valence number of Sn recovers almost perfectly during the 10th
lithiation-delithiation cycle, as the valence decreases from 3.2+ (L) to 4.4- (P) and then recovers
to 2.9+ (T). To summarize the results of the XANES spectra at 10th cycle, the reaction formula
can be written as follows.
Conversion reaction : SnO1.45 + 2.9 Li+ + 2.9 e- Sn + 1.45Li2O Alloying reaction : Sn + 4.4 Li+ + 4.4 e
Li4.4Sn Total reaction : SnO1.45 + 7.3 Li
+ + 7.3 e
Li7.3SnO1.45
The electron numbers obtained from the cyclic voltammetry and in-situ XAFS measurements
are in very good agreement for all three reactions (conversion, alloying, and total reactions).
Thus, the reversibility of the conversion reaction for our SnO2/KB composite was verified by
both electrochemical and spectroscopic studies.
2.3.9. Microscopy of bulk SnO2 electrode after charge/discharge test
Fig. 2-11 shows HRTEM images of the as-prepared SnO2/KB (45/55) composite (a), the
composite at 2.0 V (delithiated) after 10 cycles (b), and the composite at 0.0 V (lithiated) after
10 cycles (c). Before cycling, one can clearly see that the nanosized SnO2 particles of 2-4 nm
are attached onto the surface of KB, mostly on its inner spheres (Fig. 2-10a). After 10 cycles,
the overall morphology of the composite changed. The HRTEM image taken at 2.0 V after the
10th cycle (Fig. 2-10b) shows two phases in the composites: a transparent uniform phase and a
Figure 2-11. HRTEM images of SnO2/KB = 45/55 composite (a) before cycling, (b) after 10 cycles at 2.0
V (delithiated), and (c) after 10 cycles at 0.0 V (lithiated). Before cycling, ultrafine (2-4 nm) SnO2
particles are encapsulated within the hollow structure of KB. After cycling at 2.0 V and 0.0 V, the
HRTEM images show 5 nm spherical shapes covered with a diffuse polymeric phase, possibly an SEI
film. The corresponding SAED patterns of the SnO2/KB composite before cycling, at 2.0 V, and at 0.0 V
are shown as insets in (a), (b), and (c), respectively.
The former is thought to consist of the SEI layer and the lithium-intercalated graphene
layers of KB. The latter can be the particles of Sn spiecies, which mostly have diameters of 5
nm and are well attached to the inner sphere of the KB. Since the HRTEM images of the
as-prepared composite show SnO2 particles with a diameter of 3 nm (Fig. 2-11a), the spherical
particle volume has increased by a factor of three after 10 cycles. The disappearance of the
crystal lattice in the HRTEM images and the ring in the electron diffraction images (Fig. 2-11b
inset) suggest that all the crystalline SnO2 particles have become amorphous. Interestingly, the
HRTEM images taken at 0.0 V after 10 cycles (Fig. 2-11c) show that the SnO2 particle size (5
nm) remains unchanged during the lithiation process in the 10th cycle, even though the alloying
and conversion reaction occurs from 2.0 to 0.0 V. In contrast, large SnO2 particles (for example,
with a diameter of 100 nm) deteriorate from the 1st cycle and are transformed into 10 nm Sn
particles dispersed within the large volume of Li2O during its conversion and alloying reaction
Figure 2-12. Lithiation profile curve (top left) and HRTEM images showing morphology changes of the
bulk SnO2 particles (purchased from Showa Kako Corp., 50-100 nm of the particle size) at different states
of lithiation (A) 50 mAh g-1, (B) 300 mAh g-1, (C) 600 mAh g-1, (D) 900 mAh g-1, (E) 1200 mAh g-1.
Tested electrodes were composed of SnO2 (90 wt%) and PVDF (10 wt%) without any conductive carbons.
The electrochemical performance was performed on 2032 coin-type half cells consisting of Li/1 M LiPF6
in EC+DEC/SnO2 at a current density of 300 mAh g
-1. In the course of lithiation, the bulk SnO
2 particles
are pulverized into small Sn particles. Each particle is surrounded by a large amount of polymeric mixture
of SEI and Li2O, thus isolated from other particles.
2.3.10. Composite structure model of SnO2/KB composite during charge discharge test
Figure 2-13. Illustration of the material transformation from the as-prepared SnO2/KB nanocomposites
into the blended amorphous structure “LixSnO1.45 (x = 0-7.3)” after repeated lithiation and delithiation
processes, typically 10 cycles. The proposed new species “LixSnO1.45 (x = 0-7.3)” is still well-confined
within the hollow structure of KB which are filled and covered by polymeric phases (possibly SEI). The
steady-state redox is maintained over 1,200 cycles with a slight increase of capacity (1 mAh g-1 per 10
cycles).
Such a peculiar reaction can avoid the thermodynamic barrier of Li2O and provide reverse
and smooth lithiation and delithiation of Sn species. Thus, this speculated LixSnO1.45, which is
highly dispersed in the KB matrix, could facilitate the reversible alloying and conversion
reactions without its deterioration even after 1,200 cycles.
Our last question is about the structure of this blended amorphous structure (LixSnO1.45). As
shown in the insets of Fig. 2-11b and c, the electron diffraction observation of the SnO2/KB
(45/55) after 10 cycles confirms that this sphere does not have a long-range ordered structure (>
1 nm). In order to investigate the short-range order of the average local coordination
environment around the Sn atom within a diameter of 4 Å, I performed extended X-ray
absorption fine structure (EXAFS) analysis using the results of the in-situ XAFS measurement.
The spectra obtained for the as-prepared composites at the open-circuit voltage (OCV; Fig.
2-14a (A)) shows a strong peak at 1.6 Å derived from Sn-O bonding, which corresponds well
Figure 2-14. Fourier transforms of the k3-weighted Sn K-edge EXAFS spectra taken during the charge
cycle as a function of the voltage for the (a) 1st
lithiation and delithiation, and (b) 10th
lithiation and
delithiation processes. The Fourier transform range is 2.05-11.1 Å-1 .
As the voltage decreases, this peak at 1.6 Å decreases and finally disappears at 0.0 V. In
addition, it is confirmed that a new weak peak due to Sn-Sn bonding appeared around 2.7 Å at
0.2 V, and this peak also disappeared at 0.0 V (F). Then, as the voltage increases between 0.0 V
(F) and 2.0 V (L), the Sn metal peak (2.7 Å) and SnO2 peak (1.6 Å) reappear at 0.3 V and 0.8 V,
10th cycle (Fig. 2-14b), indicating the reversible rearrangement of the short-range structure of
LixSnO1.45. These results suggest that the LixSnO1.45 possesses an amorphous structure in terms
of long-range order (> 1 nm), but a relatively ordered short-range structure (< 4 Å). This short-range structure can be rearranged owing to the reversible exchange of the oxygen atoms between Sn and Li, resulting in the repeated disappearance and reappearance of the two peaks (Sn-O and Sn-Sn) with the voltage changes.
2.4. Summary
I successfully prepared a novel UC-treated SnO2/KB composite that readily transforms into
a blended amorphous structure composed of LixSnO1.45 (x = 0-7.3) completely encapsulated
within the hollow-structured KB. The SnO2/KB composite with the optimized SnO2 dosage of
45 wt% exhibits a high reversible capacity of 837 mAh g-1 relative to the composite mass (1444
mAh g-1 relative to SnO
2 mass after subtracting the capacity attributed to the KB in the
composite) over 1,200 cycles. Such an anomalous cycle life was achieved owing to a peculiar nanostructure that enables the existence of the multiple phases of Sn, Li, O, and C (KB) species. This novel multiphase material is a model case of SnO2 to overcome conversion essentials, i.e.,
reversible conversion reactions can be achieved by the complete encapsulation of SnO2.
References
1. M. Armand and J. M. Tarascon, Nature, 2008, 451, 652-657.
2. M. Yoshio, H. Wang, K. Fukuda, Y. Hara and Y. Adachi, J. Electrochem. Soc., 2000, 147, 1245-1250.
3. L. Zeng, C. Zheng, J. Xi, H. Fei and M. Wei, Carbon, 2013, 62, 382-388. 4. Y. Liu, X. Zhao, F. Li and D. Xia, Electrochim. Acta, 2011, 56, 6448-6452.
5. D. Yonekura, E. Iwama, N. Ota, M. Muramatsu, M. Saito, Y. Orikasa, W. Naoi and K. Naoi,
Phys. Chem. Phys. Chem., 2014, 16, 6027-6032.
6. M. F. Hassan, Z. Guo, Z. Chen and H. Liu, Mater. Res. Bull., 2011, 46, 858-864.