T his doc ument is downloaded at: 2018-03-23T 18:11:02Z
T itle
A longitudinal, cross-sectional study of diversity in maternal platelet count
kinetics, related to gestational thrombocytopenia
A uthor(s )
K otera, K ohei; K amihira, S himeru; K erckhove, C harles de; K anematsu,
T akashi; Matsuda, K azuyuki; Miura, K iyonori; Hasegawa, Hiroo;
Masuzaki, Hideaki
C itation
A cta medica Nagasakiensia, 61(3), pp.117-126; 2018
Is s ue D ate
2018-01
UR L
http://hdl.handle.net/10069/37960
R ig ht
NA O S IT E : Nag as aki Univers ity's A c ademic O utput S IT E
Acta Med. Nagasaki 61: 117−126
Introduction
Gestational thrombocytopenia (GT, also Incidental throm-bocytopenia) is detected in approximately 8% of healthy pregnant women and in more than 70% of pregnancy-associated
thrombocytopenia cases 1. Practically speaking, GT in an otherwise well woman at term has been described as posing no apparent risk for mother or infant at delivery 2, though anesthesia restrictions may apply depending on differing cut-offs of 10 versus 5 x 10⁴/µL1; for most cases close observation
MS#AMN 07194
A longitudinal, cross-sectional study of diversity in maternal platelet count
kinetics, related to gestational thrombocytopenia
Kohei Kotera 1, 2), Shimeru Kamihira 2), Charles de KercKhove 2), Takashi Kanematsu 2), Kazuyuki matsuda 2),
Kiyonori miura 3), Hiroo hasegawa 4), Hideaki masuzaKi 3)
1 Nagasaki Harbor Medical Center, Department of Obstetrics and Gynecology, 6-39 Shinchi, Nagasaki City, Nagasaki Prefecture, Japan, 850-8555 2 Nagasaki Harbor Medical Center, Research Unit and Central Diagnostics, 6-39 Shinchi, Nagasaki City, Nagasaki Prefecture, Japan, 850-8555 3 Nagasaki University, Graduate School of Biomedical Sciences, Department of Obstetrics and Gynecology, 1-7-1 Sakamoto, Nagasaki City,
Nagasaki Prefecture, Japan, 852-8501
4 Nagasaki University, Graduate School of Biomedical Sciences, Department of Laboratory Medicine,1-7-1 Sakamoto, Nagasaki City,
Nagasaki Prefecture, Japan, 852-8501
Background: Gestational thrombocytopenia (GT) is detected in approximately 8% of healthy pregnant women and >70% of pregnancy-associated thrombocytopenia cases. Diagnosed by exclusion, GT is primarily a benign disorder of unclear pathogenesis, although mechanisms have been proposed such as hemodilution. To better understand GT, we conducted retrospective longitudinal and cross-sectional analyses of variations in platelet count (PC) during gestation period.
Methods: PC kinetics was assessed across a test group of 100 pregnant women, accurately representative of 341 in total, and in a control group of 200 non-pregnant women.
Results: In the test group, median PC was comparable to the control group in early gestation but decreased by 8% by delivery day (DD). PC decreased by >5% in 59 pregnancies and increased by >5% in 19. 12 cases were thrombocytopenic. Median PC
luctuation, 2.5th percentile, and 97.5th percentile were each most extreme in inal 5 weeks. Longitudinal analysis established ive
gestational pattern types deined by curvature and Change Ratio. The GT-type pattern (8 cases) showed relatively low PC in
early gestation, mild downwards slope in the 2nd trimester, one or more peaks or “lifts” in the inal weeks, followed by a “V-shape”
of decrease beyond 15 x 104/μL to DD and sharp post-partum increase. Some of the GT-associated characteristics above appeared identiiable in a majority of pregnancies regardless of absolute PC value: Distinct PC “lift” occurring within the inal ten weeks [later than in GT cases] followed by the V-shape [decrease to DD less pronounced than in GT], suggesting that diverse
PC kinetics relate to the placental cytokine and receptor system.
Conclusion: Our novel identiication of diverse kinetic patterns in platelet count over gestational period suggests that, instead of
a universal decrease caused by hemodilution alone, homeostatic conditions are affected by a diversity of varying factors such as the placental thrombopoietic system.
ACTA MEDICA NAGASAKIENSIA 61: 117−126, 2017
Key words: platelet count, intra-individual variation, gestation, thrombocytopenia.
Address correspondence: Kotera K; kotera [email protected]
118 Kohei Kotera et al.: The Individual Variation of Platelet Counts in Gestation
appears sufficient. As there is no diagnostic marker, the practical status of GT depends on diagnosis by exclusion. Whereas the challenge of definitively differentiating Idiopathic Throm-bocytopenic Purpura (ITP) from GT in otherwise healthy thrombocytopenic pregnant women has been investigated through direct comparison 3 or through ITP predictors 4, the etiology of GT remains unclear. The reason for the physiologic decline in platelet count (PC) or “leftward shift” in PC distri-bution associated with normal pregnancy overall is unknown; however, several mechanisms have been proposed such as hemodilution, decreased platelet production, or increased platelet turnover during pregnancy 5, 6. Recently, new concepts on platelet homeostasis during pregnancy have been defined throughout studies on pregnancy-specific regulatory factors 7.
We have conducted a study on the diversity of maternal platelet count variation with focus on identifying GT-type etiology. In conducting a longitudinal and cross-sectional study of gestational PC kinetics, our main interests were 1) the extent of intra- and inter-PC variation across a wide range of individual pregnancies, 2) similarities and differences between GT-type cases and non-GT-type cases by this measure, and 3) any possible relationship between factors affecting PC variation and the placental thrombopoetic system.
Materials and Methods
Subjects: The platelet count (PC) data in our study were from samples taken from 341 women who delivered within one year from Jan 2012 to Jan 2013. The mean age was 30.9+/-6.5 years old. The control group consisted of 200 female city employees. PC was calculated using a Sysmex Auto-analyzer (Sysmex, Kobe, Japan).
For our cross-sectional and longitudinal analysis, the following criteria were applied for admissible test subjects: 1) At least 20 weeksʼ worth of gestation data, 2) At least 4 measurements per subject, and 3) No deviation greater than ±0.1 weeks for DD measurement. While these criteria reduced the number of admissible subjects from 341 to 100, metrics such as PC percentiles across gestation or various distributions of interest were the same between the two groups. Longitudinal gestational plots were created for each of the 100 test subjects. Given the apparent effect of gestation progression on PC variation, we were interested in how gestational thrombocytopenia (GT) cases might relate to PC kinetics. Accordingly, we evaluated the changes in median PC at 10 points in time along gestation for observation by longitudinal method.
The key metric of Change Ratio was determined as follows: [(PC on 1st Visit - PC on Delivery Day) / (PC on 1st Visit Date)*
100%]. A negative Change Ratio was termed “Reduction Rate” and a positive Change Ratio an “Increase Rate”.
Our studyʼs definition of GT included the following criteria: 1) No previous conditions such as ITP and SLE, 2) 1st PC value within normal range, 3) Substantial platelet count decrease during pregnancy for unknown causes, and 4) A PC level that falls below approximately 15 x 104/µL and that returns to normal after delivery. We adhered to a common classification whereby a mild thrombocytopenic range is 15-10 x 104/µL and a moderate one is 10-5 x 10⁴/µL 8. Regarding the severe range of <5 x 10⁴/µL, which would include our source dataʼs minimum value of 3 x 10⁴/µL, PCs of <8 x 10⁴/µL or of <7 x 10⁴/µL have been denoted as triggers to investigate alternative etiologies such that a GT diagnosis for <5 x 10⁴/µL is considered unlikely 9,10. Additionally, GT has been reported as “asymptomatic with platelet counts rarely <7 x 10⁴/µL” in contrast to which patients with a count from 3 to 5 x 10⁴/µL rarely present with purpura although may have excessive bleeding with traumaxi, in other words, the severe thrombocytopenic range does not appear applicable to an incidental etiology.
The statistical analysis was performed using StatFx (StatFlex; Artech, Osaka, Japan), which included evaluations such as the Chi-squared test and the Mann Whitney U test. On the understanding of no possibility of any subjects being identifiable, our hospitalʼs ethics and privacy committees voiced no objections to this study.
Results
1. Cross-sectional analysis at specific points in gestation time
First, peripheral blood platelet counts (PC) were compared between the test group and the control group. Table 1 showed little difference in PC between the two groups at least during early pregnancy [median of 24.0 x 10⁴/µL for the control group vs. 22.1 x 10⁴/µL for test group 1st Visit]. However, DD data showed a higher reference range, lower median [20.5 x 10⁴/µL], and substantially lower 2.5th percentile than both control group and the 1st Visit data, suggesting high inter-case PC variation during mature pregnancy. The reference ranges for the test group were particularly high at -3W (3 weeks before DD) and at -1W. This was because the 2.5th percentiles were both substantially lower than at any time in gestation prior to -3W, and because the 97.5th percentiles were both higher than at any other time in gestation. Such results further suggest that the extent of PC variation differs at specific points in time: the final weeks in particular.
119
Kohei Kotera et al.: The Individual Variation of Platelet Counts in Gestation
-10W. As of the -5W mark however there was notable change as dot-plot distributions began to widen substantially and, in particular, a number of data points clearly dropped into the area below 15 x 104/µL. Consistent with the above discussion,
Figure 1 illustrates sudden dilation in reference range and a decrease trend in median PC both as of -3W, and it additionally suggests rapid fluctuations in PC kinetics in the final weeks as reflected in median PC.
Table 1. Comparison of Platelet Counts (PC) between Test Group of Pregnant Women at various points of gestation and Control Group of Non-Pregnant Women
Number of
women Median PC
PC at 97.5th percentile
PC at 2.5th percentile
Reference Range
(PC at 97.5th percentile - PC at 2.5th percentile)
Control Group
(Non-pregnant women) 200 24.0 37.7 17.3 20.4
Test Group
(Pregnant women), time of PC measurement
100
1st visit of gestation 22.1 34.2 15.0 19.2
30 weeks before DD 22.8 31.2 15.0 16.2
25 weeks before DD 21.9 34.9 15.1 19.9
20 weeks before DD 24.8 31.6 15.9 15.7
15 weeks before DD 24.7 30.5 18.9 11.6
10 weeks before DD 22.8 35.6 15.2 20.4
5 weeks before DD 22.4 32.9 13.5 19.4
3 weeks before DD 24.1 37.6 10.8 26.8
2 weeks before DD 19.7 35.3 10.1 25.2
1 week before DD 22.4 38.2 11.6 26.6
Delivery Day 20.5 33.2 10.7 22.5
5 10 15 20 25 30 35 40 45 50
-35w -30w -25w -20w -15w -10w -5w 0w
Pl
at
el
et
Co
un
t,
tim
es
1
0
4pe
r m
icr
ol
itr
e
Weeks before Delivery Day [x = 0 represents Delivery Day]
97.5thpercentile
2.5thpercentile Median
Figure 1: Twin dot-plot graph combining cross-sectional and longitudinal data of PC (Platelet Count) in 100 pregnant women
over gestation time, showing distribution in PC values from 1st Visit of pregnancy to Delivery Day. Locations of 97.5th percentile,
120 Kohei Kotera et al.: The Individual Variation of Platelet Counts in Gestation
To understand the extent of change within individual pregnancies, Figure 2A displays change in absolute PC ordered from highest to lowest 1st Visit PC, and Figure 2B displays the full range of change ratios from highest reduction rate to highest increase rate. Leaving aside change within
±5%, PC was shown to decrease in 59% of pregnancies overall by as high as 60% in value and to increase in 19% of
pregnancies overall by as high as 49% in value. However as GT necessarily indicates a PC decrease trend beyond the cutoff of 15 x 104/µL, such that both a high reduction rate and a low initial PC would appear to be necessary conditions, our next interest was to group individual pregnancies together on the basis of similar graphical characteristics and quantifiable metrics.
1 5 10 15 20 25 30 35 40 45 50
0 10 20 30 40 50 60 70 80 90 100
Pl
at
el
et
Co
un
t,
tim
es
1
0
4pe
r m
icr
ol
itr
e
Cases
Figure 2A: Total change in absolute Platelet Count value across entire test group (n = 100). Each pregnant womanʼs 1st
Visit
PC is represented by a blue bar at left next to her Delivery Day PC by a red bar at its right. Ordered from highest 1st Visit PC to
lowest 1st
Visit PC, red bars “protruding” represent net PC increase and white spaces “intruding” represent net PC decrease.
-60% -40% -20% 0% 20% 40% 60%
0 20 40 60 80 100
Ch
an
ge
R
ati
os
(%
)
Cases Change Ratio Distribution
Exceeding -20% 24 cases (blue at far left) -20% to -5% 35 cases (red)
-5% to 5% 22 cases (green) 5%to 20% 11 cases (purple) Exceeding 20% 8 cases (blue at far right)
Figure 2B: Full range of Platelet Count (PC) Change Ratios across entire test group (n = 100). Change Ratio is calculated by the following formula:
[(PC at Delivery Day ⊖ PC at 1st Visit)/(PC at 1st Visit) x 100%]. Negative Change Ratios are “Reduction Rates”, and Positive
121
Kohei Kotera et al.: The Individual Variation of Platelet Counts in Gestation
2. Diversity of PC Kinetics in Five Identified Categories
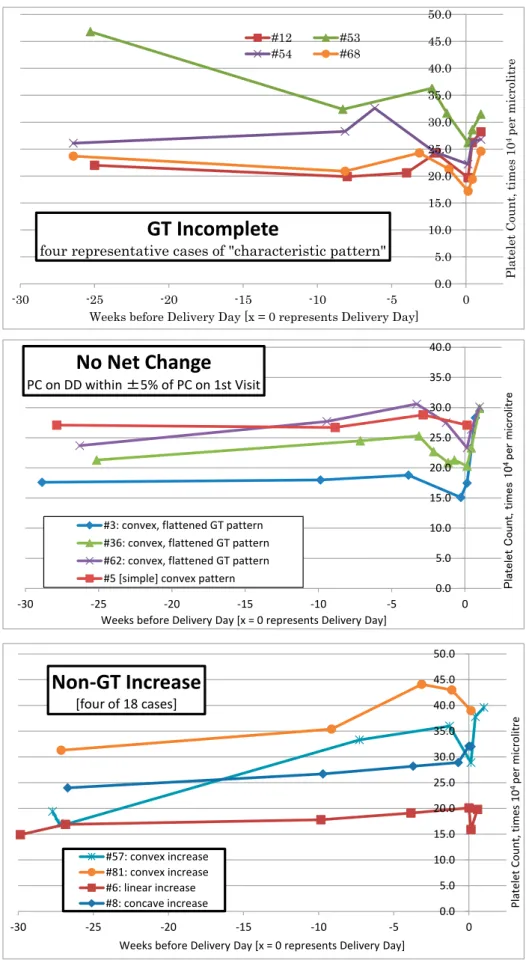
By selecting representative cases ranging from 4 to 24 sequential PC data points starting from approximately -30Ws, PC kinetics could be observed in five distinct categories defined by curvature, Change Ratio, and relationship to thrombocytopenic range (grouped together in Figure 3, separated individually in Figure 4, and listed by distinguishing characteristics in Table 2). Among the various pattern types, 8 out of 100 cases exhibiting PC decrease reflective of GT pathology were designated as “GT Complete type”. The GT Complete type was characterized by relatively low PC at -30Ws, mild downwards slope between -30Ws to -10Ws, one or more distinct peaks or lifts in PC as of approximately -10W, followed by a steep decrease beyond the 15 x 104/µL threshold forming a V-shaped figure after post-partum recovery. While an additional 4 out of 100 cases were also thrombocytopenic, they differed both from the above 8 cases and from at least one condition of our GT definition by exhibiting 1) PC levels at or below 15 x 104/µL even in early gestation and 2) Comparatively little to no slope until after DD: these were classified as “Low Level PC across Gestation”.
The “GT Incomplete type” was defined only in terms of a
Reduction Rate exceeding 5% and a DD value above 15 x 104/µL, yet the majority of the 48 longitudinal PC plots within this numerical range resembled at least to some extent a GT pattern that had been compressed and translated upwards,
with a single elevation peak shifted to approximately -3W. Even for the 22 cases within the “No Net Change” category, defined for a change ratio within ±5%, the most prevalent subcategory included the frequently encountered elevation occurring within the last ten weeks at around -3W, followed by the same PC V-shape of sharp decrease before DD and sharp increase post-partum. The remaining 18 of the 100 cases were defined by a PC increase of more than +5% and were termed “Non-GT Increase”. Yet even within this category of high to very high GT, the same pattern of distinct peak within last ten weeks followed by V-shape was still identifiable in the most prevalent subcategory, the “Non-GT Increase Convex”
(9 cases). Two key characteristics by which the “Non-GT
Convex Increase” curve differed from the GT-type pattern
included 1) Slow increasing slope towards PC elevation instead of slow decreasing slope and 2) PC elevation tending to occur far later within the final ten weeks. A visual comparison between the 5 categories, as represented in Figure 3 by a typical curve of the most prevalent subcategory within each, suggests a gestational reaction common to many pregnancies that in GT-type cases happens to occur earlier and over a wider range. Such a gestational reaction of final weeks seems consistent with the fluctuation and variability observed in Table 1 and Figure 1. The occurrence of more than one PC peak fluctuation or “lift” seemed more likely in GT-complete type cases than in the other categories. Incidentally, there was no relationship 1st PC value and age of mothers. The
0.0 5.0 10.0 15.0 20.0 25.0 30.0 35.0 40.0 45.0
-30 -25 -20 -15 -10 -5 0
Pl
at
el
et
C
ou
nt
, t
im
es
1
0
4pe
r m
icr
ol
itr
e
Weeks before Delivery Day [x = 0 represents Delivery Day]
GT Complete
Low Level Across Gestation GT Incomplete
No Net Change Non-GT Increase
122 Figure 4 (1st page of 2). 5 Identified Categories of Platelet Count Kinetics during Gestation Kohei Kotera et al.: The Individual Variation of Platelet Counts in Gestation
0.0 5.0 10.0 15.0 20.0 25.0 30.0 35.0 40.0
-30 -25 -20 -15 -10 -5 0
Pla
te
let
C
ou
nt
, t
im
es
1
0
4pe
r
m
ic
ro
lit
re
Weeks before Delivery Day [x = 0 represents Delivery Day]
GT Complete
- first four of 8 cases#10 #20
#35* #44* * represents twin-related GT
Numbers in legend represent Subject ID.
0.0 5.0 10.0 15.0 20.0 25.0 30.0 35.0 40.0
-30 -25 -20 -15 -10 -5 0
Pla
te
le
t
C
ou
nt
, t
im
es
1
0
4pe
r
m
ic
ro
lit
re
Weeks before Delivery Day [x = 0 represents Delivery Day]
GT Complete
- next four of 8 cases#63 #70
#97 #100*
0.0 5.0 10.0 15.0 20.0 25.0 30.0 35.0 40.0
-30 -25 -20 -15 -10 -5 0
P
la
te
le
t
C
o
u
n
t,
t
im
e
s
1
0
4 p
e
r
m
ic
ro
li
tr
e
Weeks before Delivery Day [x = 0 represents Delivery Day]
Low Level Across Gestation
[four cases total]
#30 #38 #92 #87
* represents twin-related GT
123
Kohei Kotera et al.: The Individual Variation of Platelet Counts in Gestation
Figure 4 (2nd page of 2). 5 Identified Categories of Platelet Count Kinetics during Gestation, continued
0.0 5.0 10.0 15.0 20.0 25.0 30.0 35.0 40.0 45.0 50.0
-30 -25 -20 -15 -10 -5 0
Pla
te
le
t
C
ou
nt
, t
im
es
1
0
4 pe
r
m
ic
ro
lit
re
Weeks before Delivery Day [x = 0 represents Delivery Day]
GT Incomplete
four representative cases of "characteristic pattern"
#12 #53
#54 #68
0.0 5.0 10.0 15.0 20.0 25.0 30.0 35.0 40.0
-30 -25 -20 -15 -10 -5 0
P
la
te
le
t
C
o
u
n
t,
t
im
e
s
1
0
4 p
e
r
m
ic
ro
lit
re
Weeks before Delivery Day [x = 0 represents Delivery Day]
No Net Change
PC on DD within ±5% of PC on 1st Visit
#3: convex, flattened GT pattern #36: convex, flattened GT pattern #62: convex, flattened GT pattern #5 [simple] convex pattern
0.0 5.0 10.0 15.0 20.0 25.0 30.0 35.0 40.0 45.0 50.0
-30 -25 -20 -15 -10 -5 0
Pl
at
el
et
Co
un
t,
tim
es
1
0
4 pe
r m
icr
ol
itr
e
Weeks before Delivery Day [x = 0 represents Delivery Day]
Non-GT Increase
[four of 18 cases]
#57: convex increase #81: convex increase #6: linear increase #8: concave increase
124 Kohei Kotera et al.: The Individual Variation of Platelet Counts in Gestation
mean age of “GT Complete type”, “GT Incomplete type”,
“Low Level PC across Gestation”, “No Net Change”, “
Non-GT Increase” was 35.6 years old, 30.9, 31.8, 30.8, 29.9,
respectively. Three/five twin pregnant women were “GT
Complete type”. Two IVF-ET pregnant women are contained.
So Infertility women elevated the mean age of “GT Complete
type”.
3. GT prevalence versus variables of Reduction Rate and
1st Visit PC
Next, we examined the relationship between GT prevalence versus gestational PC reduction rate and 1st Visit data (Figure 5). Given a wide range of PC decrease from a wide range of absolute PC values (see Figure 2 and Table 2), reduction rates alone could not determine which cases might become GT. As GT tends to occur in pregnant women with relatively low initial PC, we were also interested in the predictive value of the 1st Visit PC measurement. Receiver-Operating Characteristic (ROC) analysis (Figure 5) provided an Area Under the Curve (AUC) value of 0.801 for the reduction rate variable and an AUC value of 0.785 for the 1st Visit variable. Recalling that AUC values indicate the probability that a predicted risk of GT will be higher for a randomly selected woman with GT at delivery day (True Positive) than for a randomly selected
Table 2. Distinguishing Characteristics of 5 Identified Categories of Platelet Count Kinetics during Gestation
Number of Cases (100 total)
Median PC at 1st visit
Slope by -10W
Presence of elevation in last ten weeks
Presence of V-line figure
Median PC at Delivery Date
Median Change Ratio (%) and Range
GT Complete
-meeting 4 conditions listed in "Materials and Methods"
8 20.25 [0,0]
decrease - usually low but can be moderate, can include fluctuations Yes
Yes, post-partum arm of "V" shape sharper
12.35 [7,1]
-41.6 [-19.6 to -59.8]
Low Level Across Gestation
-curve mostly at or below 15x104/µL 4
15.15
[1,0] usually low slope or none unclear
Usually no, but post-partum rise is very sharp
13.15 [4,0]
-9.9 [-20.7 to 13.7]
GT Incomplete
-reduction rate >5% though DD above 15x104
/µL 48
23.8 [0,0]
usually low decrease to no slope, but "characteristic pattern" also includes cases from high decrease to slight increase
<by subcategory> <by subcategory>
19.95 [0,0]
-17.0 [-5.7 to -44.3]
characteristic pattern 35 Yes Yes
convex decrease 6 No
unclear for various small subcategories, especially as post-partum data insufficient
linear decrease 4 No
uncommon pattern 2 Yes in both
concave decrease 1 No
No Net Change
-change ratio within ±5% and curve above 15x104
/µL
22
22.15 [0,0]
low to very slight increase for most frequent subcategory, otherwise almost no slope
<by subcategory> <by subcategory>
21.85 [0,0]
-0.3 [-4.9 to 3.75]
convex, flattened GT pattern 8 Yes Yes
convex pattern 7 Yes nsufficient post-partum data
linear pattern (no slope) 4 No No, but very sharp p-p data
concave pattern 3 No No, note p-p data insufficient
Non-GT Increase
-increase rate >5% and curve above 15x104
/µL 18
19.35 [1,0]
increase - usually low but can be moderate
<by subcategory> <by subcategory>
24.2 [0,0]
17.7 [6.2 to 49.0]
convex increase 9 Yes Yes
linear increase 5 No No, but p-p rise can be sharp
concave increase 4 unclear No, but p-p rise can be sharp
)LJXUH 5HFHLYHU2SHUDWLQJ&KDUDFWHULVWLFZLWK$UHD8QGHU&XUYHSURYLGLQJWKHSUREDELOLW\WKDW
WKHSUHGLFWHGULVNRI*HVWDWLRQDO7KURPERF\WRSHQLDLVKLJKHUIRUDFDVHWKDQIRUDQRQFDVH
3UHGLFWRUYDULDEOH$3ODWHOHW&RXQW5HGXFWLRQ5DWH>3&DW''± 3&DWVW9LVLW3&DWVW9LVLW@
%3ODWHOHW&RXQWPHDVXUHPHQWDWVW9LVLWRIJHVWDWLRQ
VSHFLILFLW\
6H
QV
LWL
YL
W\
Figure 5: 5 Receiver Operating Characteristic with Area Under Curve providing the probability that the predicted risk of Gesta-tional Thrombocytopenia is higher for a case than for a non-case. Predictor variable:
(A) Platelet Count Reduction Rate [(PC at DD – PC at 1st
Visit)/(PC
at 1st Visit)]
125
Kohei Kotera et al.: The Individual Variation of Platelet Counts in Gestation
woman without GT at delivery day (False Positive), just as quick overviews of Figures 1 to 4 might suggest, the accuracy of both variables independently proved to be good to fairly good but not decisive.
Discussion
The present study was conducted using retrospective cross-sectional and longitudinal data so as to gain a clearer understanding of occult GT and of inter- and intra-case PC variation. In confirming an overall PC decrease in pregnant women relative to the non-pregnant population, it was found more interestingly that the PC medians of GT-type cases often fluctuate following identifiable curves before falling to a minimum around delivery day. The five curve categories described in Figures 3, 4 and Table 2 show that GT-type cases can range from a “complete-type” pattern to an “ incomplete-type” pattern, the extent of which depends on PC reduction. There were also striking similarities between the five categories: the frequently encountered PC elevation in the final ten weeks, which appeared to occur earlier in the GT Complete pattern, and the V-shape formed by decrease to DD followed by sharp post-partum rebound, which appeared to be more pronounced in the GT Complete pattern. Yet despite the identification of clear GT-type and non-GT-type patterns, it should be noted that an individualʼs PC can also change aberrantly. In other words, the diversity of PC variation between individual pregnancies suggests that thrombocytopenia during gestation is affected by more than only one or two causes.
Consequently, this study provided several interesting and instructive findings. First, complete blood cell (CBC) data showed only 2 women with abnormally low PC for first visit of early gestation but 12 women with abnormally low PC at delivery day (Figure 1, Table 2). In the non-pregnant population, PC has been found to be constant in any one individual but varies between individuals12. However, our study showed that variations both inter- and intra-case of individual pregnant women could be notably significant. Thus, it appears as if clear PC changes over gestation do not reflect ordinary platelet activity. Gestational PC level appreciably decreased in three-fifths of the women by as much as 60% in value, a finding fairly consistent with current literature, but it also increased in almost one-fifth of the women by as much as 40% (Figure 2B). This means that gestation can have deregulating effects on homeostatic condition. Such diversity may be associated with certain genetic factors, reflecting reports that average PC differs highly between ethnic groups13.
This studyʼs results seem to provide clarification that GT tends to occur late (-10 to -5w before delivery day), and that a substantial reduction rate and a low 1st Visit PC value can be expected to predict GT with good or fairly good accuracy. Nevertheless given that the reduction rate of GT by our definition ranged from 20 to 60%, which does overlap with the high end of the “GT Incomplete” range, and given that some high increase curves did begin from relatively low initial PC, neither variable can be expected to be of excellent predictive accuracy. In contrast, independent ITP predictors that have been reported for high sensitivity and specificity such as onset of thrombocytopenia within 28 weeks of pregnancy and platelet counts of less than 5 x 10⁴/µL at diagnosis 4 appear to be more conspicuous relative to non-thrombocytopenic pregnancies. Other than GT and ITP, Pre-eclampsia, HELLP syndrome and acute fatty liver are also known to be affected by thrombocytopenia in pregnancy. With respect to these conditions, the liver appears to perform a key function as the organ producing thrombopoietin. We are also interested in examining hepatic and ectopic thrombopoietin effects such as the placenta.
In conclusion, in our cross-sectional and longitudinal retrospective study of saved PC data, gestational thrombocy-topenia appeared to some extent as an earlier, more pronounced expression of characteristic 3rd Trimester PC fluctuation that seems common to many if not to most pregnancies and that seems to relate to the placental cytokine and receptor sys-tem. Our novel identification of diverse kinetic patterns with GT-pattern focus suggests that, instead of a universal de-crease caused by hemodilution alone, homeostatic condi-tions during gestation are affected by a diversity of varying factors such as the placental thrombopoietic system.
Conflict of Interest Disclosures:
None reported.
Acknowledgements:
126 Kohei Kotera et al.: The Individual Variation of Platelet Counts in Gestation
References
1. Vera EV, Peng TCC, Talavera F, et al. Thrombocytopenia in Pregnancy. Medscape Reference. http://emedicine.medscape.com/article/272867-overview. Updated March 20, 2012. Accessed September 1, 2014. 2. Burrows RF, Kelton JG. Thrombocytopenia at delivery: a prospective
survey of 6715 delivery. Am J Obstet Gynecol. 1990; 162(3): 731-34. 3. Myers B ,Diagnosis and management of maternal thrombocytopenia in
pregnancy. Br J Haematol. 2012;158:3-15
4. Kwon JY, Shin JC, Lee JW, Lee JK, Kim SP, Rha JG. Predictors of id-iopathic thrombocytopenic purpura in pregnant women presenting with thrombocytopenia. Int J Gynaecol Obstet. 2007 Feb; 96(2):85-8. 5. Gernsheimer TB. Thrombocytopenia in pregnancy: is this immune
thrombocytopenia or…? Hematology Am Soc Hematol Educ Program. 2012; 2012:198-202.
6. McCrae KR. Thrombocytopenia in pregnancy. Hematology Am Soc He-matol Educ Program. 2010; 2010: 397-402.
7. Lin J, Linzer DI. A novel megakaryocyte differentiation factor from mouse placenta. Trends Cardiovasc Med. 1999 Aug; 9(6):167-71. 8. Parnas M, Sheiner E, Shoham-Vardi I, et al. Moderate to severe
throm-bocytopenia during pregnancy. Eur J Obstet Gynecol Reprod Biol. 2006 Sep-Oct; 128(1-2):163-8.
9. Gernsheimer T, James AH, Stasi R. How I treat thrombocytopenia in pregnancy. Blood. 2013 Jan 3; 121(1):38-47. doi: 10.1182/blood-2012-08-448944. Epub 2012 Nov 13.
10. Gernsheimer T, McCrae KR. Immune thrombocytopenic purpura in pregnancy. Curr Opin Hematol. 2007 Sep; 14(5): 574-80.
11. Gauer RL, Braun MM. Thrombocytopenia. Am Fam Physician. 2012 Mar 15; 85(6): 612-622.
12. Kuter DJ. The physiology of platelet production. Stem Cells. 1996; 14 Suppl 1:88-101.