sustainability
ISSN 2071-1050 www.mdpi.com/journal/sustainability ArticleOvercoming the Barriers to Organic Adoption in the United
States: A Look at Pragmatic Conventional Producers in Texas
Douglas H. Constance * and Jin Young Choi
Department of Sociology, Sam Houston State University, Huntsville, Texas 77341-2446, USA; E-Mail: [email protected]
* Author to whom correspondence should be addressed; E-Mail: [email protected]; Tel.: +1-936-294-1514; Fax: +1-936-294-3573.
Received: 7 December 2009 / Accepted: 5 January 2010 / Published: 8 January 2010
Abstract: Organics is the one of the fastest growing segments in food sales. Though the amount of certified organic land is increasing, the supply of organic foods lags behind demand in the United States. The reasons for this gap include a lack of government support for organics, and the peculiarities of organics as an innovation. In an attempt to close this gap, and increase the environmental sustainability of U.S. agriculture, this paper has two objectives. The first is to document the structural and institutional constraints to organic adoption. This is accomplished through a review of organic programs and policies in the U.S., in particular the National Organic Program. The second objective is to investigate the predictors of interest and the perceived barriers to organic adoption among pragmatic conventional producers in Texas, compared to organic and conventional producers. This is accomplished through a survey of a representative sample of producers in Texas. The results indicate that more than forty percent of producers who currently have conventional operations have at least some interest in organic production (pragmatic conventional producers). There are significant differences among the three groups in their structural and attitudinal characteristics related to organic adoption. For the pragmatic conventional producers, an increase in revenue would be a major facilitator of organic adoption. Their high levels of uncertainty regarding organic production and marketing, and especially organic certification constrain organic adoption. The results also reveal that the institutional setting in the U.S. hindered adoption. The paper concludes that increased institutional support would facilitate organic adoption.
1. Introduction
Despite the potential for organic agriculture to improve the environmental performance of U.S. agriculture [1-8], the national standard is having only a modest impact on environmental externalities caused by conventional production methods because the organic adoption rate is so low [9]. Organic food is one of the fastest growing segments is food sales, and in recent years the organic food sector has experienced double-digit growth, while conventional foods have experienced a more moderate 2 to 3 percent growth rate [10-12]. Once considered a niche-market, organic products are now sold in the mainstream supermarkets as the majority of U.S consumers buy some organic products [13]. While over the past 20 years U.S organic production has more than doubled, consumer demand has increased at an even faster pace. Although the U.S. Congress passed legislation in 1990 to regulate organics and the National Organic Program (NOP) was created in 2002, the adoption of and conversion to organic practices has not kept up with demand. As a result, organic foods and food supplies that meet the USDA regulations are being imported to supply the growing demand in the U.S. In an attempt to close the gap between domestic production and consumption, the Food, Conservation, and Energy Act of 2008 (2008 Farm Act) included several new provisions to increase organic adoption rates [9].
In support of efforts to close the gap between organic consumption and production in the U.S, and thereby contribute to the environmental sustainability of U.S. agriculture, this research follows
Padel’s [14] suggestion and pursues two complementary objectives. According to Padel [14], to increase rates of organic farming adoption, research needs to go beyond the personal characteristics of conventional farmers interested in organic adoption and investigate the structural and institutional framework of adoption. Accordingly, the first objective of this research is to document the structural and institutional constraints to organic adoption in the U.S. This is accomplished through a review of the development of organic initiatives, programs and policies in the U.S., focusing on the NOP created in 2002. The NOP, and its protocol for the USDA certified-organic label, is the only government sanctioned measure of sustainable agriculture in the U.S. The second objective is to investigate the predictors of interest and the perceived barriers to organic adoption among pragmatic conventional producers in Texas, compared to organic and conventional producers. This is accomplished through a survey of a representative sample of producers in Texas. Focusing on producers who operate conventional operations in Texas who indicate an interest in organic production, what some
researchers call ―pragmatic conventional‖ producers [15,16], the paper documents predictors of such interest and investigates the perceived barriers to the adoption of organic production methods.
2. Background on Organics in the United States
Growing at a rate of between 12 and 21 percent annually, the market for organic foods in the U.S. has quintupled since 1997, increasing from $3.6 B in 1997 to $21.1B in 2008 [17]. Organic foods now account for 3% of total U.S. food sales and are expected to grow at similar rates for the next few years [12]. At the global level, organic sales doubled from 2000 to 2008 to $38.6 B, and are increasing at a rate of about $5 B per year [18]. The vast majority of these products are consumed in the U.S. and Europe, followed by Japan.
The growth in organics has attracted entry by both large conventional farming operations to meet the demand [19], as well as the mainstream supermarkets to retail to customers [9,20]. As a result, the organic distribution system is rapidly transforming from one characterized by the domination of direct sales and specialty/natural food stores to incorporation into the conventional system [12,21]. By 2006 mass market grocery stores such as WalMart and Kroger accounted for the 38% of organic food sales, with another 8% through mass merchandisers and ―club‖ stores [22]. Significant entry into the organics market is expected to continue [12].
Table 1. U.S. Organic Certified Farm Operations: 1992–2007; Certified Organic Farmland: 1992–2005 (in thousands of hectares) and Certified Livestock: 1992–2005 (in thousands).
Item 1992 1997 2002 2005 2007 % change
92–97 97–02 02–05 02–07 Operations*
Farmland
3,587 5,021 7,323 8,493 10,159 40 46 16 39
Total 378.6 544.9 779.2 1640.8 45 43 111 Pasture/rangeland 215.3 200.9 253.3 943.4 –7 26 272 Cropland 163.3 344.0 525.9 697.4 111 53 33
Animals
Livestock 11.6 18.5 108.4 196.6 59 485 81 Poultry 61.4 798.3 6,270.2 13,757.3 1,201 685 119
* Does not include subcontracted organic farm operations. Source: USDA/ERS [11], Table 2 and Table 4: based on information from USDA-accredited State and private organic certifiers.
By 2007, a total of 32.2 M hectares were certified as organic worldwide, 1.5 M more hectares than in 2006 [23]. Although the amount of certified-organic land is increasing in the U.S., the rates across commodity sectors vary greatly. For example, in 2005 only about 0.5% of cropland (0.2% of soy and corn) and pasture were certified, but almost 5% of vegetable land and 2.5% of fruit and nut land were certified [24]. In 2008 organic production has spread to every state and every commodity sector [11] in the U.S. At the global level, in 2007 the U.S. was tied for fourth largest (1.6 Mha) in terms of amount of agricultural land certified organic or ―in transition‖ to organic, following Australia (12.0 Mha), Argentina (2.8 Mha), Brazil (1.8 Mha) and China (1.6 Mha) [18]. Even with the steady increases in organic production in the U.S., domestic supply still lags substantially behind domestic demand [9].
Undersupply is most evident in the North American region [24]. While lack of consumer demand for organics was cited as the limiting growth factor in the U.S. in the early 1990s [25,26], by the late 1990s the lack of sufficient quantity and quality supply of organic products became the problem [27]. Now, as organics is embraced as a lucrative opportunity by mainstream food companies through both internal development and acquisition of existing organic companies, a lack of reliable access to supplies of organic raw materials is reported as the factor limiting business growth [9,12,28]. Although the U.S. had been a net exporter of organic foods for many years, by 2002 organic imports greatly exceeded exports (exports were in the range of $125–$250 M while imports were $1.0–$1.5 B) [29-31]. Since 2002, organic imports have increased at even higher rates [9]. The National Organic Program (NOP) certified-organic standards created in 2002 allows organic farmers and handlers anywhere in the world to export to the U.S, as long as the products meet the NOP standards. Of the 27,000 producers and handlers certified in 2007 by USDA-accredited certifiers, 11,000 are from over 100 foreign countries, mostly from Canada, Italy, Turkey, China and Mexico, which accounted for half of foreign organic farmer/handlers in 2007 [9].
3. Structural and Institutional Barriers to Organic Adoption
Although the U.S. Congress passed the Organic Foods Production Act in 1990 to establish national standards for organic products, the formal standards for USDA certified-organic products were not finalized until 2002 under the authority of the NOP. The overall process was contested by conventional agricultural interests who perceived organics to be an explicit critique of mainstream agriculture [19,35]. In fact, the Proposed Rule for organic standards included provisions to allow the use of genetically-modified organisms, irradiation, and municipal sludge—the Big 3. After a swarm of protest by pro-organic groups, the Big 3 were excluded from the Final Rule adopted in 2002.
U.S. federal organic policy and programs focused on using market-mechanisms to support the growth of the organic sector, as opposed to government subsidization as in several European countries [36,37]. The organic standards and resulting USDA label were designed to facilitate the flow of information and support market signals. The certified-organic label was defined to enable price premiums from consumers that covered the extra costs associated with organic production. But, no direct subsidies were offered to support conversion and thereby moderate the negative economic impact of the three-year transition period [9]. Additionally, there was no official government position that foods produced organically were superior in any way to foods produced conventionally. Unlike in some European countries where government-sponsored organic conversion and production supports began in the 1980s based on explicit recognition of the environmental and surplus benefits of organics by reducing overproduction [38-40], there was no official USDA program that explicitly encouraged conversion [36,37]. Early research in Europe found that conversion subsidies can increase the organic farming sector by 300% [41]. The fact that the percent increase in number of organic operations is greater (46%) in the 1997–2002 period than in the 2002–2007 (39%) period (Table 1) provides some support for the position that the NOP lacked the kind of direct government support to generate substantial conversion to organics [14,42,43].
Inadequate social and infrastructure support for organics has also limited its adoption. The bias toward conventional agriculture in U.S. society, including government, universities, business, and rural communities, is a significant constraint [4,35,42,43]. Although the first national study published in 1980 established the feasibility and profitability of organics, and included recommendations regarding research, education, and public policy support for existing organic farmers and for conventional farmers interesting in conversion [44], it was rejected by the incoming Reagan Administration, which also abolished the Organic Resources Coordinator position in USDA. The Land Grant University system openly criticized and opposed early efforts at organics [4,45,46]. Scientists who did research organics experienced personal and professional criticism. In 1998 organic farmers reported that the greatest constraint to conversion was the uncooperative and uniformed extension agents [47]. Research on agricultural extension agents in Australia found a similar bias against organics [48]. The resulting lack of research support with almost no publically-funded farm advisors or agricultural extension services and few government funded researchers created formidable adoption barriers [4,42,43,49].
conversion, refusal of loans and/or insurance, problems with grant applications, and certifications constraints [14,51,52].
As a result of these social and institutional barriers and the narrow market-driven approach, the U.S. lags behind Europe regarding the development of research and education programs in support of organics, and there tends to be broader public and governmental support for organics in Europe than in the U.S. [31,53]. With support from social movements, national initiatives in the 1980s resulted in government policies that acknowledged the public benefits of organics in countries such as Austria, Denmark and Switzerland. In 1993 the European Union implemented the legal definition of organic farming, making it possible to legally include organic farming as a component of member-state rural development programs. Several EU countries provided area payments to support organic conversion as an agri-environmental measure in the framework of EU rural development programs. The EU Action Plan for organics expanded the institutional framework beyond legal definitions and financial support for conversion to an integrated approach that included market development, research, information services, extension services, training and education, and stakeholder participation. By 2008 the majority of European countries had implemented action plans for organic food and farming, including targets for percent of total agricultural lands managed organically [37-39].
In 2007 1.9% of the European agricultural area and 4% of EU agricultural lands were organic, with much higher percentages in countries such as Austria (13%) and Switzerland (11%) [18]. While a 2006 survey of organic industry experts reported that U.S. organic production could soon reach 5%–10%, this would only occur with substantial investments in research, education, and policy that remove barriers to organic agriculture [28]. The market-driven focus alone was not sufficient to attract significant organic conversion by conventional producers [14,42].
Official government support of organics in European Union countries in the form of subsidies sends a strong message to farmers and consumers regarding the perceived benefits of organics [36,41]. As more research establishes the environmental and public benefits of organic agriculture [1-3,5,6,8], formal government support also sends messages to conventional farmers regarding the need to seek more environmentally-friendly agricultural practices. In contrast, in the U.S. organic farming has not been seen as being environmentally and/or socially superior by the majority of professionals and policy makers. Even though increased demand demonstrates growing societal interest in organics, research on the societal benefits of reduced synthetic chemicals is often neutralized by assertions of reduced yields based on comparisons done during the transition period when organic yields are depressed. The lack of an official government position in support of organics combined with inappropriate comparative research also limited adoption in the U.S. [36,42].
The institutional setting [39, 54] in several European countries allowed the social movement groups to have more influence on the initial programs and policies regarding organics, including public support and subsidies for organic conversion. In the U.S., while the organic social movement groups were the impetus for the initial growth of organics, the business interests came to dominate the process. The business influence, combined with the organized opposition by conventional agriculture and the Land Grant Universities, resulted in a market-based standard that catered to the certifiers, processors, and customers, instead of the producers [4,11,35,42,43,45-47,49].
characteristics, research, education, and extension support is vital to meet the needs of present and future organic producers and thereby generate the domestic supply to meet the growing demand. Numerous stakeholders are calling on USDA and the Land Grant system to increase their attention and resources to this issue and thereby reduce the barriers to entry, especially for established, conventional growers. More specifically, the organic price premium has not been a sufficient incentive in the absence of government supports to ameliorate the risks of the 3-year transition phase [41].
For production agriculture in the U.S. to keep pace with growing consumer demand, prospective organic growers must be given tangible government support to convert to organics [41]. An existing incentive system in the U.S. is the Environmental Quality Incentives Program (EQIP) cost-sharing approach being used in Iowa. The EQIP approach is more acceptable for market-oriented agricultural policy [50]. Individual states are allowed to set priority areas under the EQIP, and in 1997 Iowa became the first state to subsidized organic conversion with USDA/EQIP funds [55].
In response to the growing concern over the demand/supply gap and to criticism about the lack of government support for organics, the 2008 Farm Bill included $78M in research, education, and extension for organics, five times that of the 2002 Bill. Included are monies and policies to: support the
collection of economic data about organic production and markets; offset part of farmers’ organic
certification costs; eliminate bias against organic growers in crop insurance programs; and establish financial and technical support for conversion to organic production [56]. In a significant departure from previous farm bills, the 2008 Farm Act overtly acknowledges the potential environmental benefits of organic farming [9]. Also departing from previous forms of support, it includes national-level provisions that provide direct financial support to farmers converting to organic production through EQIP. Payments can be up to $20,000/yr/farm, with an $80,000 cap over a six-year period. In another show of support for organics, in May 2009 the Deputy Secretary of Agriculture announced $50 million in funding for the 2009 Organic Initiative as part of the Obama
Administration’s promise to encourage more organic agriculture [57].
While it appears that some of the structural and institutional constraints are being ameliorated by changes in USDA programs to increase support for organic research and conversion, because there is no information about what percentage of U.S. farmers are inclined to convert to organic methods, it is hard to tell what impact a subsidy or cost share would have on adoption rates in U.S. farming [29].
4. Production and Marketing Barriers
5. Organics and the Adoption-Diffusion Model
There are numerous studies on the personal characteristics, philosophical orientations, and related reasons for organic producers to engage in organic production [41]. The literature is much thinner on what conventional producers see as the barriers to organic adoption. Based on her review of the relevant literature, Padel [14] concludes that the traditional adoption-diffusion model [58] does not fit well with the adoption of organics for several reasons. For example, organics requires changes in the entire farm system rather than adopting a single technique. The resulting financial cost due to lower yields, especially during the conversion years, is a major barrier [59,60]. Therefore, organics is more risky and complex than most agricultural innovations, making it less attractive to adopt. Some researchers have noted that the non-adoption of organics is often a rational decision due to the unique characteristics of the innovation, such as higher risk, whole farming system change, lack of and conflicting information, reduced flexibility in managerial decisions, and incompatibility with other aspects of the farming system [61].
As opposed to a top-down technology delivery system whereby extension agents are linked to cooperator farmers who willingly adopt the new innovations, organics is a complex ―bottom up‖ innovation that does not fit well the traditional adoption/diffusion model that focuses on the personal characteristics of the producers. Because organics is mostly a software or knowledge-based type of innovation, it is heavily dependent on the quantity and quality of support information, information that is often lacking from traditional sources such as extension services and universities. The lack of information increased the risks of conversion, which constrains adoption. Additionally, innovations are more readily adopted if they match the local value system, again a frequent barrier to organics as it was often labeled as non-scientific and/or a fringe enterprise. Many early adopters experienced extreme social isolation as organic farming was seen as an attack on the value system of conventional agriculture. Finally, a major institutional barrier to organic adoption has been the general lack of support from government and agricultural extension services. This constraint has lessened in recent years as society in general has embraced a greater focus on sustainable agriculture [14].
The motivations for adopting organic agriculture have tended to change over time from a philosophical position to a financial one [14,36,41,62-64]. In the language of the adoption ladder, the innovators were motivated by philosophical commitments grounded in environmentalism, while the recent entrants, the early adopters and early majority, have a more practical orientation grounded in market-based perspectives [14]. While the innovators of organics were not dependent on financial incentives, for recent adopters financial support to cover the risks of conversion and reliable access to organic price premiums becomes necessary.
need to embrace a broad vision of a knowledge network that includes producers, advisors, and researchers as partners rather than clients [14].
6. The Pragmatic Conventional Producer
Two studies that employ a decision-tree methodology to sort out the complex matrix of motivations of both conventional and organic farmers are useful. Fairweather [15] studied both organic and conventional farmers related to the factors that prompted them to remain conventional or adopt organic in New Zealand. Based on the results, Fairweather developed a typology of organic and conventional farmers. Conventional farmers were classified as either ―never really considered organics‖ or ―have
seriously considered it.‖ Organic farmers were classified as ―committed organic‖ (philosophically motivated), ―pragmatic organic‖ (economically/premium motivated), ―hopeful organic‖ (wanted to grow organic but their conventional operations were familiar and profitable), and ―frustrated organic‖
(want to grow organic but have not yet picked their organic crop to grow). He concluded that there were three groups of constraints that hindered conventional farmers (as well as the ―hopeful‖ and
―frustrated‖ organics) interested in organics from adopting organics: technical constraints; financial
constraints; and incompatibility constraints. Fairweather [15] suggests that to increase adoption, programs and policies targeted to the conventional farmers interested in organics should focus on information that addresses the concerns about the three areas of constraints. In doing so, a major limitation for conventional farmers would be resolved and the conversion to organic farming would occur more quickly.
Following Fairweather [15], Darnhofer et al. [16] also used a decision-tree methodology to identify the characteristics and rationales of conventional and organic farmers in Austria to get a better understanding of the complicated aspects of the adoption decision. Their research sorted farmers into five groups—two organic and three conventional: ―committed‖ and ―pragmatic‖ organic; ―committed‖
and ―pragmatic‖ conventional; and ―environmentally conscious but not organic.‖ They state that their typology fits with the results of Schoon and Te Grotenhuis [65] who differentiate between idealistically motivated (either organic or conventional) and pragmatically motivated (either organic or conventional) farmers. While the idealistic/committed farmers are unlikely to switch (convert) farming systems due to their strong convictions, the pragmatics are much more likely to respond to incentives. For the purposes of this research, we are interested in what might motivate the ―pragmatic
conventional‖ to convert to the ―pragmatic organic.‖
Darnhofer et al. [16] characterize the pragmatic conventional farmers as those who have no inherent opposition to organics, but see conversion as a very risky decision. Pragmatic conventional producers focus on price uncertainty, market development, and regulatory constraints. They foresee the major changes needed in their farm operation and expect a tangible benefit. They are likely to convert once the organic system has been proven viable by farmers in their region and the organic market has been established. Reduced risk is important, but probably not enough to prompt conversion. This is especially true for farmers looking at ways to stay in farming but avoid the consolidation, concentration, and technology treadmill of conventional agriculture. They are a potential pool of
complexity of institutional, technical, and motivational factors that affect organic conversion is necessary to increase the rates of adoption.
A study conducted in 2003 in Norway by Koesling et al. [66] investigated the characteristics of potential converters compared to organic and conventional producers is also useful. The research found that 4% (30) of the 1,033 respondents planned to convert to organics by the end of 2009, with another 18% uncertain regarding conversion. Crop farmers were more likely than dairy farmers to have plans to covert. When compared to the conventional and uncertain groups of farmers, potential converters had more positive attitudes regarding the sustainability of organics and tended to be less motivated by economic concerns, although for many potential converters profitability and organic farming payments were important reasons for converting to organics. They note that beyond the financial aspects of conversion, non-financial goals and farm-environmental attitudes were also important considerations of organic conversion. Koesling et al. [66] conclude that policies that focus solely on the farm profitability parameters of organic conversion will miss important underlying factors for potential converters.
7. The Research in Texas
The early review of the literature [26,37,51] combined with other studies in the UK [6,64], Portugal [62], Austria [16,50], New Zealand [15], Germany [63], Sweden [36] and the U.S. [36,42] indicate that there are numerous barriers to organic adoption. As noted above, these barriers have changed over time as the institutional policy environment and consumer demand for organics has changed. Additionally, barriers vary by type of operation (extensive versus intensive) and commodity produced (rowcrops versus livestock versus fruits/vegetables). Researchers agree that detailed studies are needed to sort out the nuances of these differences and the types of policies and programs that might enhance organic adoption. This study in Texas is employed to respond to calls for more research on predictors of organic adoption; research that can then be used to design targeted policies to promote conversion [14-16,36,50,66]. This study identifies the characteristics, attitudes, needs assessment, and perceived barriers to organic adoption for pragmatic conventional producers compared to committed conventional and organic producers.
in number of certified operations was also similar for the 2002–2007 period, 46% in Texas and 39% nationally.
Table 2. Texas Organic Certified Farm Operations: 1997–2007; Certified Organic Farmland by Commodity: 1997–2005 (in hectares) and Certified Livestock: 1997–2005 (in thousands).
Item 1997 2002 2005 2007 % change
97–02 02–05 02–07
Operations* 2 150 192 219 7,400 22 46
Pasture & Crops 12,456 113,112 139,230 805 18 Livestock n/d 21,000 52,000 n/d 147
Vegetables 107 100 253 –7 154
Fruit 540 540 728 0 35
Cotton 3,292 3,055 2,813 –7 –8
* Does not include subcontracted organic farm operations. Source: USDA/ERS [11], Tables 4, 5, 10, 11, 13: based on information from USDA-accredited State and private organic certifiers.
7.1. Data and Methods
This study used data from the project funded by the USDA 2007 Federal State Marketing
Improvement Program, ―Identifying Barriers to Entry into the Organic Market and Possible Strategies to Increase the Likelihood of Success for Potential Organic Producers‖ [67]. The project is a collaboration between the Texas Department of Agriculture (TDA) and Sam Houston State University (SHSU) to identify adoption barriers for organic production in the State of Texas, USA. A mail survey was conducted in 2007 with a representative sample of producers in Texas who are listed in the USDA National Agricultural Statistics Service (NASS). The NASS list includes all producers in Texas who participated in the 2002 Census of Agriculture. In this research, only producers reporting annual farm sales above $25,000 (n = 66,580) were included in the sampling frame in order to focus on commercially viable operations.
A stratified random sampling method based on different commodity producers was employed. First, the NASS list was categorized by the types of commodity and samples from each commodity group were selected. Considering an estimated response rate of 30% in a mail survey and a target sample response of 1,200 surveys, a total of 4,006 producers were randomly selected from the sampling frame. NASS distributed the survey through postage mail to the selected sample as part of a TDA/USDA interagency agreement. Second and third mailings were sent to increase the response rate. A total of 1,178 surveys were returned and 977 of those surveys were sufficiently completed. Of the 977 completed surveys, 72 cases are excluded because of missing values on the ―orientation toward organics‖ variable. Thus, a total of 905 cases are used for the final analyses.
asked to identify their current farming operation: conventional; conventional but in the process of becoming certified organic; previously certified organic but no longer certified; non-certified organic; and certified organic. There were no cases for the previously certified organic but no longer certified category. The organic producer group includes certified and non-certified organic growers (5 cases and 82 cases, respectively), as well as conventional producers who are in transition to certified (13 cases). The conventional producers were divided into two groups—conventional producer group and pragmatic conventional producer group based on their interest in organic production. The conventional producer group includes those who expressed no interest in organic production. The pragmatic conventional producer group includes conventional producers who reported at least some level of interest in becoming involved in organic production: 150 for slight interest, 152 for moderate interest, and 34 for high interest. The groupings follow Padel’s [14] suggestion regarding the need for more research on conventional producers interested in organics and are informed by the concept of
―pragmatic conventional farmers‖ [15,16].
A series of bivariate analyses were conducted to compare producer characteristics, attitudes toward organics, and information and services needs assessment among the three groups of producers: conventional, pragmatic conventional, and organic. Regarding marketing and production barriers to organic adoption, the views of the pragmatic conventional producers were compared to the conventional producers.
7.2. Results
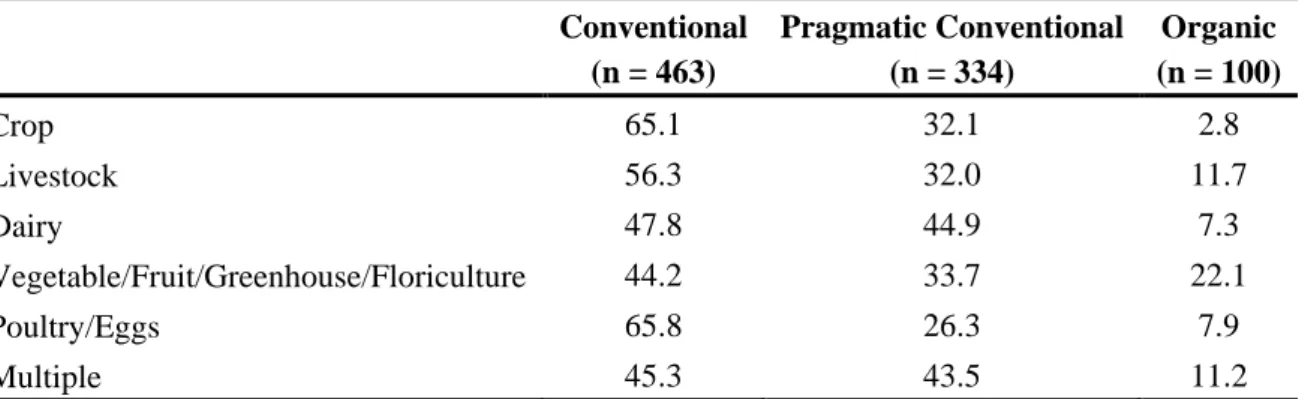
Table 3 shows that there is a significant difference in the orientation to organics based on the types of production. Dairy producers are most likely to have a pragmatic orientation to organics (44.9%), followed by producers who grow multiple commodities (43.5%); poultry/egg producers are least likely to be interested in organics (26.3%). Respondents who have vegetable/fruit/greenhouse/floriculture operations are most likely to identify themselves as organic producers (22.1%). Poultry/egg (65.8%) and crop (65.1%) operations are most likely to maintain their conventional orientation.
Table 3. Orientation to Organics by Type of Production (Percent). Conventional
(n = 463)
Pragmatic Conventional (n = 334)
Organic (n = 100)
Crop 65.1 32.1 2.8
Livestock 56.3 32.0 11.7
Dairy 47.8 44.9 7.3
Vegetable/Fruit/Greenhouse/Floriculture 44.2 33.7 22.1
Poultry/Eggs 65.8 26.3 7.9
Multiple 45.3 43.5 11.2
Note: This table is based on 897 cases due to eight missing cases in the type of production variable. Row percentages are presented in the Table 3. The row percentages were calculated within each production type to compare orientation to organics across different types of production.
In Table 4 the characteristics of the producers are significantly different among the three groups of producers. Regarding years of farming, the pragmatic conventional producers tend to have been farming longer than the organics but not as long as the conventional producers. Producers who report less than $50,000 in annual gross sales are most likely to be organic producers, while those who make $100,000 and more tend to be the pragmatic conventional producers. The producers who are least satisfied with their current farming system and most likely to expect their operations to change within three years are the pragmatic conventional producers. Interestingly, the group who is most likely to close or decrease their operation within three years is the organic producers. Pragmatic conventional producers are by far most likely (80.6% versus 26.5% for conventional producers) to report that that an increase in revenue would facilitate organic adoption.
Table 4. Producer Characteristics by Orientation toward Organics (Percent).
Characteristics Conventional Pragmatic
Conventional Organic
Years of Farming*
Less than 5 years 2.8 4.8 9.3
5–10 years 8.5 11.3 16.5
11–20 years 19.2 20.2 18.6
More than 20 years 69.5 63.7 55.6
Annual Gross Sales***
Less than $50,000 46.0 42.4 68.7
$50,000 to $99,999 14.2 13.4 12.5
$100,000 to $499,999 25.5 31.8 11.5
$500,000 or more 14.3 12.4 7.3
Expected Operation Change within Next 3 Years***
Expanding 18.0 33.2 26.7
Decreasing or Closing 18.9 12.8 20.9
No Changes Expected 63.1 54.0 52.3
Satisfaction with Current Farming System***
Satisfied 87.5 54.7 63.8
Neutral 5.9 21.4 23.4
Not Satisfied 6.6 23.9 12.8
Increase in Revenue Facilitate Adoption***
Facilitate 26.5 80.6 46.2
Not Facilitate 70.3 9.3 29.7
Not Necessary 3.2 10.2 24.2
P values report significance levels for Chi-square test of producers’ characteristics by their orientation toward organics: * p < 0.05; ** p < 0.01; *** p < 0.001.
support, the pragmatic conventional produces are very concerned about the economic risks of transitioning to organic methods.
Table 5. Attitudes Regarding Organics (Percent).
Conventional Pragmatic
Conventional Organic
I support the philosophy of organic farming***
Agree 26.8 66.3 73.6
Disagree 43.5 5.4 6.6
Not Sure 29.7 28.2 19.8
I am concerned about the economic risks of transitioning to organic methods***
Agree 45.7 59.9 28.0
Disagree 25.3 9.8 37.8
Not Sure 28.9 30.3 34.1
I am interested in organic production, but not organic certification***
Agree 7.9 25.3 37.5
Disagree 54.8 16.2 27.3
Not Sure 37.3 58.4 35.2
Organic farming is technically viable***
Agree 6.4 25.2 55.6
Disagree 62.1 15.4 15.6
Not Sure 31.5 59.4 28.9
Organic markets are reliable***
Agree 9.4 22.3 36.7
Disagree 50.9 18.7 14.4
Not Sure 39.6 59.0 48.9
I have the right equipment for organic production***
Agree 10.9 20.0 34.5
Disagree 51.9 24.8 23.0
Not Sure 37.2 55.2 42.5
Organic farming has proven to be profitable***
Agree 9.8 19.6 42.5
Disagree 50.3 27.8 14.9
Not Sure 39.9 52.6 42.5
I can successfully farm without the use of synthetic chemicals***
Agree 14.3 18.2 55.8
Disagree 52.7 22.4 16.3
Not Sure 33.0 59.4 27.9
Organic farming is a feasible long-term production method***
Agree 3.6 17.9 48.2
Disagree 68.5 14.6 18.8
Not Sure 27.9 67.5 32.9
I feel the necessary informational support for organic farming is available***
Agree 17.6 17.5 33.3
Disagree 34.9 26.3 27.4
Table 5. Cont.
Conventional Pragmatic
Conventional Organic
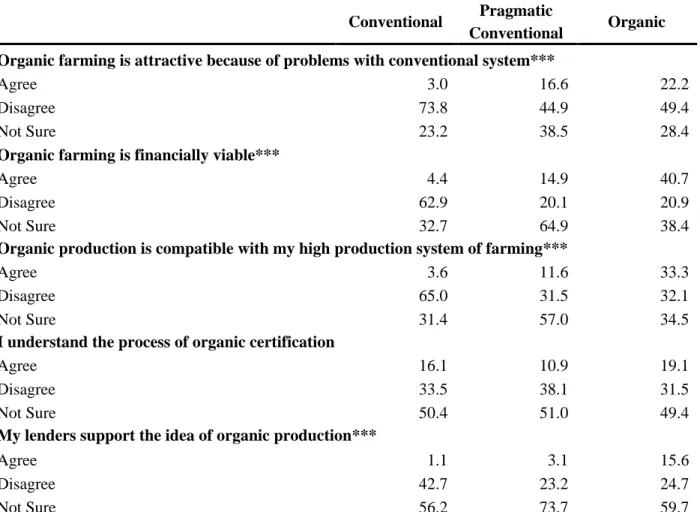
Organic farming is attractive because of problems with conventional system***
Agree 3.0 16.6 22.2
Disagree 73.8 44.9 49.4
Not Sure 23.2 38.5 28.4
Organic farming is financially viable***
Agree 4.4 14.9 40.7
Disagree 62.9 20.1 20.9
Not Sure 32.7 64.9 38.4
Organic production is compatible with my high production system of farming***
Agree 3.6 11.6 33.3
Disagree 65.0 31.5 32.1
Not Sure 31.4 57.0 34.5
I understand the process of organic certification
Agree 16.1 10.9 19.1
Disagree 33.5 38.1 31.5
Not Sure 50.4 51.0 49.4
My lenders support the idea of organic production***
Agree 1.1 3.1 15.6
Disagree 42.7 23.2 24.7
Not Sure 56.2 73.7 59.7
Note: This table is organized in descending order regarding the level of agreement that the pragmatic conventional producers report on each statement.
P values report significance levels for Chi-square test of producers’ attitudes toward organics by their orientation toward organics: * p < 0.05; ** p < 0.01; ** *p < 0.001.
For the remaining attitudinal statements, the organic producers tend to have the most positive attitude toward organic farming, while conventional producers have the most negative attitude. What is most notable for these variables is the high level of ―not sure‖ responses reported by the pragmatic conventional producers. Only on the statement that organic farming is attractive because of problems
with the conventional operation (38.5%) does the ―not sure‖ response fall below 50%. Pragmatic
conventional producers are especially unsure on the issues of lender support (73.7%), long-term feasibility (67.5%), and financial viability (64.9%).
Regarding organic certification, over 80% off all three groups report they are not sure about or do not understand the process of organic certification, and there is no significant group difference. Over one-third of organic producers report they are not interested in organic certification compared to one-quarter of pragmatic conventional producers.
Table 6 shows significant differences in service and information needs related to organic adoption among the three producer groups. As expected, conventional producers reported the highest rates of
development are identified as the two most useful items of services and information, export programs/market development and crop insurance are identified least useful. Notice that the organic producers report substantially higher rates of ―not useful‖ across all statements compared to the pragmatic conventional producers. For the organic producers, the most useful service and information needs are organic marketing workshops seminars and local/regional organic market development and the least useful are crop insurance and representation on organics-related public policy issues.
Table 6. Service and Information Needs Assessment (Percent).
Conventional Pragmatic
Conventional Organic
Consumer education programs about organics***
Not Useful 60.9 7.7 25.0
Somewhat Useful 24.6 45.7 28.4
Very Useful 14.6 46.6 46.6
Local/regional organic market development***
Not Useful 57.8 8.2 23.9
Somewhat Useful 27.1 42.6 30.7
Very Useful 15.1 49.2 45.5
Directories of organic product buyers***
Not Useful 57.3 10.2 24.4
Somewhat Useful 25.6 42.4 27.9
Very Useful 17.1 47.5 47.7
Organic marketing workshops/seminars***
Not Useful 61.3 10.2 23.0
Somewhat Useful 23.8 48.2 37.9
Very Useful 14.9 41.5 39.1
Organic-specific research and extension services***
Not Useful 59.1 10.3 24.4
Somewhat Useful 23.9 45.5 30.2
Very Useful 17.0 44.2 45.3
Organic price reporting services***
Not Useful 58.8 11.5 31.5
Somewhat Useful 28.0 46.0 28.1
Very Useful 13.3 42.5 40.4
Organic processing facilities***
Not Useful 56.4 11.8 28.9
Somewhat Useful 24.3 36.7 30.1
Very Useful 19.4 51.4 41.0
Development of organic marketing co-ops/association***
Not Useful 61.1 11.8 28.7
Somewhat Useful 24.2 45.8 27.6
Very Useful 14.7 42.5 43.7
Table 6. Cont.
Conventional Pragmatic
Conventional Organic Development of organic marketing co-ops/association***
Not Useful 61.1 11.8 28.7
Somewhat Useful 24.2 45.8 27.6
Very Useful 14.7 42.5 43.7
Representation on organics-related public policy Issues***
Not Useful 63.6 14.2 31.8
Somewhat Useful 26.3 52.8 34.1
Very Useful 10.1 33.0 34.1
Crop insurance for organically grown products***
Not Useful 61.7 17.5 45.2
Somewhat Useful 20.3 37.2 29.8
Very Useful 18.0 45.3 25.0
Organic export programs/market development***
Not Useful 61.8 18.9 31.4
Somewhat Useful 24.1 44.0 39.5
Very Useful 14.1 37.1 29.1
Note: Items are ranked in ascending order for the ―not useful‖ response by pragmatic conventional producers. P values report significance levels for Chi-square of producers’ service and information needs by their orientation toward organics: * p < 0.05; ** p < 0.01; *** p< 0.001.
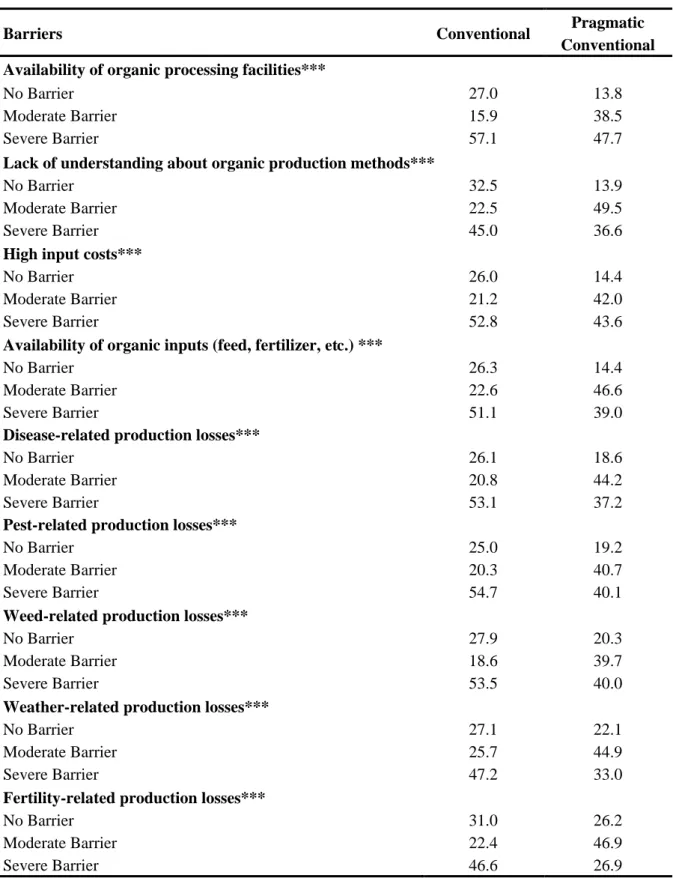
Tables 7 and 8 compare the perceived production and marketing barriers to organic adoption for the conventional and pragmatic conventional producers. For all the items, a much higher rate of
conventional producers report ―severe‖ barriers compared to the pragmatic conventional producers. The conventional producers also report higher rates of ―no‖ barrier, which might be due to the overall lack of interest in organic adoption. A higher rate of pragmatic conventional producers identifies all the items as moderate barriers. Regarding production barriers (Table 7), pragmatic conventional producers report all listed barriers as ―moderate‖ or ―severe‖ at rates of over 75%. They are most concerned about availability of organic processing facilities, lack of understanding of organic production methods, high input costs and availability of organic inputs. Fertility-related and weather-related production losses are the least barriers for organic adoption.
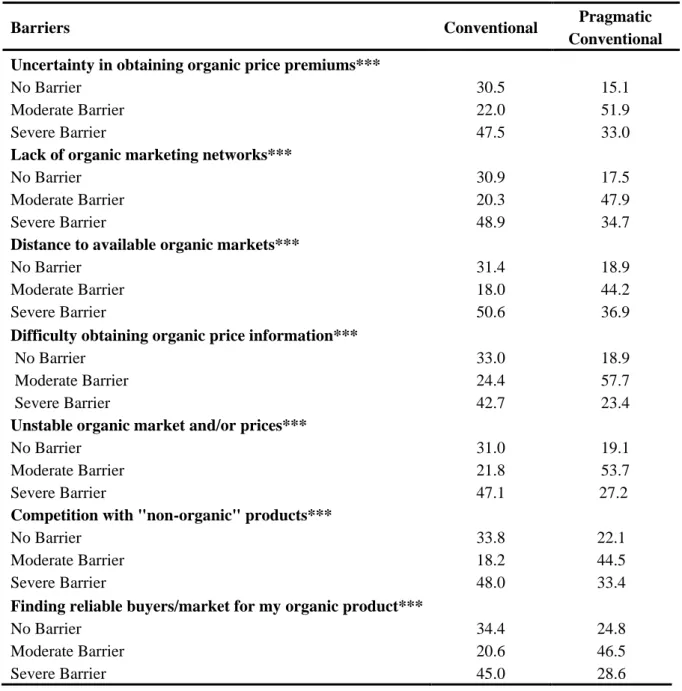
Regarding production barriers (Table 8), pragmatic conventional producers again report all listed
barriers as ―moderate‖ or ―severe‖ at rates of over 75%. They are most concerned about obtaining the organic price premium and lack of organic marketing networks. They are least concerned about finding
Table 7. Perceived Production Barriers (Percent).
Barriers Conventional Pragmatic
Conventional
Availability of organic processing facilities***
No Barrier 27.0 13.8
Moderate Barrier 15.9 38.5
Severe Barrier 57.1 47.7
Lack of understanding about organic production methods***
No Barrier 32.5 13.9
Moderate Barrier 22.5 49.5
Severe Barrier 45.0 36.6
High input costs***
No Barrier 26.0 14.4
Moderate Barrier 21.2 42.0
Severe Barrier 52.8 43.6
Availability of organic inputs (feed, fertilizer, etc.) ***
No Barrier 26.3 14.4
Moderate Barrier 22.6 46.6
Severe Barrier 51.1 39.0
Disease-related production losses***
No Barrier 26.1 18.6
Moderate Barrier 20.8 44.2
Severe Barrier 53.1 37.2
Pest-related production losses***
No Barrier 25.0 19.2
Moderate Barrier 20.3 40.7
Severe Barrier 54.7 40.1
Weed-related production losses***
No Barrier 27.9 20.3
Moderate Barrier 18.6 39.7
Severe Barrier 53.5 40.0
Weather-related production losses***
No Barrier 27.1 22.1
Moderate Barrier 25.7 44.9
Severe Barrier 47.2 33.0
Fertility-related production losses***
No Barrier 31.0 26.2
Moderate Barrier 22.4 46.9
Severe Barrier 46.6 26.9
Table 8. Perceived Market Barriers (Percent).
Barriers Conventional Pragmatic
Conventional
Uncertainty in obtaining organic price premiums***
No Barrier 30.5 15.1
Moderate Barrier 22.0 51.9
Severe Barrier 47.5 33.0
Lack of organic marketing networks***
No Barrier 30.9 17.5
Moderate Barrier 20.3 47.9
Severe Barrier 48.9 34.7
Distance to available organic markets***
No Barrier 31.4 18.9
Moderate Barrier 18.0 44.2
Severe Barrier 50.6 36.9
Difficulty obtaining organic price information***
No Barrier 33.0 18.9
Moderate Barrier 24.4 57.7
Severe Barrier 42.7 23.4
Unstable organic market and/or prices***
No Barrier 31.0 19.1
Moderate Barrier 21.8 53.7
Severe Barrier 47.1 27.2
Competition with "non-organic" products***
No Barrier 33.8 22.1
Moderate Barrier 18.2 44.5
Severe Barrier 48.0 33.4
Finding reliable buyers/market for my organic product***
No Barrier 34.4 24.8
Moderate Barrier 20.6 46.5
Severe Barrier 45.0 28.6
Note: Items are ranked in ascending order for the ―no barrier‖ response by conventional pragmatics. P values report significance levels for Chi-square test of producers’ perceived market barriers needs by their orientation toward organics: *p < 0.05; **p < 0.01; ***p < 0.001.
8. Discussion
Compared to their conventional counterparts, these pragmatic conventional producers tend to have been farming for a shorter time, have higher gross sales, be less satisfied with their current farming system and plan to expand their operation in the next 3 years. For the pragmatic conventional producers, an increase in revenue would be an important facilitator of organic adoption. This result is indicative of their pragmatic orientation whereby the ―tangible benefit‖ [16] of increased revenue factors into their organic adoption decision. As documented in the literature [14,36,37,62-64], early adopters tend to be more financially motivated compared to innovators.
The concerns of pragmatic conventional producers in this study regarding adopting organics are similar to their counterparts in the research by Darnhofer et al. [16] and Fairweather [15]. While the pragmatic conventional producers in Texas are not opposed to organic farming, the high levels of the
―not sure‖ response for attitudes regarding organics document the significant uncertainty surrounding
the relevant factors hindering a conversion. In particular, they express strong concerns related to uncertainty in obtaining the price premiums, lack of market development, organic regulations, and numerous other aspects related to technical and financial feasibility. Overall, about 80% of the pragmatic conventional producers report a lack of both informational and services support regarding organic production methods. Interestingly, the pragmatic conventional producers perceived more needs about the service and information support compared to the organic group. This pattern seems to be related to the high levels of uncertainty among the pragmatic conventional producers regarding organic adoption in general.
Consistent with other studies [15,22,26,36,50,51], the pragmatic conventional producers identify a variety of production and marketing barriers that constrain organic adoption. While much of the literature [15,26,36,50,51] focuses on the technical aspects of barriers, pragmatic conventional producers in this study are more concerned about structural than technical barriers. For example, the biggest production barrier is availability of organic processing facilities and the biggest marketing barrier is uncertainty in obtaining organic price premium.
The lack of farmers’ understanding and their perceived barriers can be interpreted as being a result of the unsupportive institutional setting [39,54]. As noted in the literature [36,42,43,45-49], the historical antagonism toward organics in the U.S. and the resulting market-based regulations hindered the kinds of research, marketing, and information structures and services required to facilitate organic
adoption. Faced with a lack of sufficient institutional support and high levels of uncertainty, to ―not adopt‖ was the rational decision [61]. These results capture the broader situation that the pragmatic conventional producers face in Texas.
Fortunately, the policy environment in the U.S. has changed to be more supportive of organics. The increased funding in the 2008 Farm Bill for organic research, marketing, conversion costs, and information services appears to address the needs reported by pragmatic conventional producers in Texas. The expansion of the EQIP program to provide economic subsidies during the transition period is especially valuable. The Organic Initiative’s additional $50 million in funding sends a strong signal of the Obama Administration’s support for organics. Similarly, the newly planted organic garden at the White House enhances the level of societal legitimacy for organic foods.
the entire U.S. Second, the operational definition of the organic producer group in this study differs from the official government definition. While the USDA definition of organics is based on certification, in this study the organic producer group includes certified organic, in transition to organic, and non-certified organic producers based on self-identification by respondents. As a result of the differing definitions, a higher number of organic producers are identified in this study. Although 100 producers are classified in the organic group, only 18 are certified-organic or in transition to certified organic; the remainder (82) are not-certified. Despite the limitation, this finding highlights an important issue related to the gap between the producer-level interpretations of organics and the official government definition. Considering that the goal is to support increased certified-organic adoption to better match domestic production and consumption, government interventions would be useful to encourage the non-certified producers to become certified.
The issue of organic certification requires more attention. Given that only 219 certified-organic producers were listed in Texas in 2007 [11], this research reveals a substantial pool of pragmatic conventional producers who are potential candidates for organic adoption. While it is promising that 45% of producers who currently have conventional operations—336 farmers and ranchers in this study—report an interest in organic production, it needs to be stressed that these pragmatic conventional producers in Texas are potential candidates, as a substantial proportion of them are not interested in organic certification. The very low level of knowledge related to organic certification probably influences this situation. Only 20% of the organic producers and 11% of the pragmatic conventional producers in this study report they understand the process of organic certification. To increase rates of organic certification, programs and policies targeted to organic adoption will need to be designed specifically to alleviate the uncertainty and highlight the opportunities related to adopting certified-organic production.
9. Conclusions
In an attempt to highlight how to increase the adoption of organic production methods in the U.S. and thereby close the gap between domestic production and consumption, while at the same time increasing the environmental sustainability of U.S. agriculture, this study responds to calls for research on the complex mix of institutional and individual factors that influence organic adoption. Although the NOP supported the growth of the consumer market by providing accurately identified organic products, the institutional context constrained the kinds of financial and technical support necessary to prompt sufficient numbers of conventional producers to convert. As other countries acknowledged the public benefits of organics and provided incentives for organic transition, the lack of overt government support combined with the peculiarities of the organics adoption process suppressed the diffusion of the innovation in the U.S. Due to the low adoption rate, the NOP has had a marginal impact on environmental externalities caused by conventional production methods. Similarly, as domestic demand increased, the low domestic adoption rate fostered an increase in imports. Provisions in the 2008 Farm Bill and the Organic Initiative are designed to reverse these trends.
seem to match the concerns of those farmers interested in organics, as well as address the problematic aspects of the adoption process. To efficiently tailor new organic programs to the specific needs of these pragmatic conventional producers, comparable research in other regions of the U.S. is needed to identify and accommodate geographical variations and commodity-specific farming systems. If pragmatic conventional producers are as numerous across the U.S. as they are in Texas, then the number of potential adopters may be sufficient to both close the gap between domestic demand and supply and make a significant positive impact on environmental quality. It appears that there has never been a better time to motivate farmers to convert to organic agriculture.
Acknowledgements
This research was partially funded by the United Stated Department of Agriculture, Agricultural Marketing Service (USDA/AMS), Federal-State Market Improvement Program through the Texas Department of Agriculture. The authors acknowledge the contributions of Mary York of the Texas Department of Agriculture (TDA), Roger Hanagriff in the Department of Agronomy and Resource Sciences at Texas A&M University—Kingsville, Texas and Michael Lau in the Department of Agriculture and Industrial Sciences at Sam Houston State University, Huntsville, Texas. The views expressed in this study are those of the authors and do not necessarily reflect those of the contributors, USDA/AMS, or TDA. The authors thank the three anonymous reviewers for their constructive comments that improved the quality of the paper.
References
1. Bengtsson, J.; Ahnstrom, J.; Weibull, A. The effects of organic agriculture on biodiversity and abundance: a meta-analysis. J. Appl. Ecol. 2005, 42, 261-269.
2. Dabbert, S. Measuring and communicating the environmental benefits of organic food production. Crop Manag. 2006, doi: 10.1094/CM-2006-0921-13-RV; Available online: http://www. plantmanagementnetwork.org/pub/cm/symposium/organics/Dabbert/ (accessed on 26 June 2009). 3. Hole, D.G.; Perkins, A.J.; Wilson, J.D.; Alexander, I.H.; Grice, P.V.; Evans, A.D. Does organic
farming benefit biodiversity. Biol. Conser. 2005, 122, 113-130. 4. Lotter, D.W. Organic agriculture. J. Sustain. Agr. 2003, 21, 59-128.
5. Maeder, P.; Fliessbach, A.; Dubois, D.; Gunst, L.; Fried, P.; Niggli, U. Soil fertility and biodiversity in organic farming. Science 2002, 296, 1694-1697.
6. O’Riordan, T.; Cobb, D. Assessing the consequences of converting to organic agriculture. J. Agr. Econ. 2001, 52, 22-35.
7. Environmental Facts; Organic Trade Association (OTA): Greenfield, MA, USA, 2008; Available online: http://www.ota.com/organic/environment/environment.html (accessed on 13 November 2009).
9. Greene, C.; Dimitri, C; Lin, B.; McBride, W.; Oberholtzer, L; Smith, T. Emerging Issues in the U.S. Organic Industry; Economic Information Bulletin No. 55; United States Department of Agriculture, Economic Research Service: Washington, DC, USA, 2009.
10. Oberholtzer, L.; Dimitri, C.; Greene, C. Price Premiums Hold on as Organic Producer Markets Expands; Outlook Report VGS-308-01; USDA/ERS: Washington, DC, USA, 2005.
11. Organic Production: Overview; USDA/ERS: Washington, DC, USA, 2009; Available online: http://www.ers.usda.gov/Data/Organic (accessed on 14 October 2009).
12. Industry Statistics and Projected Growth; Organic Trade Association: Greenfield, MA, USA, 2008; Available online: http://www.ota/com/organic/business.html (accessed on 14 March 2009). 13. Organics Today: Who’s Buying and What’s Next; Hartman Group: Bellevue, WA, USA, 2008;
Available online: http://www.hartman-group.com/hartbeat/2008-07-23 (accessed on 26 June 2009).
14. Padel, S. Conversion to organic farming: a typical example of the diffusion of an innovation? Sociol. Ruralis. 2001, 41, 40-61.
15. Fairweather, J.R. Understanding how farmers chose between organic and conventional production: results from New Zealand and policy implications. Agric. Human Values 1999, 16, 51-63.
16. Darnhofer, I.; Schneeberger, W.; Freyer, B. Converting or not converting to organic farming in Austria: farmer types and their rationale. Agric. Human Values 2005, 22, 39-52.
17. Organics markets overview. Nutr. Bus. J. 2008, March/April, 13.
18. Willer, H.; Kilcher, L. The World of Organic Agriculture: Statistics and Emerging Trends 2009; FIBL-IFAOM Report; IFOAM: Bonn, Germany; FIBL: Frick, Switzerland; ITC: Geneva, Switzerland, 2009.
19. Guthman, J. Agrarian Dreams: The Paradox of Organic Farming in California; University of California Press: Berkeley, CA, USA, 2004.
20. Aschemann, J.; Hamm, U.; Naspetti, S.; Zanoli, R. The organic market. In Organic Farming: An International History; Lockeretz, W., Ed.; CABI International: Oxford, UK, 2007; pp. 123-151. 21. Dimitri, C.; Greene, C. Recent Growth Patterns in U.S. Organic Foods Market; Agriculture
Information Bulletin No. AIB777; USDA/ERS: Washington, DC, USA, 2002.
22. Heller, L. Organic undersupply stunts market growth, OTA. FoodNavigator-USA.com, 14 November 2007; Available online: http://ofrf.org/pressroom/organic_news_clips/071114_ foodnav_organicundersupply.pdf. (accessed on 14 March 2009).
23. Global Organic Agriculture: Continued Growth; International Federation of Organic Agriculture Movements (IFOAM) News/Press: Bonn, Germany, 2008; Available online: http://www. ifoam.org/press/press/2008/Global_Organic_Agriculture_Continued_Growth.php (accessed on 14 March 2009).
24. The Global Market for Organic Food & Drink: Business Opportunities & Future Outlook; Research Publication #7002-40; Organic Monitor: London, UK, 2006; Available online: http://www.organicmonitor.com/700240.htm (accessed on 14 March 2009).
26. Final Report of the 1995 National Organic Farmers’ Survey; Organic Farming Research Foundation: Santa Cruz, CA, USA, 1996.
27. Dimitri, C.; Richman, N. Organic Food Markets in Transition; Wallace Center Policy Studies Report No. 14; Winrock International: Arlington, VA, USA, 2000.
28. The Organic Trade Association’s 2006 Manufacturer’s Survey; Organic Trade Association: Greenfield, MA, USA, 2006; Available online: http://www.ota.com (accessed on 14 March 2009). 29. Greene, C. U.S. organic farm sector continues to expand. Amber Waves, April 2006; Available online: http://www.ers.usda.gov/AmberWaves/April076/Findings/Organic.htm (accessed on 14 March 2009).
30. Tringe, J.M. U.S. Market Profile for Organic Food Products; USDA Foreign Agricultural Service: Washington, DC, USA, 2005; Available online: http://www.fas.usda.gov/agx/organics/ USMarketProfileOrganicFoodFeb2005.pdf (accessed on 14 March 2009).
31. Thilmany, D. The U.S. Organic Industry: Important Trends and Emerging Issues for USDA; Agribusiness Marketing Report No. ABMR 06-01; Department of Agricultural and Resource Economics, Colorado State University: Fort Collins, CO, USA, 2006.
32. Batte, M.T.; Hooker, N.H.; Haab, T.C.; Beaverson, J. Putting their money where their mouths are: consumer willingness to pay for multi-ingredient, processed organic food products. Food Policy 2007, 32,145-159.
33. Molyneaux, M. The changing face of organic consumers. Food Techol.-Chicago 2007, 61, 22-26. 34. DiMatteo, K.; Gershuny, G. The Organic Trade Association. In Organic Farming: An
International History; Lockeretz, W., Ed.; CABI International: Oxford, UK, 2007; pp. 253-263. 35. Lockeretz, W. What explains the rise of organic farming? In Organic Farming: An International
History; Lockeretz, W., Ed.; CABI International: Oxford, UK, 2007; pp. 1-8
36. Lohr, L.; Salomonsson, I. Conversion subsidies for organic production: results from Sweden and lessons for the United States. Agr. Econ. 2000, 22, 133-146.
37. Padel, S.; Lampkin, N.H. The development of governmental support for organic farming in Europe. In Organic Farming: An International History; Lockeretz, W., Ed.; CABI International: Oxford, UK, 2007; pp. 93-122.
38. Lampkin, N; Stolze, M. European action plan for organic food and farming. Law Sci. Policy 2006, 3, 59-73.
39. Stolze, M.; Lampkin, N. Policy for organic farming: rationale and concepts. Food Policy 2009, 34, 237-244.
40. Michelsen, J.; Lynggaard, K.; Padel, S.; Foster, C. Organic farming development and agricultural institutions in Europe: a study of six countries. In Organic Farming in Europe, Economics and Policy; University of Hohenheim: Stuttgart-Hohenheim, Germany, 2001; Vol. 9.
41. Padel, S.; Lampkin, N.H. Conversion to organic farming: an overview. In The Economics of Organic Farming: An International Perspective; Padel, S., Lampkin, N.H., Eds.; CABI International: Oxford, UK, 1994; pp. 295-313.
43. Lipson, M. Search for the O-Word; Organic Farming Research Foundation: Santa Cruz, CA, USA; 1997.
44. USDA. Report on Recommendations on Organic Farming; US Government Printing Office: Washington, DC, USA, 1980.
45. Madden, J.P. The Early Years of LISA, SARE, and ACE Programs: Reflections of the Founding Director—Conception; Western Region USDA Sustainable Agriculture Research Education Program, Utah State University: Logan, UT, USA, 1998; Available online: http://wsare.usu.eud/ about/index/cfm?sub=hist_concept (accessed on 11 November 2006).
46. Lacy, W.B. Can agricultural colleges meet the needs of sustainable agriculture? Am. J. Alternative Agr. 1993, 8, 40.
47. Final Report of the Third Biennial National Organic Farmers’ Survey; Organic Farming Research Foundation: Santa Cruz, CA, USA, 1999.
48. Wheeler, S.A. What influences agricultural professionals’ views towards organic agriculture? Ecol. Econ. 2008, 65, 145-154.
49. Larson, K.; Duram, L. Information dissemination in alternative agricultural research: an analysis of researchers. Am. J. Alternative Agr. 2000, 15, 171-180.
50. Schneeberger, W.; Darnhofer, I.; Eder, M. Barriers to the adoption of organic farming by cash crop producers in Austria. Am. J. Alternative Agr. 2002, 17, 24-31.
51. Blobaum, R. Barriers to conversion to organic farming practices in the Midwestern United States. In Environmentally Sound Agriculture; Lockeretz, W., Ed.; Praeger Press: New York, NY, USA, 1983; pp. 263-278.
52. Volpe, R.J. Exploring the potential effects of organic production on contracting in American agribusiness. In Proceedings of the American Agricultural Economics Association Annual Meeting, Long Beach, CA, USA, 23–26 July 2006.
53. Dimitri, C.; Oberholtzer, L. Market-Led versus Government-Facilitated Growth: Development of the U.S. and EU Organic Agricultural Sectors; Outlook Report No. WRS-05-05; USDA/ERS: Washington, DC, USA,2005.
54. Michelsen, J. Recent development and political acceptance of organic farming in Europe. Sociol. Ruralis 2001, 41, 3-20.
55. USDA. 1997 Iowa EQIP Conservation Practices; Natural Resources Conservation Service and Farm Service Agency:Washington, DC, USA, 1997.
56. Organic Farming Research Foundation Applauds Bill Victories for Organic Farmers and Ranchers; Organic Farming Research Foundation: Santa Cruz, CA, USA, 2008. Available online: http://www.ofrf.org/pressroom/releases/080527_farm-bill-victories.html (accessed on 14 March 2009).
57. Agriculture Deputy Secretary Merrigan Announces Funding for New Organics Initiative; USDA News Release No. 0146.09; USDA Office of Communications: Washington, DC, USA, 2009. 58. Rogers, E.M. Diffusion of Innovations; The Free Press: New York, NY, USA, 1983.
60. Kuminoff, N.; Wossink, A. Valuing the option to convert from conventional to organic farming. In Proceedings of the American Agricultural Economics Association Annual Meeting, Providence, RI, USA, 24–27 July 2005.
61. Vanclay, F.; Lawrence, G. Farmer rationality and the adoption of environmentally sound practices: a critique of the assumptions of traditional agricultural extension. Eur. J. Agr. Educ. Ext. 1994, 1, 59-90.
62. Costa, L.; Sottomayor, M.; Ribiero, R. Conversion to Organic Farming in Mainland Portugal; Economic Working Paper No. 10; Portuguese Catholic University: Porto, Portugal, 2008.
63. Freyer, B.; Rantzau, R.; Vogtmann, H. Case studies of farms converting to organic agriculture in Germany. In The Economics of Organic Farming: An International Perspective; Padel, S., Lampkin, N., Eds.; CABI International: Oxford, UK, 1994; pp. 243-263.
64. Rigby, D.; Young, T.; Burton, M. The development of and prospects for organic farming in the UK. Food Policy 2001, 26, 599-613.
65. Schoon, B.; Te Grotenhuis, R. Values of farmers, sustainability, and agricultural policy. J. Agr. Environ. Ethic. 2000, 12, 17-27.
66. Koesling, M.; Flaten, O.; Gudbrand, L. Factors influencing the conversion of organic farming in Norway. Int. J. Agr. Resour. Govern. Ecol. 2008, 7, 78-95.
67. York, M.; Lau, M.H.; Hanagriff, R.D.; Constance, D.H. Identifying Barriers to Entry into the Organic Market and Possible Strategies to Increase the Likelihood of Success for Potential Organic Producers; Final Report; Sam Houston State University: Huntsville, TX, USA, 2007. 68. Constance, D.H.; Choi, J.Y.; Lyke-Ho-Gland, H. Conventionalization, bifurcation, and quality of
life: a look at certified and non-certified organic farmers in Texas. South. Rural. Sociol. 2008, 23, 208-234.