Intellectual productivity under task ambient lighting
H Ishii PhDa, H Kanagawa MSca, Y Shimamura MSca,K Uchiyama MSca, K Miyagi MSca, F Obayashi PhDband H Shimoda PhDa
a Graduate School of Energy Science, Kyoto University, Kyoto, Japan b Panasonic Corporation Eco Solutions Company, Kadoma, Japan
Short title: Concentration and task ambient lighting
Received 24 March 2016; Revised 28 May 2016; Accepted
A subjective experiment was conducted to evaluate intellectual productivity in three lighting conditions: (a) conventional ambient lighting, (b) task ambient lighting with normal colour temperature (5000 K), and (c) task ambient lighting with high colour temperature (6200 K). In the experiment, cognitive tasks were given to 24 participants. The concentration time ratio, which is a quantitative and objective evaluation index of the degree of concentration, was measured. The results showed that the average
concentration time ratio under the task ambient lighting with high colour temperature was 72.5% which was 5.0% points higher than that under the conventional ambient lighting. It is believed that intellectual work can be performed better when the concentration time ratio is high
Address for correspondence:
Hirotake Ishii, Graduate School of Energy Science, Kyoto University, Yoshida Honmachi, Sakyo-ku, Kyoto-shi, Kyoto-fu, 606-8501, Japan
Task ambient lighting can reduce energy consumption by combining a low uniform lighting system and a local lighting system instead of conventional uniform lighting systems while maintaining the light levels around working spaces. Previous studies1,2 have revealed that task ambient lighting is also effective in increasing worker
satisfaction and productivity. However, evaluations in previous studies were based mainly on questionnaires (subjective evaluation) and/or simulated office tasks, which might be greatly affected by a learning effect3.
The present study examined two forms of task ambient lightings in comparison to conventional ambient lighting using the concentration time ratio (CTR), which is a quantitative and objective evaluation index proposed in one of the authors' previous studies4. The CTR represents the ratio of the time spent truly concentrating on a task over
the total time spent for completing the task rather than the amount of the achievement (e.g. the number of processed tasks per minute). Therefore, it is difficult for CTR to be affected by the learning effect, which means that it is possible to distinguish the performance change induced by the environmental change from that induced by a
learning effect. Furthermore, it is expected that intellectual work can be performed better when the concentration time ratio is high. Therefore, intellectual productivity can be measured indirectly by CTR. Here, intellectual productivity is defined as the amount of intellectual output during a certain period of time, which is producible by knowledge processing rather than by a simple response or muscular labour.
The contribution of this paper is to demonstrate the improvement of workers' intellectual productivity by introducing task ambient lighting, quantitatively and
objectively. This has been difficult, heretofore, because no means have been available to measure intellectual productivity objectively in a quantitative manner with the learning effect cancelled.
2.
Evaluating intellectual productivity
As Ramírez5 noted, "there are no universally accepted methods to measure
universally8-11. Ilgen6 classified evaluation methods of productivity into three categories;
physiological, objective, and subjective. Wyon7 further classified objective and subjective
methods into six categories: (1) Simulated work (subject performs a realistic but artificial task), (2) Diagnostic tests (subject performs a test procedure unlike any real task), (3) Embedded tasks (outcome metric derived from part of an existing task), (4) Existing measures (existing outcome metrics are made available), (5) Absenteeism (new or existing records of sick leave are used), and (6) Self-estimates (subjects report their own perceived level of efficiency). All evaluation methods have their respective benefits and shortcomings.
2.1 Physiological method
The physiological method measures one or more of the subjects' physiological indices such as heart rate12, electrodermal activity13, and cerebral blood flow14. This
method is based on an assumption that the physiological measures have some relation to nervous system activity. Although this method can measure phenomena objectively, sensors such as a heart rate monitor, electrodes, or near-infrared spectroscopy must be prepared, which might restrict subjects' movement. Furthermore, some sensors require constant vigilance by experimenters during the measurement. It is also problematic that physiological responses are sensitively affected by many factors simultaneously. For instance, heart rate is affected not only by environmental factors such as temperature15
but also by subject’s personal characteristics16. Therefore, as Jin noted11, "an extremely
stable and well controlled experimental environment is required in order to obtain
reliable data".
2.2 Simulated work
When using the simulated work method, specially designed tasks are performed. The task performance (e.g. number of performed tasks) is measured. Typically, text typing17-23, arithmetical calculation (addition and/or multiplication)17-19, proof-reading
tasks17,20-22,24, summary extraction etc.23 have been used. To evaluate intellectual
resemble actual office work, which means that the task must become rather complex. However, complex tasks tend to be affected by a learning effect. A longer practice session is necessary for complex tasks to reach saturation compared to simple tasks25,26.
Therefore, it is necessary to cancel the learning effect to evaluate slight effects induced by environmental change. A possible method to cancel the learning effect is to design the experiment in a manner in which participants are divided into multiple groups. Each group is presented to different conditions in a different order. However, the speed of learning varies from person to person27,28. Therefore, the number of participants must be
large to obtain statistically significant result. Another possible method is using the learning curve to compensate the learning effect. However, a long-term experiment is necessary to deduce and compensate the learning effect29.
2.3 Diagnostic tests
Several kinds of diagnostic tests have been designed to measure specific abilities or disorders. Some of them are the SPES test30, the Continuous Performance Test31, and
the Dynamic Visual Acuity Test32. The SPES test is a computerized psychological test
battery that consists of several simple performance tests such as simple reaction time, choice reaction time, and colour word vigilance30. The Continuous Performance Test is a
computerized neuropsychological test that consists of visual and auditory tests to assess attention-related problems31. The Dynamic Visual Acuity Test is a test that measures eye
gaze stabilization during head movement32. The diagnostic test was used to measure the
influence of environmental change33. However the tests fundamentally consist of simple
primitive tasks intended to be used to measure specific abilities or disorders and are much different from real office work as its definition represents. No report in the literature describes a study showing the association between diagnostic test performance and intellectual productivity.
2.4 Embedded tasks
outcomes can be measured quantitatively. For instance, Wyon et al evaluated the effects of negative ionization by embedding measureable driving-related tasks, such as
responding to an alert, into a regular driving task34. Wargocki et al embedded exercises
such as reading or mathematics into normal school work to evaluate the effect of air temperature and ventilation rate in the classroom35. Embedded tasks are acceptable for
workers because they can conduct the tasks in the same way as their ordinary work. However, similarly to existing measures described later, the number of relevant works is limited.
2.5 Existing measures
In some cases, productivity can be evaluated directly using existing measures. For instance, Fisk et al evaluated worker performance using the number of processed calls at a call center36. Mas et al evaluated worker productivity using the check-out speed of
cashiers and investigated how workers influence each other37. In this way, productivity
can be evaluated quantitatively and objectively using existing measures but only in some cases. Quantitative measures are not always available. Applicable works are few.
2.6 Absenteeism
Absenteeism is a rate or period of absence from work or other regular duty38,39.
Because absenteeism is a habitual pattern of absence, the measurement is usually
conducted over a long period such as months or a year40,41. Therefore, absenteeism is not
an adequate measure to be applied to a comparison of tentative environments, which are available during limited time periods.
2.7 Self-estimates
Self-estimates or Subjective Productivity Measurement (SPM) is a measurement approach that collects information related to productivity through a questionnaire or an interview42. The self-estimates are widely applicable in various works. The results can be
“people are generally inaccurate in predicting their performance". Moreover, as Seppanen commented44, self-estimates may be influenced by subjects' expectations or
biases. For instance, Clausen et al reported that self-evaluated performance improvements of simple proofreading and addition tasks induced by reducing dissatisfaction about the environment is much greater than actual improvements45.
Therefore, experiments must be designed carefully to omit biases and expectations, which are difficult to omit if environments are changed drastically because the apparent environmental change makes it easy for subjects to notice the objectives of experiments.
3.
Quantitative evaluation by concentration time ratio
3.1 Cognitive state transition model
The Concentration Time Ratio (CTR) is calculated from the answering times to a receipt classification task (see Section 3.2). When performing a task that contains
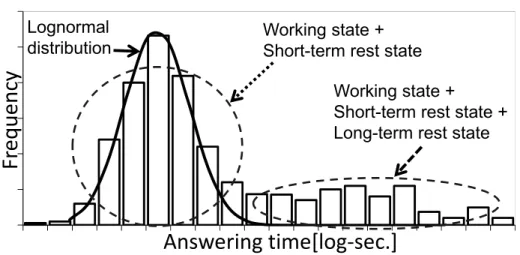
problems of equal difficulty, the answering times must be fundamentally equal. However, the actual histogram of the answering times has a wide distribution, as shown in Figure 1. One possible cause of the distribution is a phenomenon called blocking, defined by Bills46 as "a pause in the responses equivalent to the time of two or more average
responses". The phenomenon was explained by Bills as "periods, experienced by mental workers, when they seem unable to respond, and cannot, even by an effort, continue until
Gamma distributions47. Moreover, when the probabilities of the state transitions between
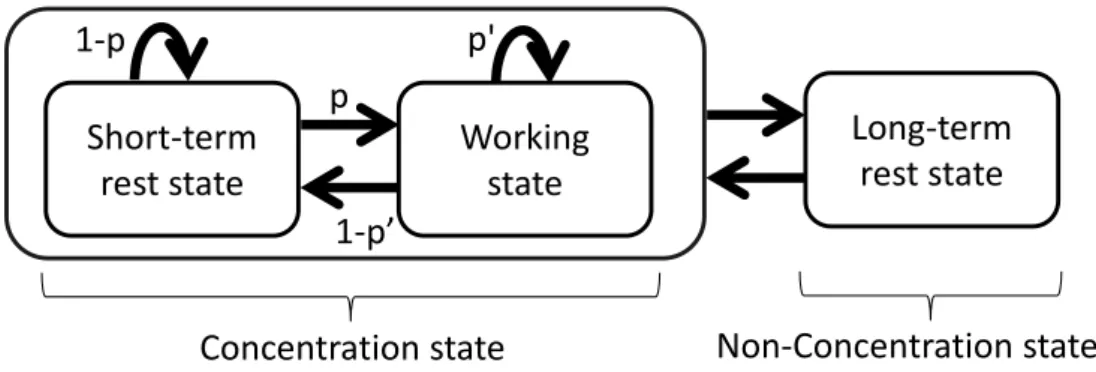
the working state and the short-term rest state are assumed to be a fixed value, the model can be regarded as a two-state Markov model. The probability distribution of a two-state Markov model can be expressed using a lognormal distribution. Therefore, it would be reasonable to assume that the left part of the distribution originates from the transition between the working state and the short-term rest state. However, the existence of the right long tail of the distribution, which appears more clearly when a higher level of the cognitive task is conducted for a longer time, cannot be explained by the two-state transition model alone. We therefore infer the existence of another state: long-term rest state. In the long-term rest state, subjects consciously stop the task to take a break or think about other things rather than continue the task for a long period. Summarizing the above, we assume that the workers perform cognitive tasks while switching between a working state, a short-term rest state, and a long-term rest state as shown in Figure 2. The validity of this three-state transition model was confirmed experimentally in our previous study48. That study confirmed that simulated answering times based on the three-state
transition model matched the actual results of answering times for receipt classification task well.
Figure 1. Histogram of answering times and a lognormal distribution.
F
euey
A swe i g ti e[log‐se .]
Working state + Short-term rest state
Working state +
Short-term rest state + Long-term rest state Lognormal
Figure 2. The work state model.
Considering that concentration is a work state in which cognitive resources are assigned to the target task, it can be assumed that the working state and the short-term rest state are concentrating states, whereas the long-term rest state is a non-concentrating state. The right distribution of the histogram includes not only the working state and the short-term rest state, but also the long-term rest state, whereas the left distribution of the histogram expresses the sum of the working state and the short-term rest state. Therefore, it can be inferred that the distribution of the concentrated state can be approximated as the following lognormal distribution (Figure 1).
f t √ exp (1)
Here, t, exp μ and σ denote the answering time for one problem, the median, and the standard deviation of the lognormal distribution, respectively. The lognormal
distribution is a two-parameter distribution for which the logarithm is normally
distributed. Figure 3 depicts how parameters μ and σ affect the distribution. Intuitively speaking, μ and σ are relatively related to the median and width of the distribution, but they are different from a normal distribution. Values which represent the distribution’s character cannot be expressed using the simple variables of equation (1). For example, the lognormal distribution’s average f̅ and median f are calculated respectively using equations (2) and (3).
Wo ki g
state
Sho t‐te
est state
Lo g‐te
est state
Co e t atio state
No ‐Co e t atio state
‐p’
p
f̅ exp μ (2)
f exp μ (3)
By fitting equation (1) to the left distribution of the histogram, μ and σ can be estimated assuming that the near left end of the distribution includes only the answering times of problems for which the worker answered without staying in the long-term rest state. Therefore, if a lognormal distribution is fitted to the near left end of the distribution, then the goodness of the fit will be extremely high. Consequently, the lognormal
distribution is fitted according to the steps below48:
Step 1. Sort the answering times in ascending order.
Step 2. Compute a cumulative distribution curve of the sorted answering times and normalize the curve so that the maximum of the curve is 1.0, thereby making it easy to compare the answering time distribution and lognormal function. Step 3. Fit a normalized cumulative function of lognormal form to the cumulative
distribution curve computed in the Step 2 using the least squares method, then calculate the correlation coefficient between the function and the curve. Step 4. Remove the first (longest) answering time from the sorted answering times. Step 5. Repeat from Step 2 to Step 4 until the remaining number of answering times
reaches the threshold τ chosen in advance.
Step 6. Obtain μ and σ of the fitted lognormal function when the correlation coefficient calculated in Step 3 is the largest.
The threshold τ used at the Step 5 should be chosen according to the time duration allocated to one task set. For this study, we set the threshold to 20, which will be the minimum number of answered problems when it is regarded that the worker tackles the task seriously even if they are extremely exhausted.
CT
N is
conc perf CTR Figu prob perf expr will 3.2 C and clas to th
exp μ
The tota the number centration ti forming time
R ∙
ure 3. Logn Because blem solving formance alo resses the tim
not be affec
Cognitive t To meas measure the sification ta he following )
al time used r of problem ime ratio CT
e is .
normal distri e task perfor g by learnin one. The CT me ratio of cted much b
task used fo
sure CTR, it e answering ask was prep g requiremen
d for the con ms they answ
TR is calcula
ibutions wit rmance (ans ng, it is diffi
TR, howeve the concent by learning.
or measurin
t is necessar g time used
pared4. The
nts:
ncentration s wered when ated using e
th one varyi swering spe cult to evalu er, is unaffec tration state
ng CTR
ry to presen for each pro
receipt clas (4)
state can be n performing
equation (5)
(5)
ng paramete ed) is impro uate intellec cted by learn
in the total
nt a number oblem. For t ssification ta
expressed a g the task. T , where the
er.
oved by repe ctual produc
ning becaus task perform
of problems this purpose ask was desi
as N ∙ CT, w
Therefore, th total task
eating the ctivity by ta se it only
ming time, w
s to particip e, a receipt
1. The problems can be processed continuously at the participant's own pace. 2. The problems should have equal difficulty.
3. The strategy used to solve the problems will not change during the evaluation. 4. The problems are solvable by a rule-based response to imitate actual office work
rather than by a simple response.
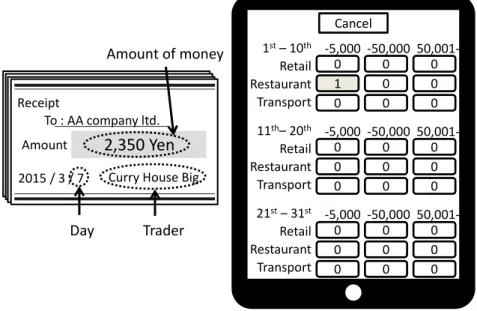
Figure 4 shows the receipt classification task prepared for measuring the CTR. The participant was asked to classify receipts printed on paper into one of 27 categories by the day when the receipt was printed: "1st - 10th", "11th - 20th", and "21st - 31st", the type of trader by which the receipt was printed: "Retail", "Restaurant", and "Transport" and the amount of money: 0 - 5000 Yen, 5001 - 50,000 Yen, and more than 50,001 Yen. Each participant was required to answer the proper category by pressing one of 27 buttons on an iPad display. The answering time of each problem is measured as the time interval between the button presses on the iPad, and sent to a server computer where the answering times are recorded. The answering time therefore includes not only the time necessary to classify the receipt but also the time necessary to turn the papers.
Figure 4. Receipts classified by participants (left) and the interface to be used to input the classified results (right).
Re eipt
To : AA o pa y ltd. A ou t
/ / Cu y House Big
, Ye
Day T ade
A ou t of o ey
Ca el
st– th
Retail Restau a t T a spo t
th– th
Retail Restau a t T a spo t
st– st
Retail Restau a t T a spo t
‐ , ‐ , , ‐
‐ , ‐ , , ‐
4.
M
com colo temp colo Norm illum Norm Furt Task Figu FiguMethod
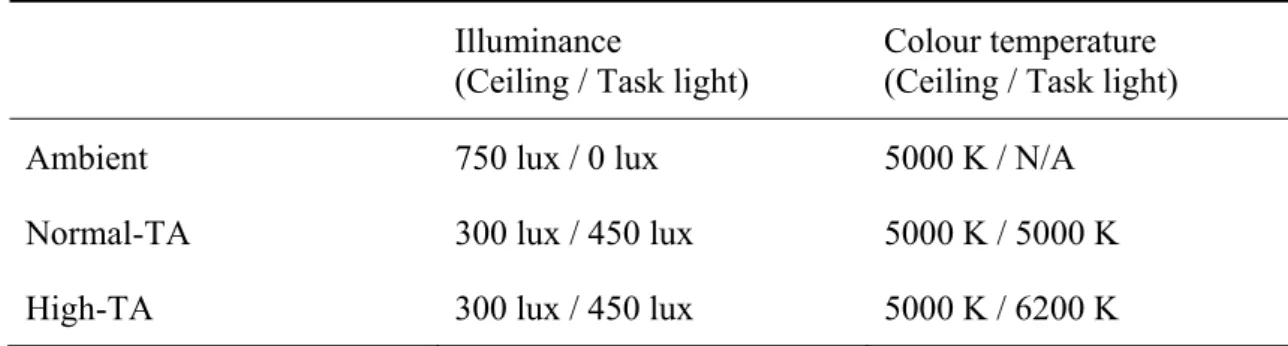
The ligh mbination of our temperat perature (Hi our temperat mal-TA con minance of a mal-TA and thermore, it k Ambient c ure 5, therebure 5. The d
hting conditi f convention
ture (Norma igh- Task A ture of the ta ndition, whi
all the cond d High-TA c
is expected conditions b by eliminatin
desktop in th
ions examin nal ceiling li
al-Task Amb Ambient (TA
ask lighting ich aims at t ditions is 750
conditions i d that the wo
because the ng the surro
he High-Tas
ned were co ighting and t
bient (TA)) A)), as show g in the High
the effect of 0 lux on the is only 59% orkers can c
room area e ounding visu
sk Ambient
onventional task lighting , and that w wn in Tables
h-TA condit f awakening e desk, the e of that of th oncentrate b except for th
ual noise.
condition.
ceiling light g with norm with high cor 1 and 2. Th tion is highe g49,50. Althou
nergy consu he Ambient better on the he desk is da
ting (Ambie mal correlate rrelated colo he correlated er than that ugh the umption of t t condition.
eir tasks in t ark, as show
Figure 6 shows the experimental procedure. The experiment was conducted for four consecutive days: Monday-Thursday. The first day was mainly for the introductory explanation, the practice of the receipt classification, and the dummy task. As the dummy task, the participants were asked to conduct a word classification task, which is a task to classify words printed on paper into one of 27 categories by the sort of character, the first vowel, and meaning. The word classification task is not adequate to be used for
measuring CTRs because the difficulty varies according to the knowledge of the
participants. The task was therefore used as the dummy task in the experiment. Each day was divided into four sets: one set was conducted in the morning; three sets were
conducted in the afternoon. Lunch rest was allocated between SET1 and SET2. 10 minute rests were also allocated between SET2 and SET3, and SET3 and SET4. SET1, SET2, and SET3 were composed of the receipt classification task (30 minutes), 3 minutes rest, and a dummy task (30 minutes) performed to avoid boring the participants with the receipt classification task. The CTRs were calculated for the receipt classification task of SET1, SET2, and SET3. Questionnaire responses were given (the results are not
Figu was The the l "Ple spee to in and July floo To s and room
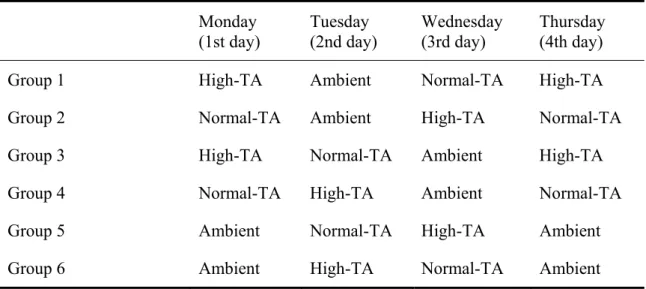
ure 6. Exper In this e colour-blin order of the lighting con ease keep pa
ed. Perform ngest any ca
lunch were y through 5 S
r area of 55 simulate an posters to s m were shad
rimental pro experiment, nd. They we e lighting co nditions, as s ace so that y
the work as affeine such served duri September i m2). Figure
office envir simulate boo ded. The roo
ocedure. 12 men and re divided i ondition wa shown in Ta you can con
s accurately as tea or co ing the expe in 2013 in a e 7 depicts t ronment, som okshelves w om temperat
d 12 women into six grou as counterba
able 3. The p ntinue the wo
y as possible offee during eriment. The an experimen
the experim me books w were pasted o ture was set
n aged 30-53 ups (four pa alanced to el participants ork from 9 a
e." Participa g the experim
e experimen ntal room at mental room
were placed on the partit t to 26 1
3 years parti articipants in liminate the s were told t a.m. to 7 p.m ants were al ment. The b nt was condu
t Kyoto Uni in the Amb in front of e tions. All w
. Humidity
icipated. No n each group e order effec
the followin m. at the sam
so instructe everage (wa ucted from iversity (wit ient conditio each particip indows in th was set to
70 to le Figu
5.
R
show The distr one perf norm cond answ omit10%. The C ess than 55 d
ure 7. Exper
Results an
Of 24 pa wed that one results of o ribution stab
participant formance in
Figure 8 mal distribut dition) and o wering time
tted three pa
CO2 concent
dB. rimental env
nd discuss
articipants, e participan one participably. In addit in Group 6 the Task A
8 shows the tions (dotted on Tuesday
s. The minim articipants w
tration was
vironment (
sion
three partic nt in Group 5
ant in Group tion, it was
noticed the Ambient cond
distribution d line) of Su (High-TA c mum correl was 0.98, w
kept to less
(Ambient co
ipants were 5 misunders p 2 could no found by co experiment dition intent
ns of answer ubject 12 in condition). lation coeffi hich shows
s than 800 pp
ondition).
e omitted fro stood the rul ot be fitted w onversation
t objective a tionally.
ring times (b n Group 3 on These are ty icient among
a high good
pm. The no
om analyses les for class with the logn
with the exp and tried to
bar chart) an n Wednesda ypical distri g all SETs e dness of fit.
ise level wa
s because re sifying recei
normal perimenter t
produce bet
nd fitted log ay (Ambient ibutions of t except for th
Figu rece conf test The from four stati day. resu effec mea day that decr the t
ure 8. Answ funct condi Figure 9 eipt classific firmed using
revealed a s change of p m the change rth day. The istically sign . The effect ults were 0.7 ct size of 0. ans that the C
does not ch for the first reases as the task is optim
wering time tion (dotted
ition. 9(a) presents cation task f
g Kolmogor statistically productivity e by the lear e same analy nificant diff
size of the p 712 and 0.13 712 as a lar CTR was un hange much, t day, which e participant mized.
distribution line) in (a)
s the task pe for the first d rov-Smirnov significant y by the chan
rning effect ysis as that s ference was performanc 39, respectiv rge effect, an naffected by , although th h implies tha ts become f
n for one sub Ambient co
erformance day and fou v tests. As t difference c nge of the li t. Figure 9(b shown in Fi
found betw e and CTR vely, for per nd the effec y a learning he performa at the time s familiar with
bject (bar ch ondition and
(number of urth day. The
the figure sh caused by th ighting cond b) presents t
gure 9(a) w ween the resu
were calcul rformance a ct size of 0.1 effect. The ance for the spent concen h the task, a
hart) and fitt d (b) High-T
f answers pe e distributio hows, the on he learning dition is ind the CTR for was done for
ults for first lated using C and CTR. W 139 as a sma CTR for fir fourth day ntrating for and the proc
ted lognorm Task Ambien
er minute) o on normality
ne-tailed pai effect (p < 0 distinguishab r first day an
the CTR, b t day and fou
Cohen’s d. T We interpret
all effect, w rst day and f
is higher tha each proble edure to pro
Figu perf was repe Kolm norm anal Amb party by w filte do n assu occu exte pres alloc of co reso
ure 9. Mean ratio Figures formance (m
found in th eated measu mogorov-Sm mality. The lysis. Impro bient condit y effect of v which a pers
ring out oth not devote at uming that w urring aroun ended to visi sented to una
cated to a gr ognitive res ources can b
n scores and of receipt c 10 and 11 r mean answer he mean answ ures ANOVA mirnov test Normal-TA ved concent tion because vision. The son can reco her noise, or ttention inte we always sp nd us52. Shap
ion53. They
attended vis reat degree sources. By e allocated
d standard de lassification respectively
ring time), r wering time A (Figure 1
(p < 0.05) t A condition w
tration is ex e the focuse
cocktail par ognize perso r in which w entionally to pend some c piro et al re
showed tha sual stimuli.
when we se contrast, wh to the target
eviations fo n task for th y show CTR respectively es among th 1). CTR in t that was app was therefo xpected in th
d TA lightin rty effect for onally mean we notice per
o the conver cognitive re eported that at our names . This fact im ee many obj
hen we see t task and w
or performan he first day a Rs in the thre y. No statisti hree lighting the Normal-plied to conf re omitted f he High-TA ng will be a r hearing is ningful word rsonally me rsation51. Th
esources unc the cocktail s can be reco
mplies that ects. They w only a few o will increase
nce and con and the four ee lighting c ically signif g conditions
-TA conditi firm the dist from the fol A conditions able to reduc a well-know ds from a co eaningful wo
his ability is consciously l party effec ognized eve cognitive re will affect o objects, mor e the concen
ncentration t rth day. conditions an ficant differe
using one-w ion did not p
tribution llowing stati
compared t ce the cockt wn phenom onversation ords even if s explained b
for the target task. Therefore, the one-tailed paired t-test was used for the comparison of the High-TA condition and the Ambient condition. The results showed that the CTR in the High-TA condition was 5.0% points higher than that of Ambient condition with a statistically significant difference (p < 0.01).
No parametric statistically significant difference was shown between the Normal-TA and High-Normal-TA, but the average of CTR in the High-Normal-TA condition is larger than that in the Normal-TA condition (1.6% points). These results are in line with previous studies in which more primitive tasks were used to evaluate the participants’ performance.
Regarding the task ambient lighting, Newsham et al showed that task lighting improves performance of the text typing task in which participants retype passages from printed originals to the computer, and a vigilance task in which participants simply respond to events as soon as possible2. Veitch et al also reported that when task lighting
is employed with direct and indirect lighting, speed may increase for the proofreading task in which participants find different characters by comparing lines that include upper case letters, lower case letters, and numbers54.
However, Boyce et al reported that illuminance distribution does not affect performance directly for the vision test (participants report whether they can see targets drawn on computer screen with various contrast, or net), vigilance test (participants respond to a random prompt as soon as possible), and cognitive judgements (participants rate accuracy of a passage summary)55. A possible reason that the effect of illuminance
distribution variance was small in the Boyce et al experiment is that the illuminance distribution variance between workspace and surrounding was smaller than that in our experiment. Participants were able to control the illuminance of lighting in the Boyce et al experiment but were unable to control it in our experiment.
Regarding colour temperature, Lehrl et al showed that blue light improves performance on simple reading aloud task compared to normal light56. Lockley et al
showed that blue light significantly reduce subjective sleepless rating, auditory reaction time, and attentional failures57. Deguchi et al demonstrated that high colour temperature
elec than temp A po expe cond Figu Figu troencephal n lower colo perature ligh ossible reaso eriment than dition in our
ure 10. Mea receip
ure 11. Mea classi condi test).
logram whic our temperat
ht (17,000 K on that the e n in previou r experimen
an scores an pt classifica
an and stand ification tas ition did not
Mea
as
w
eig tie Se
ch represent ture light (3 K) significan
effect of col us studies is nt is lower th
nd standard d ation task in
dard deviatio k in three li t pass the di A ie
.
ts subject's e ,000 K)49. M
ntly improv lour temper that the col han that of t
deviations f three lighti
ons for the a ighting cond istribution n t No a
± .
expectation Mills et al d ve self-repor
ature variati lour tempera the previous
for the conc ng condition answering ti ditions. (CT normality te al‐TA Hig . ± .
of a stimulu emonstrated rted ability t ion is small ature of Hig s study.
entration tim ns.
imes of the R in the No st (Kolmogo h‐TA
. ± .
us occurren d that high c to concentra
er in our gh-task Amb
me ratio of
receipt ormal-TA
orov-Smirn nce,
colour ate50.
bient
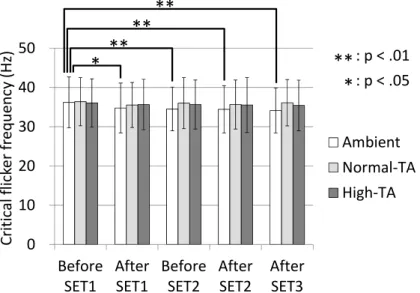
Figure 12 shows the critical flicker frequency in each lighting condition, which was analyzed with a one-way repeated measures ANOVA. The data for one group (4 participants) was missing because of measurement failure. The results showed that the critical flicker frequency significantly differed over time (F(4, 16) = 7.03, p < 0.001) only in the Ambient condition. A post-hoc Bonferroni t-test for the Ambient condition
revealed statistically significant differences between before and after SET1 (p < 0.05), and before SET1 and the others except after SET1 (p < 0.01). Therefore, the fatigue of cerebral neocortex was found only in the Ambient condition. This result is also
explainable by the fact that the Task Ambient lighting can reduce the cocktail party effect of vision so that the unconscious processing was reduced.
Figure 12. Mean scores and standard deviations for the critical flicker frequency in the three lighting conditions.
6.
Conclusions
Three lighting systems were evaluated quantitatively and objectively using the CTR proposed in the authors' previous study4. The evaluation results showed that the task
ambient lighting system with high colour temperature (6,200 K) provides better performance than the ambient lighting system by 5.0% points of the CTR, although no statistically significant difference was found between the task ambient lighting systems
Befo e
SET AfteSET Befo eSET AfteSET AfteSET
Cit
ia
lfl
ik
e
fe
u
e
y
Hz
A ie t No al‐TA High‐TA
*
**
*
: p < . : p < .
**
**
with different correlated colour temperatures. For future work, further studies will be conducted to verify the results of the evaluations obtained in this study by conducting similar evaluation experiments in an actual office.
Declaration of conflicting interests
The authors declare that there is no conflict of interest.
Funding
This research was supported as a "Practice-promotion model project for conserving electricity and reducing CO2 emissions" by the Ministry of the Environment of Japan.
References
1 Bauman FS, Carter TG, Baughman AV, Arens EA. Field study of the impact of a desktop task/ambient conditioning system in office buildings. ASHRAE Transactions 1998; 104(1): 1153-1171.
2 Newsham G, Arsenault C, Veitch J, Tosco AM, Duval C. Task lighting effects on office worker satisfaction and performance, and energy efficiency. Leukos 2005; 1(4): 7-26.
3 Bohlena GA, Barany JW. A learning curve prediction model for operators performing industrial bench assembly operations. International Journal of Production Research 1976; 14: 295-303.
4 Miyagi K, Oishi K, Uchiyama K, Ishii H, Shimoda H. Proposal of intellectual productivity model based on work state transition. In: Conference on Human-Computer Interaction, Engineering Psychology and Cognitive Ergonomics, Part I, Las Vegas, 21-26 July 2013: pp. 335-343.
5 Ramírez YW, Nembhard DA. Measuring knowledge worker productivity: A taxonomy. Journal of Intellectual Capital, 2004; 5(4): 602-628.
6 Ilgen D, Schneider J. Performance measurement: a multi-discipline view.
International Review of Industrial and Organizational Psychology, 1991; 6: 71-108. 7 Wyon DP. Indoor environmental effects on productivity. In: Indoor Air Quality 96,
8 Clements-Croome D. Environmental quality and the productive workplace. In: Innovative Developments in Architecture, Engineering and Construction. Rotterdam: Millpress Science Publishers, 2003.
9 Clements-Croome D. Building environment, architecture and people. In: Intelligent Buildings: Design, Management and Operation. London: Thomas Telford, 2004. 10 Li B, Lim D. Occupant behavior and building performance. In: Design and
Management of Sustainable Built Environments. London: Springer-Verlag, 2013. 11 Jin Q, Overend M, Thompson P. Towards productivity indicators for
performance-based facade design in commercial buildings. Building and Environment, 2012; 57: 271-281.
12 Canazei M, Dehoff P, Staggla S, Pohl W. Effects of dynamic ambient lighting on female permanent morning shift workers. Lighting Research and Technology 2014; 46: 140-156.
13 Izso L, Lang E, Laufer L, Suplicz S, Horvath A. Psychophysiological, performance and subjective correlates of different lighting conditions. Lighting Research and Technology 2009; 41: 349-360.
14 Nishihara N, Tanabe S. Monitoring cerebral blood flow for objective evaluating of relationship productivity and thermal environment. In: International Indoor Air Quality, Ventilation and Energy Conservation in Buildings Conference, Sendai, Japan, 28-30 October 2007: pp. 655-662.
15 Bruce-Low SS, Cotterrell D, Jones GE. Heart rate variability during high ambient heat exposure, Aviation, Space, and Environmental Medicine, 2006; 77(9): 915-920. 16 Antelmi I, DePaula RS, Shinzato AR, Peres CA, Mansur AJ, Grupi CJ. Influence of
age, gender, body mass index, and functional capacity on heart rate variability in a cohort of subjects without heart disease, The American Journal of Cardiology, 2004; 93(3): 381-385.
17 Wargocki P, Wyon DP, Fanger PO. Productivity is affected by the air quality in offices. In: Proceedings of Healthy Buildings 2000, Helsinki, Finland, 6-10 August 2000, Vol. 1: pp. 635-640.
18 Park JS, Yoon CH. The effects of outdoor air supply rate on work performance during 8-h work period. Indoor Air, 2011; 21(4): 284-290.
19 Lan L, Wargocki P, Lian Z. Quantitative measurement of productivity loss due to thermal discomfort. Energy and Buildings, 2011; 43(5): 1057-1062.
20 Bako-Biro Z, Wargocki P, Weschler CJ, Fanger PO. Effects of pollution from personal computers on perceived air quality, SBS symptoms and productivity in offices. Indoor Air, 2004; 14: 178-187.
22 Newsham GR, Veitch JA. Lighting quality recommendations for VDT offices: a new method of derivation. Lighting Research and Technology 2001; 33(2): 97-116. 23 Veitch JA, Newsham GR, Boyce PR, Jones CC. Lighting appraisal, well-being and
performance in open-plan offices: A linked mechanisms approach. Lighting Research and Technology 2008; 40: 133-151.
24 Stone PT, Clarke AM, Slater AL. The effect of task contrast on visual performance and visual fatigue at a constant illuminance. Lighting Research and Technology 1980; 12(3): 144-159.
25 Karuppan CM. Learning and forgetting: implications for workforce flexibility in AMT environments. In: Learning Curves: Theory, Models, and Applications, Florida: CRC Press, 2011.
26 Bishu RR, Chen Y. Learning and transfer effects in simulated industrial information processing tasks. International Journal of Industrial Ergonomics. 1989; 4(3): 237-243.
27 Mathewson KE, Basak C, Maclin EL, Low KA, Boot WR, Kramer AF, Fabiani M, Gratton G. Different slopes for different folks: Alpha and Delta EEG power predict subsequent video game learning rate and improvements in cognitive control tasks. Psychophysiology, 2012; 49: 1558-1570.
28 Ackerman PL, Cianciolo AT. Cognitive, perceptual-speed, and psychomotor determinants of individual differences during skill acquisition. Journal of Experimental Psychology: Applied, 2000; 6(4): 259-290.
29 Enomoto K, Kondo Y, Obayashi F, Iwakawa M, Ishii H, Shimoda H, Terano M. An experimental study on improvement of office work productivity by circadian rhythm light. In: World Multi-Conference on Systemics, Cybernetics, Vol. 6, Orlando, Florida, 29 June - 2 July 2008: pp. 121-126.
30 Iregren A, Gamberale F, Kjellberg A. SPES: A psychological test system to diagnose environmental hazards. Neurotoxicology and Teratology, 1996; 18(4): 485-491. 31 Riccio CA, Reynolds CR, Lowe P, Moore JJ. The continuous performance test: A
window on the neural substrates for attention? Archives of Clinical Neuropsychology, 2002; 17(3): 235-272.
32 Herdman SJ, Tusa RJ, Blatt P, Suzuki A, Venuto PJ, Roberts D. Computerized dynamic visual acuity test in the assessment of vestibular deficits. American Journal of Otology, 1998; 19: 790-796.
33 Myhrvold AN, Olsen E, Lauridsen O. Indoor environment in schools - pupils health and performance in regard to CO2 concentrations. In: Proceedings of the 7th International Conference on Indoor Air Quality and Climate, 1996 July 21-26, Nagoya, Japan, Vol. 4: pp. 369-374.
34 Wyon DP, Wyon I, Norin F. The effects of negative ionisation on subjective
35 Wargocki P, Wyon DP. The effect of moderately raised classroom temperatures and classroom ventilation rate on the performance of schoolwork by children, HVAC&R Research, 2007; 13(2): 193-220.
36 Fisk WJ, Price PN, Faulkner D, Sullivan DP, Dibartolomeo DL, Federspiel CC, Liu G, Lahiff M. Worker performance and ventilation: analyses of time-series data for a group of call-center workers. In: Indoor Air, Monterey, California, 30 June - 5 July 2002: pp.784-795.
37 Mas A, Moretti E. Peers at Work. American Economic Review 2009; 99(1): 112-145. 38 Braakman-Jansen LM, Taal E, Kuper IH, van de Laar MA. Productivity loss due to
absenteeism and presenteeism by different instruments in patients with RA and subjects without RA. Rheumatology. 2012; 51(2): 354-361.
39 Prater T, Smith K. Underlying factors contributing to presenteeism and absenteeism. Journal of Business and Economics Research, 2011; 9(6): 1-14.
40 Halpern MT, Shikiar R, Rentz AM, Khan ZM. Impact of smoking status on workplace absenteeism and productivity. Tobacco Control. 2001; 10: 233-238. 41 Issa MH, Rankin JH, Atallah M, Chritian AJ. Absenteeism, performance and
occupant satisfaction with the indoor environment of green Toronto schools. Indoor Built Environment. 2011; 20(5): 511-523.
42 Antikainen R, Lönnqvist A. Knowledge work productivity assessment. In: 3rd Conference on Performance Measurement and Management, Nice, France, 22-23 September 2005.
43 Hacker DJ, Bol L, Horgan DD, Rakow EA. Test prediction and performance in a classroom context. Journal of Educational Psychology, 2000; 92(1): 160-170. 44 Seppanen O, Fisk WJ, Lei QH. Ventilation and performance in office work, Indoor
Air, 2006; 16(1): 28-36.
45 Clausen G, Wyon DP. The combined effects of many different indoor environmental factors on acceptability and office work performance. HVAC&R Research, 2008; 14(1): 103-113.
46 Bills AG. Blocking: A new principle of mental fatigue. The American Journal of Psychology, 1931; 43(2): 230-245.
47 Baayen RH, Milin P. Analyzing reaction times. International Journal of Psychological Research, 2010; 3(2): 12-28.
48 Miyagi K. Kawano S. Ishii H. Shimoda H. Proposal of intellectual productivity variation model based on state transitions. The Transactions of Human Interface Society, 2014; 16(1): 7-17. (In Japanese)
49 Deguchi T, Sato M. The effect of color temperature of lighting sources on mental activity level. Annals of Physiological Anthropology 1992: 11(1): 37-43.
50 Mills PR, Tomkins SC, Schlangen LJM. The effect of high correlated colour
51 Simon H, Zhe C. The cocktail party problem. Neural Computation: 2005; 17; 1875– 1902.
52 Roland P, Carsten P, Andrea K, Wilfried K. Your unconscious knows your name. PLoS ONE: 2012; 7(3): e32402.
53 Shapiro K, Caldwell J, Sorensen RE. Personal names and the attentional blink: a visual “cocktail party” effect. Journal of Experimental Psychology: Human Perception and Performance: 1997; 23(2): 504-514.
54 Veitch JA, Newsham GR. Lighting quality and energy-efficiency effects on task performance, mood, health, satisfaction, and comfort. Journal of the Illuminating Engineering Society, 1998; 27(1): 107-129.
55 Boyce PR, Veitch JA, Newsham GR, Jones CC, Heerwagen J, Myer M, Hunter CM. Lighting quality and office work: two field simulation experiments, Lighting
Research and Technology 2006; 38(3): 191-223.
56 Lehrl S, Gerstmeyer K, Jacob JH, Frieling H, Henkel AW, Meyrer R, Wiltfang J, Kornhuber J, Bleich S. Blue light improves cognitive performance. Journal of Neural Transmission, 2007; 114(4): 457-460.
57 Lockley SW, Evans EE, Scheer FA, Brainard GC, Czeisler CA, Aeschbach D. Short-wavelength sensitivity for the direct effects of light on alertness, vigilance, and the waking electroencephalogram in humans. Sleep 2006; 29(2): 161-168.
Figure captions
Figure 1. Histogram of answering times and a lognormal distribution.
Figure 2. The work state model.
Figure 3. Lognormal distributions with one varying parameter.
Figure 4. Receipts classified by participants (left) and the interface to be used to input the classified results (right).
Figure 5. The desktop in the High-Task Ambient condition
Figure 6. Experimental procedure
Figure 8. Answering time distribution for one subject (bar chart) and fitted lognormal function (dotted line) in (a) Ambient condition and (b) High-Task Ambient condition.
Figure 9. Mean scores and standard deviations for performance and concentration time ratio of receipt classification task for the first day and the fourth day.
Figure 10. Mean scores and standard deviations for the concentration time ratio of receipt classification task in three lighting conditions. (CTR in the Normal-TA condition did not pass the distribution normality test (Kolmogorov-Smirnov test).
Figure 11. Mean and standard deviations for the answering times of the receipt classification task in three lighting conditions.
Table 1. Lighting conditions.
Illuminance
(Ceiling / Task light) Colour temperature (Ceiling / Task light) Ambient 750 lux / 0 lux 5000 K / N/A
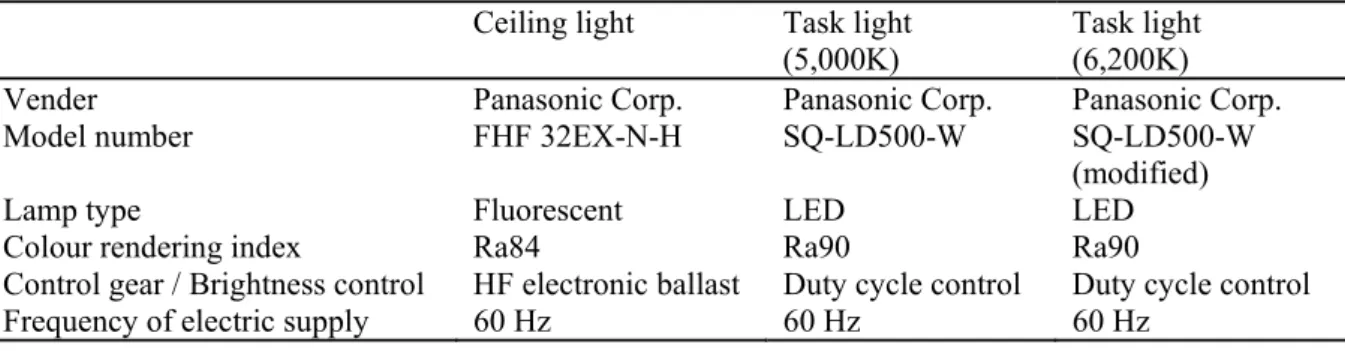
Table 2. Light source used in the experiment.
Ceiling light Task light
(5,000K) Task light (6,200K)
Vender Panasonic Corp. Panasonic Corp. Panasonic Corp.
Model number FHF 32EX-N-H SQ-LD500-W SQ-LD500-W
(modified)
Lamp type Fluorescent LED LED
Colour rendering index Ra84 Ra90 Ra90
Control gear / Brightness control HF electronic ballast Duty cycle control Duty cycle control
Table 3. Order of the lighting conditions for each group. Monday