sustainability
ISSN 2071-1050 www.mdpi.com/journal/sustainabilityArticle
The Effect of Payments for Ecosystem Services Programs on the
Relationship of Livelihood Capital and Livelihood Strategy
among Rural Communities in Northwestern China
Fei Wang 1,2, Degang Yang 2,*, Changjian Wang 3,* and Xinhuan Zhang 2
1 School of Geography Science and Tourism, Xinjiang Normal University, Urumqi 830054, China;
E-Mail: [email protected]
2 Xinjiang Institute of Ecology and Geography, Chinese Academy of Sciences, Urumqi 830011,
China; E-Mail: [email protected]
3 Guangzhou Institute of Geography, Guangzhou 510070, China
* Authors to whom correspondence should be addressed; E-Mails: [email protected] (D.Y.); [email protected] (C.W.).
Academic Editor: Marc A. Rosen
Received: 8 December 2014 / Accepted: 13 July 2015 / Published: 17 July 2015
Keywords: ecological compensation; livelihood capital; livelihood strategy; rural mountain community
1. Introduction
The term “livelihood” is most commonly defined as people’s capacity to maintain a living [1] and several frameworks have been developed to analyze the sustainability of livelihoods [2,3]. The conceptual framework of the United Kingdom’s Department for International Development (DFID), which outlines a list of issues relevant to livelihood research, has attracted significant attention [4]. As the resource base possessed by households, “livelihood capitals” are grouped into human, natural, financial, physical, and social capitals [5]. The available capital constitutes a stock of assets that can be stored, accumulated, exchanged, and put to work to generate a flow of income or other benefits [6]. The condition of livelihood capital, focused on poverty alleviation and elimination, can reflect a household’s real livelihood situation. Depending on available capitals, folks employ different livelihood strategies to achieve livelihood goals. Hence, “livelihood strategies” are the range and combination of activities and choices that people make to realize their livelihood objectives, which can be classified into three categories: only farm, farm and off-farm, and only off-farm [7]. These livelihood activities are subject to the endowment with livelihood capital because they determine the possibilities for rural households to achieve goals related to revenue, safety, and welfare [2]. Generally, those with more livelihood assets tend to have more choices, a greater ability to handle stress and be better able to switch among various livelihood strategies.
From the perspective of conservation and sustainable use of ecosystem services (ES), economic instruments are primarily adopted to regulate the interests of stakeholders. Ecological compensation is a policy tool to address environmental problems that have an impact on household livelihood that is closely related to project sustainability and social fairness. As a financial incentive mechanism that transfers external or non-marketable environmental values to the local actors who provide ES, ecological compensation has attracted widespread attention in society and is being implemented in many countries with increasingly pressing ecological problems [8–11]. There are three modes of ecological compensation: compensation for the cost of ecosystem protection or damage mitigation, compensation for the funding of ecosystem protection and the loss of development opportunities, and investment in protected areas or objects with significant ecological value.
In 1998, the revised Forest Law of China proposed that the State should establish the Forestry Ecological Efficiency Compensation Fund to protect forest resources. The State Council then promulgated regulations on Restoring Farmland to Forest in 2002, clearly defining the funds, food subsidies and other elements needed to ensure smooth progress. Subsequently, regulations on Returning Grazing Land to Grassland were promulgated in 2003, instituting grazing prohibitions, livestock-feed balances, and fine forage and production material subsidies to strengthen the protection of grasslands, especially in Inner Mongolia, Gansu, Ningxia, Qinghai, Yunnan, Sichuan, Xinjiang and so on in West China. The Chinese government has updated compensation details in succession, with a standard award of 13.5 dollars per hectare for grazing prohibition, and 3.45 dollars per hectare for livestock-feed balances each year in a pastureland rehabilitation program; however, a household is currently rewarded 204 dollars per hectare for the reforestation of cultivated land [31]. Furthermore, to prevent misappropriate funds and ensure issue schedule, all of these subsidies are issued by the form of One-Card directly to the household.
However, there are still some unresolved problems in China’s ecological compensation mechanism, such as no clear compensation range, unscientific compensation standards, relatively simple compensation models, lack of funding, undeveloped policy and regulation system, and so on.
The implementation of ecological compensation mechanisms can lead to significant changes in household assets and livelihood strategies among participating households. However, the impacts of ecological compensation programs are likely to depend on the kind of program in which a household participates. In the Chinese case, the government implemented ecological compensation payments programs designed for specific groups of beneficiaries. For present purposes, there are three categories of programs and thus beneficiaries in our research area. These include herdsmen, who participated in the pastureland rehabilitation program, farmers who participated in the cultivated land reforestation program, and agro-pastoralists who participated in both of these programs. Participation in distinct ecological compensation programs is intended to improve both household assets and thus livelihoods as well as environmental sustainability in terms of key natural resources on which households rely. The realization of a win-win situation thus depends on the accumulation of household livelihood capital and adjustments in household livelihood strategies. However, there remains limited research on the relative impacts of different ecological compensation programs as they influence households with distinct livelihood strategies.
off-farm livelihoods, which benefits their well-being. This could provide a reference for developing sustainable livelihoods practices and identifying the most important mode of compensation for different beneficiaries to ensure limited funds be optimally allocated.
2. Methodology
2.1. Description of Study Area
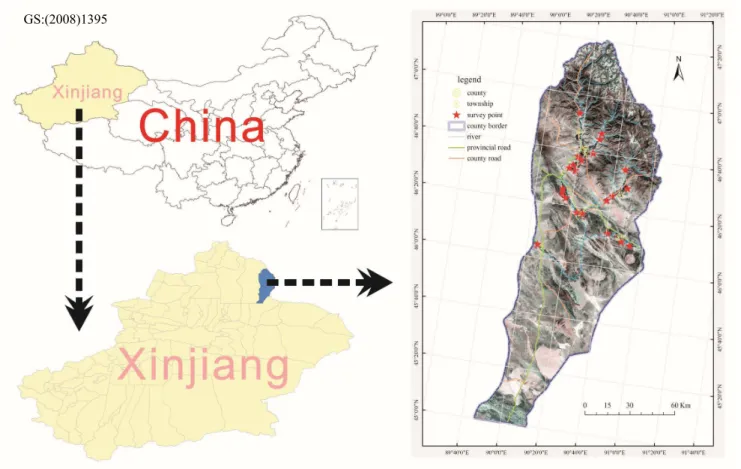
Located in the northeastern Xinjiang Uygur Autonomous Region of China (Figure 1), the upper reaches of the Ulungur River belong to the hinterland of the Eurasian continent and are characterized by mountains along the northeastern edge of the Junggar Basin, and alpine valleys to the southeast of the Altai Mountains, with an elevational range from 900 to 3659 m; the east and north sides border on Mongolia.
Figure 1. Location of study area.
The basic terrain type within the area is composed primarily of mountain, hill, plain and the Gobi desert. The plain area is an important base due to its fertile land, which is suitable for planting spring wheat, oilseed rape, oil sunflower and other crops. Other areas form the base for animal husbandry, and the botanical resources are composed of plain forest, steppe, meadow and desert. Available natural capital for households includes grassland, cultivated land and forestland.
Having been grassland nomads for a long time, the local lifestyle is characterized by moving households to follow pasture and water. However, many factors such as climate change, population growth, livestock overload and indiscriminate reclamation have all contributed to grassland
degradation. Seventy-five percent of the natural grassland appears to have varying degrees of degradation, more than 37% of which is seriously degraded [35], where the conflicts between forage and livestock have been exacerbated.
There are 52 villages in Qinghe County, 26 of which are grazing villages and the remainder of which are farming villages. The county is composed of seven townships, and the total population and households were 64,273 and 18,764 respectively in 2011; there is a similar percentage of males and females, with a population density of 4.08 people per square kilometer. In addition to the Han nationality, there are several ethnic minorities, such as Kazak (76.46%), Hui and others, inhabiting this area, and the poverty rates are high.
Qinghe is a large agricultural county that has a rural population more than 60% of the total population in 2011. Of a total population of 39,253 rural people and 8798 village households, 22,378 rural people and 4975 households rely primarily on grazing. Thus, whether the statistical unit is the household or the individual, the grazing population is higher than the farming population. Animal husbandry is the primary traditional industry, with rural per capita income approaching 648 dollars in 2011. Currently, livelihood strategies of planting (food crops, such as wheat and potato; economic crops, such as sunflower; grass crops, such as silage corn and high-quality forage) and some breeding (sheep, cattle, chickens, ducks, etc.) are adopted in the farming zone, whereas grazing and breeding (sheep, goats, beef cattle, dairy cattle, horses, camels, etc.) were the primary livelihood activities in the grazing zone.
Qinghe County’s public infrastructure is weak because of the remoteness of the area and the scattered population. On average, each teacher is responsible for 5.5 and 10.0 students in secondary and primary school, respectively, and there are 3.3 physicians and 2.8 hospital beds per 1000 people. Development of transportation, power and water supplies, education, healthcare, cultural opportunities and other social undertakings are relatively slow, overall.
In recent years, Qinghe County has been attentive to the development of new irrigation areas, agricultural industrialization, mining exploration and exploitation, port economy, pastoralist settlements, and so on, working towards a transition from traditional agriculture to modern industry as part of the region’s socio-economic development.
2.2. Methodological Approach
2.2.1. Data Collection
Because the nomadic tradition functions seasonally, with herding families returning to high mountain rangelands in the summer and to desert pastures in the winter, our survey was restricted to a specific time range to ensure the full participation of the respondent groups. An appropriate survey time was before households moved to summer or winter pastures; this was also a season of relative leisure, when we did not worry about disturbing them. Two preliminary investigations were conducted in April 2013, with the goals of collecting natural and socio-economic statistical data from the seven townships and county departments, building a suitable index system for the research area to evaluate livelihood capital as well as designing questions and options for the questionnaire. Above all, the questionnaire was designed to focus on the livelihood capitals and livelihood strategies of farmers, herdsmen and agro-pastoralists.
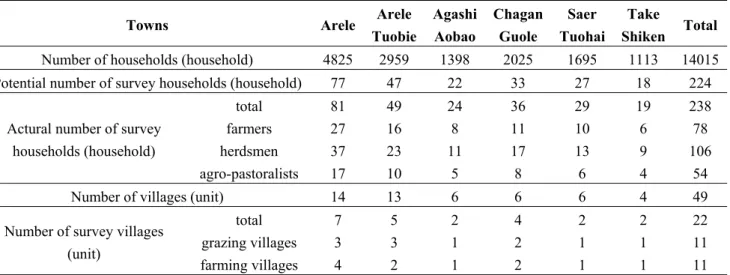
We excluded the town of Qinghe from the investigation on the grounds that there was no existing ecological compensation project. The final version of the questionnaire was launched employing PRA (Participatory Rural Appraisal) [36] in a total of 22 representative villages during a two-week period in November 2013, with each questionnaire requiring approximately 1 to 1.5 h to complete. We administered 241 questionnaires by household interviews using proportional selective sampling (with a sampling fraction of 1.6%) based on both population size and the dimensional distribution of the six townships. After excluding three invalid questionnaires (with incomplete data), we collected a total of 238 validated questionnaires, of which 78, 106 and 54 were from farmers, herdsmen, and agro-pastoralists, respectively. Detailed information is listed below in Table 1.
Table 1. Sampling distribution and proportion based on different beneficiaries and towns.
Towns Arele Arele
Tuobie
Agashi Aobao
Chagan Guole
Saer Tuohai
Take
Shiken Total
Number of households (household) 4825 2959 1398 2025 1695 1113 14015 Potential number of survey households (household) 77 47 22 33 27 18 224
Actural number of survey households (household)
total 81 49 24 36 29 19 238
farmers 27 16 8 11 10 6 78
herdsmen 37 23 11 17 13 9 106
agro-pastoralists 17 10 5 8 6 4 54
Number of villages (unit) 14 13 6 6 6 4 49
Number of survey villages (unit)
total 7 5 2 4 2 2 22
grazing villages 3 3 1 2 1 1 11
farming villages 4 2 1 2 1 1 11
2.2.2. Measurement of Livelihood Capital
Identification of the Primary Indicators Related to Livelihood Capitals
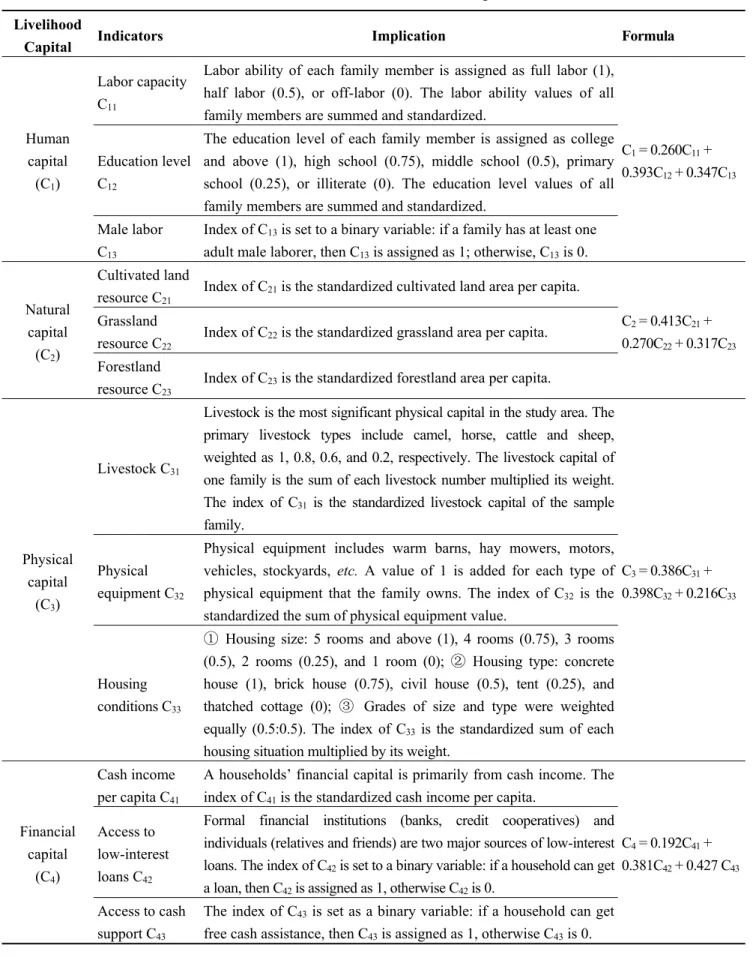
attributes of livelihood capital (human capital, natural capital, financial capital, physical capital and social capital) in the study area. Each livelihood capital has three indicators to capture its salient features. Table 2 lists the relevant details of the indicators.
Table 2. Indicators of livelihood capital.
Livelihood
Capital Indicators Implication Formula
Human capital
(C1)
Labor capacity C11
Labor ability of each family member is assigned as full labor (1), half labor (0.5), or off-labor (0). The labor ability values of all family members are summed and standardized.
C1 = 0.260C11 + 0.393C12 + 0.347C13 Education level
C12
The education level of each family member is assigned as college and above (1), high school (0.75), middle school (0.5), primary school (0.25), or illiterate (0). The education level values of all family members are summed and standardized.
Male labor C13
Index of C13 is set to a binary variable: if a family has at least one adult male laborer, then C13 is assigned as 1; otherwise, C13 is 0.
Natural capital (C2)
Cultivated land resource C21
Index of C21 is the standardized cultivated land area per capita.
C2 = 0.413C21 + 0.270C22 + 0.317C23 Grassland
resource C22
Index of C22 is the standardized grassland area per capita.
Forestland resource C23
Index of C23 is the standardized forestland area per capita.
Physical capital
(C3)
Livestock C31
Livestock is the most significant physical capital in the study area. The primary livestock types include camel, horse, cattle and sheep, weighted as 1, 0.8, 0.6, and 0.2, respectively. The livestock capital of one family is the sum of each livestock number multiplied its weight. The index of C31 is the standardized livestock capital of the sample family.
C3 = 0.386C31 + 0.398C32 + 0.216C33 Physical
equipment C32
Physical equipment includes warm barns, hay mowers, motors, vehicles, stockyards, etc. A value of 1 is added for each type of physical equipment that the family owns. The index of C32 is the standardized the sum of physical equipment value.
Housing conditions C33
Housing size: 5 rooms and above (1), 4 rooms (0.75), 3 rooms (0.5), 2 rooms (0.25), and 1 room (0); Housing type: concrete house (1), brick house (0.75), civil house (0.5), tent (0.25), and thatched cottage (0); Grades of size and type were weighted equally (0.5:0.5). The index of C33 is the standardized sum of each housing situation multiplied by its weight.
Financial capital
(C4)
Cash income per capita C41
A households’ financial capital is primarily from cash income. The index of C41 is the standardized cash income per capita.
C4 = 0.192C41 + 0.381C42 + 0.427 C43 Access to
low-interest loans C42
Formal financial institutions (banks, credit cooperatives) and individuals (relatives and friends) are two major sources of low-interest loans. The index of C42 is set to a binary variable: if a household can get a loan, then C42 is assigned as 1, otherwise C42 is 0.
Access to cash support C43
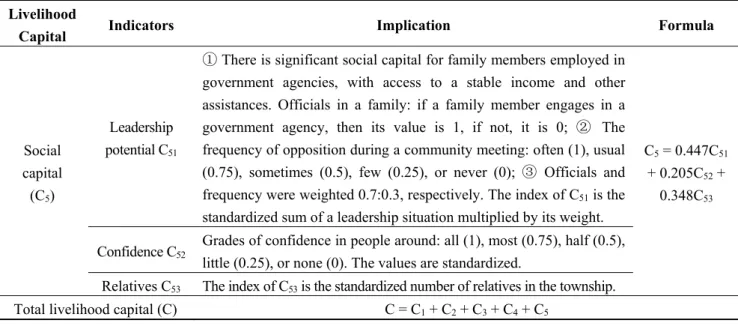
Table 2. Cont.
Livelihood
Capital Indicators Implication Formula
Social capital
(C5)
Leadership potential C51
There is significant social capital for family members employed in government agencies, with access to a stable income and other assistances. Officials in a family: if a family member engages in a government agency, then its value is 1, if not, it is 0; The frequency of opposition during a community meeting: often (1), usual (0.75), sometimes (0.5), few (0.25), or never (0); Officials and frequency were weighted 0.7:0.3, respectively. The index of C51 is the standardized sum of a leadership situation multiplied by its weight.
C5 = 0.447C51 + 0.205C52 +
0.348C53
Confidence C52
Grades of confidence in people around: all (1), most (0.75), half (0.5), little (0.25), or none (0). The values are standardized.
Relatives C53 The index of C53 is the standardized number of relatives in the township. Total livelihood capital (C) C = C1 + C2 + C3 + C4 + C5
The main investigation information are given below: (1) Human capital, including family size and each member’s gender, age, education level, occupation and health condition; (2) Natural capital, including area of cultivated land per capita, area of grassland per capita, area of forestland per capita, yield of cultivated land per mu, yield of forestland per mu, production reduction caused by natural disasters, availability of good crop varieties, pasture quality, grazing time, etc.; (3) Physical capital, including number of livestock, number of livestock for sale, cost of feed, physical equipment of family for production and life, availability of housing for size and type; (4) Financial capital, including cash income by their livelihood strategy, low-interest or interest-free loans and other subsistence allowances provided by governments; (5) Social capital, including members of family employed in governments, opposition frequency when a community meeting, confidence proportion in people around, and relatives number in the township.
Determining the Weighted Scores
The weight of an indicator plays a significant role in livelihood capital quantification because it can influence the final results. The majority of existing studies assign weight in a subjective manner; however, this may not be sufficiently precise for judging local livelihood capital. To improve the reliability of the quantification, this paper attempts to calculate objective weights using the entropy method.
represents the significance of indexes. The entropy weight, reflecting the real importance of indexes, signifies the degree of competition between indexes rather than the coefficient.
The general process to calculate entropy weight is as follows [40–44]:
If there are “p” livelihood capital samples (i = 1,2,3,…,p) and each sample has “q” evaluated variables (j = 1,2,3,…,q), then matrix X can be constructed as follows in Equation (1):
11 12 1q
21 22 2
1 2
= q
p p pq
X X X
X X X
X
X X X
(1)
When measuring the weights, the raw data must be standardized to eliminate error caused by the types of dimensions and units based on the formula given below:
{ }
(
min)
/ max(
{ }
min{ }
)
ij ij j j j
Y = X − X X − X (2)
where, Yij corresponds to the normalized value for an evaluated variable (j) in a particular livelihood
sample (i), Xij represents the original datum matrix of livelihood capital in Table 2, and min
{ }
Xj and{ }
max Xj are the minimum and maximum value of each evaluated variable group, respectively. The ratio of index value of index j and sample i is shown in Equation (3):
ij ij
1
p
ij
i
P Y Y
=
=
(3)The information entropy (Ej) is given by the following equation,
(
)
1
(1 ln ) ln p
j ij ij
i
E p P P
=
= − ×
× (4)A low value of Ej represents a high effect of index j. Therefore, entropy weight (wj) of variable j can
be calculated with the following equation:
1
(1 ) (1 )
q
j j j
j
W E E
=
= −
− (5)Calculating Livelihood Capital Index
We can estimate the index value of livelihood capital Ci as: p
i j ij i
C =
w Y (6)2.2.3. Models of Livelihood Capitals and Livelihood Strategies among Beneficiaries of Different Ecological Payment Programs
This study focuses on the choice of on-farm or off-farm livelihoods, which is well-established as a key indicator of livelihood strategies. This choice implies a binary variable that indicates whether the livelihood strategy is on-farm or off-farm. Hence, binary logistic regression is an appropriate ideal model to analyze individual decision-making behavior, which can be used to describe the causal relationship between livelihood strategy (e.g., dependent variable Y) and livelihood capital (e.g., independent variable Ci) [45,46]. When using the logistic distribution, we need to make Y a random
dependent variable, ranging from 0 to 1 (1 stands for choosing this type of livelihood activity), and Ci
(i = 1,2,…,p) be the independent variables associated with Y in observation p of the livelihood samples. The form of the logistic probability function is:
( )
1 ( )
Exp Z P
Exp Z
=
+ (7)
0 1 1 2 2 0
1
=
= + + + ⋅ ⋅ ⋅ ⋅ ⋅ ⋅ + + ε = +
p p p i i i
i
Z b b C b C b C b b C (8)
where, P is the probability, Z is the linear combination of Ci(i = 1,2,…,p), Exp is the exponent
function, b0 is the constant, and bi (i = 1,2,…,p) is the regression coefficient.
In the statistical analysis process, we set the probability of “choose off-farm” as P (Y = 1), whereas probability of “not choose off-farm” is set as 1-P (Y = 1). Usually, the logistic probability function is transformed by Logit to obtain the linear expressions between dependent variable and independent variables as follows:
0 1
( ) ( )
1
n
i i i P
Logit P Ln b b X
P =
= = +
−
(9)The maximum likelihood method is commonly used to estimate parameters, and the model can be run by SPSS17.0. A positive regression coefficient indicates a positive relationship between livelihood capital and off-farm livelihood strategies, whereas a negative regression coefficient indicates an adverse relationship between livelihood capital and non-farm livelihood strategies. The odds ratio, an important indicator quantifying the degree of influence that an independent variable has on a dependent variable, can be measured as a specific value between the incident frequency of occurrence and not occurrence, with the result that the probability of livelihood strategies increases or decreases by exp(bi) times as the livelihood capital (Ci) increases or decreases by one unit [2,47].
3. Results and Discussions
3.1. Analysis of Household Livelihood Strategies
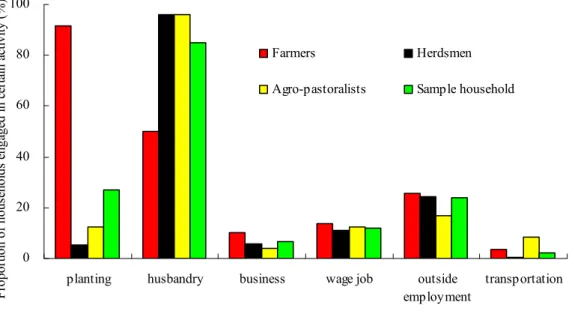
families and show the highest proportion of engagement in business, wage jobs and part-time jobs among the three types of beneficiaries. Among herdsmen, 96.15% and 24.36% are occupied in husbandry and outside employment, respectively, and few are engaged in planting. The dominant livelihood practice of agro-pastoralists is husbandry, but a significant proportion of agro-pastoralists engage in transportation. Generally, herdsmen and agro-pastoralists depend more on natural resources than farmers.
Figure 2. Main livelihood activity of different beneficiaries from ecological compensation.
3.2. Comparison of Household Livelihood Capital
The livelihood capital index of sample households is 1.714 (Figure 3). There is a clear difference in the livelihood capital index among heterogeneous households in the study area. Agro-pastoralists have the highest livelihood capital index, with an index of 1.794, followed by herdsmen and farmers with indices 3.60% and 8.68% lower than agro-pastoralists, respectively. These differences may be influenced by factors such as natural conditions, resource availability, production mode and cultural customs.
Figure 3. Livelihood capital index of the different households.
0 20 40 60 80 100
planting husbandry business wage job outside
employment
transportation
P
roport
ion
of hous
eh
ol
ds
e
nga
ge
d i
n
c
er
ta
in
a
ct
ivi
ty
(%)
Farmers Herdsmen
Agro-pastoralists Sample household
1.6 1.7 1.8
Farmers Herdsmen Agro-pastoralists Sample
L
ive
li
h
ood c
ap
it
al
i
nde
The livelihood capital polygon best illustrates the composition and structure of household livelihood capital. The center of the livelihood capital pentagon represents a zero value, whereas the external boundary (vertex) represents a maximum value of some capital. The ideal livelihood capital polygon is a regular polygon, namely balanced and coordinated development of various types of livelihood capitals. Figure 4a shows the accumulation and development were happened in Qinghe County’s household livelihood capitals. Human capital has a comparative advantage and could ensure a sufficient labor capacity to develop new revenue streams. Natural capital is at a relative disadvantage and is constrained by the natural environment of the research area and a reduction in available land.
A change in the index of livelihood sustainable capacity before and after ecological compensation can reflect whether the livelihood capital structure is moving in a positive direction; the dividing line between a positive and negative change is the value 1. Although the livelihood capital index of herdsmen and agro-pastoralists are somewhat higher than those of farmers (Figure 3), their change in index of livelihood sustainable capacity is experiencing a backward, particularly for the agro-pastoralists (Figure 4b).
(a) (b)
Figure 4. (a) Livelihood capital pentagon of the different households; (b) The change in livelihood sustainable capacity before and after ecological compensation.
3.3. Relationship between Livelihood Strategy and Livelihood Capital
Pearson correlation coefficients were calculated for indices of the five types of livelihood capital to verify the applicability of the model. Table 3 shows that the absolute value of correlation coefficients between explanatory variables is between 0 and 0.4, indicating that the capital variables are statistically independent of one another. Consequently, it is suitable to apply the logistic regression model to sample households.
Table 3. The correlation coefficients between different livelihood capitals.
Human Capital Natural Capital Physical Capital Financial Capital Social Capital
Human capital 1
Natural capital −0.080 1
Physical capital 0.230 0.107 1
Financial capital −0.084 −0.049 0.007 1
Social capital 0.089 0.136 0.149 −0.012 1
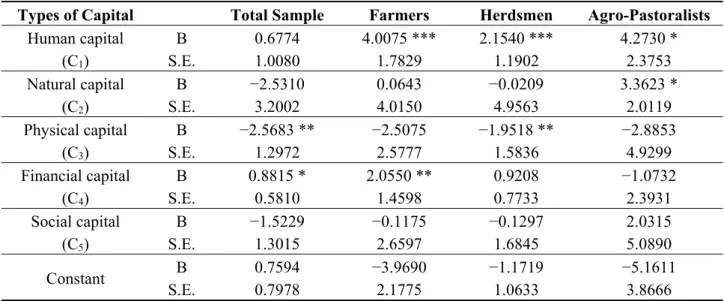
To understand the determinants of livelihood strategy and to compare the differences among beneficiaries of different ecological compensation programs, livelihood strategies were divided into two types (i.e., farm or non-farm activities) primarily based on the share of total earnings derived from these two types of activities. Table 4 clearly shows that there is a close relationship between households’ livelihood capitals and their adopted livelihood strategies.
Table 4. Logistic regression model analysis of livelihood strategies.
Types of Capital Total Sample Farmers Herdsmen Agro-Pastoralists
Human capital (C1)
B 0.6774 4.0075 *** 2.1540 *** 4.2730 *
S.E. 1.0080 1.7829 1.1902 2.3753
Natural capital (C2)
B −2.5310 0.0643 −0.0209 3.3623 *
S.E. 3.2002 4.0150 4.9563 2.0119
Physical capital (C3)
B −2.5683 ** −2.5075 −1.9518 ** −2.8853
S.E. 1.2972 2.5777 1.5836 4.9299
Financial capital (C4)
B 0.8815 * 2.0550 ** 0.9208 −1.0732
S.E. 0.5810 1.4598 0.7733 2.3931
Social capital (C5)
B −1.5229 −0.1175 −0.1297 2.0315
S.E. 1.3015 2.6597 1.6845 5.0890
Constant B 0.7594 −3.9690 −1.1719 −5.1611
S.E. 0.7978 2.1775 1.0633 3.8666
S.E. corresponds to standards error; * Significance level: 10%; ** Significance level: 5%; *** Significance level: 1%.
3.3.1. Herdsmen
(a) (b) (c)
Figure 5. (a) Relationship between livelihood strategy and livelihood capital for herdsmen; (b) For farmers; (c) For agro-pastoralists.
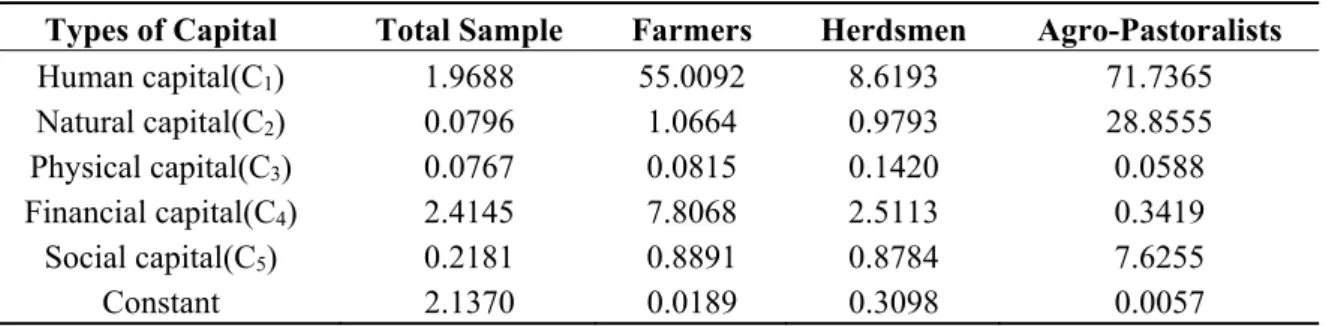
Table 5. Estimation value of the relationship between livelihood strategy and livelihood capital.
Types of Capital Total Sample Farmers Herdsmen Agro-Pastoralists
Human capital(C1) 1.9688 55.0092 8.6193 71.7365
Natural capital(C2) 0.0796 1.0664 0.9793 28.8555
Physical capital(C3) 0.0767 0.0815 0.1420 0.0588
Financial capital(C4) 2.4145 7.8068 2.5113 0.3419
Social capital(C5) 0.2181 0.8891 0.8784 7.6255
Constant 2.1370 0.0189 0.3098 0.0057
3.3.2. Farmers
Out of 78 questionnaires, 75.01% were from farm households and 24.99% were from off-farm households. Table 4 demonstrates that the relation between physical capital and farm strategy is positive-going. In this regard, the growth in physical capital will lead to a higher likelihood of farmers choosing farm strategies. In contrast, human and financial capitals express a negative effect on farm livelihood activities. That is, an increase in human and financial capitals brings about improved access to non-farm opportunities. Human capital, however, has a larger effect on non-farm livelihood activities than financial capital. According to the logistic regression analysis, the probability of off-farm livelihood activities increases by 55.009 and 7.807 times, respectively, with a one-unit increase in human and financial capitals (see Table 5 and Figure 5b). One possible interpretation of this result is that financial resources are more limited (low deposits, low rewards, and high debts) in farming households to develop off-farm strategy than herdsmen and agro-pastorlists. This would explain the significance of financial capital for farmers.
3.3.3. Agro-Pastoralists
between livelihood strategies and human, natural, physical, financial and social capital. Human, natural and social capital appear to have a clear positive influence on non-farm livelihood activities, but physical and financial capital have a negative impact on these activities. Compared with other beneficiaries, agro-pastoralists do have the highest overall level of capitals. So perhaps, participating in the PES programs may be less important than in the other groups. In Table 5 and Figure 5c, the probability of off-farm livelihood activities increases by 71.737 and 28.856 times, respectively, in response to a one-unit increase in human and natural capital.
3.3.4. Comparison among Different Households
The slope of the curve in Figure 5 indicates the association degree between livelihood capital and livelihood strategy, that is, a steeper slope corresponds to a higher level of correlation. A shared phenomenon among the three types of beneficiaries is that human capital is a catalyst in increasing the opportunity of non-farm activities, but differs in the level of correlation extent. The probability of off-farm livelihood practices to human capital of agro-pastoralists is approximately 1.3 and 8.3 times greater than that of farmers and herdsmen, respectively. The financial capital (farm or off-farm earnings, ecological compensation rewards, deposits, etc.) of farmers and the natural capital of agro-pastoralists influences their correlation to off-farm livelihood activities, whereas physical capital influences correlation to farm activities in herdsmen. It is clear that the livelihood strategies of different beneficiaries from ecological compensation are influenced by their capital base. Consequently, when considering follow-up policies for acceleration of non-farm or farm industries, governments should consciously differentiate among the beneficiaries to achieve the desired effect and to ensure that limited resources are allocated optimally. For example, identifying the priorities of each target group for compensation capital should be encouraged.
3.4. Livelihood Strategy Implications
Given the pattern of livelihood strategies in this region, with weak livelihoods and earning inequalities, strong external interventions are needed to influence the household choice of a particular livelihood pathway.
Animal husbandry and agriculture, as the sources of food and cash, are relatively more important to a local resident’s livelihood in this region than other strategies. Highlighting physical capital illustrates an important mechanism for development of farm livelihood activities. Farm strategies are indispensable in today’s society to maintain food security of the household and also to improve production conditions.
and energetic labor force, as well as the construction of market, traffic, communication, and other infrastructures to vitalize local economies and create more development opportunities.
Overall, a mixed livelihood strategy is a channel for diversifying to ensure revenue growth and higher living standards, which could also alleviate the pressure on ecological environment and reduce the vulnerability of single livelihood activity. It is worth mentioning that we must pay close attention to the important role of national cultural and let household be actively involved in by forming a spatial and temporal buffer zone to prevent life maladjustments and cultural discontinuities when entering into a new livelihood.
4. Concluding Remarks and Policy Recommendations
4.1. Concluding Remarks
Qinghe County’s livelihood strategy is dominated by animal husbandry and agriculture practices. A households’ livelihood activity type is usually singular and not sufficiently diversified to ensure livelihood security. Pursuing the simultaneous development of animal husbandry, agriculture and non-farm employment may be the most desirable path to local rural sustainable development.
Differences exist both in the livelihood capital index and livelihood capital structure among the different types of households. Natural capital is at a relative disadvantage in Qinghe County, although a majority of households rely on it to make a living, particularly herdsmen (who participated in pastureland rehabilitation program) and agro-pastoralists (who participated in both pastureland rehabilitation and cultivated land reforestation programs).
Although choices vary among beneficiaries of different ecological compensation programs, the manner in which a household chooses livelihood options directly depends on the availability and accessibility of livelihood capital. The findings permit the conclusions below: human, natural and financial capital facilitate off-farm livelihoods practices, while productive capital tends to lead to on-farm livelihoods behaviour. Considering the fact that different groups of beneficiaries are better able to pursue off-farm livelihoods, as well as specific capitals are especially effective, future policies need to consider the demands of different beneficiaries to allocate resources appropriately and effectively.
4.2. Policy Recommendations
For a district such as Qinghe County in a less-developed region of western China, the questions of how to transform traditional nomadic production into modern animal husbandry and how to give consideration to both ecological and economic interests in land reforestation, are both difficult and important for local governments.
According to the different correlation types between livelihood capital and livelihood strategy, we recommend identifying the most significant and preferred compensation mode for different beneficiaries.
should be given to the academic education and training of the younger generation, giving them the capacity to move out of the farming and grazing community.
(2) In addition to continuing to improve the farmers’ human capital, it is vital to give priority to enhance farmers’ financial capital stock. Construction of agricultural information services, ability of accessing small loans and development of private financial capital are all the effective channels to broaden the diversification way of credit services. Improving the employment structure and helping rural surplus labor pursue off-farm livelihood activities is another method to accumulate their financial capital. Besides, further promote the reform of rural health care and education systems can reduce the cost of the financial capital.
(3) Agro-pastoralists should focus on supporting human capital and natural capital. On the basis of enhancing the stock of human capital, natural capital should be more actively protected. Consequently, we need to heavily emphasize the protection of natural capital from exploitation, henceforth, and enhance conversion abilities among human, physical, financial and social capitals. We need to be aware of the difficulty of restoring the ecological environment in this fragile arid zone once it has been destroyed.
Meanwhile, concentrated planning should guide households in appropriately using grant rewards, implementing grazing in warm seasons and feeding in cold seasons, as well as constructing commercial forests. Inevitably, a thorough system of stock breeding, disease control, forage production and product distribution network should be established.
Moreover, contractual responsibility and delimitation of prime grassland are greatly needed to strengthen supervision and regulation during the implementation of ecological compensation policies. To keep a monitoring mechanism running smoothly and effectively, it is also necessary to build a community team of county officials, township professionals and village operators and to include mutual supervision by households. Awards can be used to support a household that impeaches the overstocking behavior of others.
Above all, ecological compensation, as an ecological project, should be combined with various measures, such as poverty alleviation, agricultural science and technology, comprehensive agricultural development, water and soil conservation, adjustment of industrial structure, ecological migration, and settling of pastoralists, to ensure household earnings that will continue to increase beyond the compensation period, improve the integrity of regional economic development, and promote the formation of mechanisms for household self-development.
Acknowledgments
Author Contributions
Fei Wang, Degang Yang and Changjian Wang designed research; Fei Wang, Changjian Wang and Xinhuan Zhang performed research, Fei Wang and Changjian Wang contributed new analytic tools. All authors wrote the paper. All authors have read and approved the final manuscript.
Conflicts of Interest
The authors declare no conflict of interest. References
1. Reed, M.S.; Podesta, G.; Fazey, I.; Geeson, N.; Hessel, R.; Hubacek, K.; Letson, D.; Nainggolan, D.; Prell, C.; Rickenbach, M.G.; et al. Combining analytical frameworks to assess livelihood vulnerability to climate change and analyse adaptation options. Ecol. Econ. 2013, 94, 66–77. 2. Fang, Y.; Fan, J.; Shen, M.; Song, M. Sensitivity of livelihood strategy to livelihood capital in
mountain areas: Empirical analysis based on different settlements in the upper reaches of the Minjiang River, China. Ecol. Indic. 2014, 38, 225–235.
3. Liang, Y.; Li, S.; Feldman, M.; Daily, G.C. Does household composition matter? The impact of the Grain for Green Program on rural livelihoods in China. Ecol. Econ. 2012, 75,152–160.
4. Tang, Q.; Bennett, S.J.; Xu, Y.; Li, Y. Agricultural practices and sustainable livelihoods: Rural transformation within the Loess Plateau, China. Appl. Geogr. 2013, 41,15–23.
5. DFID. Sustainable livelihoods guidance sheets: Department for International Development. Available online: http://www.ennonline.net/resources/667 (accessed on 29 April 2014).
6. Kibria, A.M.G.; Jashimuddin, M.; Makoto, I. Effects of participatory forest management on livelihood capitals of the community in Cox’s Bazar, Bangladesh. J. For. Res. 2014, 19, 42–51. 7. Worku, A.; Pretzsch, J.; Kassa, H.; Auch, E. The significance of dry forest income for livelihood
resilience: The case of the pastoralists and agro-pastoralists in the drylands of southeastern Ethiopia. For. Policy Econ. 2014, 41,51–59.
8. Brown, M.A.; Clarkson, B.D.; Barton, B.J.; Joshi, C. Implementing ecological compensation in New Zealand: Stakeholder perspectives and a way forward. J. R. Soc. N. Z. 2014, 44,34–47. 9. Rao, H.H.; Lin, C.C.; Kong, H.; Jin, D.; Peng, B.R. Ecological damage compensation for coastal
sea area uses. Ecol. Indic. 2014, 38,149–158.
10. Vaissiere, A.C.; Levrel, H.; Hily, C.; le Guyader, D. Selecting ecological indicators to compare maintenance costs related to the compensation of damaged ecosystem services. Ecol. Indic. 2013,
29,255–269.
11. Tan, R.; Wang, R.; Sedlin, T. Land-Development Offset Policies in the Quest for Sustainability: What Can China Learn from Germany? Sustainability 2014, 6, 3400–3430.
12. Liu, J. Sustainability: A Household Word. Science 2010, 329, 512–512.
13. Fan, J.; Liang, Y.; Tao, A.; Sheng, K.; Ma, H.; Xu, Y.; Wang, C.; Sun, W. Energy policies for sustainable livelihoods and sustainable development of poor areas in China. Energy Policy 2011,
14. Liebenow, D.K.; Cohen, M.J.; Gumbricht, T.; Shepherd, K.D.; Shepherd, G. Do ecosystem services influence household wealth in rural Mali? Ecol. Econ. 2012, 82,33–44.
15. Zbinden, S.; Lee, D.R. Paying for environmental services: An analysis of participation in Costa Rica’s PSA program. World Dev. 2005, 33,255–272.
16. Fisher, J. No pay, no care? A case study exploring motivations for participation in payments for ecosystem services in Uganda. Oryx 2012, 46,45–54.
17. Paavola, J.; Hubacek, K. Ecosystem Services, Governance, and Stakeholder Participation: An Introduction. Ecol. Soc. 2013, 18,42.
18. Kong, F.; Xiong, K.; Zhang, N. Determinants of Farmers’ Willingness to Pay and Its Level for Ecological Compensation of Poyang Lake Wetland, China: A Household-Level Survey. Sustainability
2014, 6, 6714–6728.
19. Munoz-Pina, C.; Guevara, A.; Torres, J.M.; Brana, J. Paying for the hydrological services of Mexico’s forests: Analysis, negotiations and results. Ecol. Econ. 2008, 65,725–736.
20. Chevillat, V.; Balmer, O.; Birrer, S.; Doppler, V.; Graf, R.; Jenny, M.; Pfiffner, L.; Rudmann, C.; Zellweger-Fischer, J. Whole-farm advisory increases quality and quantity of ecological compensation areas. Agrarforschung Schweiz 2012, 3, 104–111.
21. Zhao, X.; Zhang, L.; Jiang, J.; Hou, C. The impact of ecological compensation on the farmers livelihood: A case study of Huanghe River Water Supply Areas of Gannan. Geogr. Res. 2013, 32, 531–542.
22. Junge, X.; Lindemann-Matthies, P.; Hunziker, M.; Schupbach, B. Aesthetic preferences of non-farmers and farmers for different land-use types and proportions of ecological compensation areas in the Swiss lowlands. Biol. Conserv. 2011, 144, 1430–1440.
23. Yi, F.; Chen, Z. Impact of SLCP on off- farm job. China Soft Sci. 2006, 8, 31–40.
24. Yan, J.; Wu, Y.; Zhang, Y.; Zhou, S. Livelihood diversification of farmers and nomads of eastern transect in Tibetan Plateau. J. Geogr. Sci. 2010, 20,757–770.
25. Pagiola, S.; Arcenas, A.; Platais, G. Can payments for environmental services help reduce poverty? An exploration of the issues and the evidence to date from Latin America. World Dev.
2005, 33,237–253.
26. Wunder, S.; Alban, M. Decentralized payments for environmental services: The cases of Pimampiro and PROFAFOR in Ecuador. Ecol. Econ. 2008, 65,685–698.
27. Turpie, J.K.; Marais, C.; Blignaut, J.N. The working for water programme: Evolution of a payments for ecosystem services mechanism that addresses both poverty and ecosystem service delivery in South Africa. Ecol. Econ. 2008, 65,788–798.
28. Bennett, M.; Franzel, S. Can organic and resource-conserving agriculture improve livelihoods? A synthesis. Int. J. Agric. Sustain. 2013, 11,193–215.
29. Ansoms, A.; McKay, A. A quantitative analysis of poverty and livelihood profiles: The case of rural Rwanda. Food Policy 2010, 35,584–598.
31. Executive Meeting of the State Council. Decision of establishing a subsidy and incentives system of grassland ecology protection to increase the income of herdsman. Available online: http://www.gov.cn/ldhd/2010–10/12/content_1720555.htm (accessed on 9 May 2014).
32. Wang, C.; Zhang, X.; Wang, F.; Lei, J.; Zhang, L. Decomposition of energy-related carbon emissions in Xinjiang and relative mitigation policy recommendations. Front. Earth Sci. 2015, 9, 65–76.
33. Wang, C.; Wang, F. Structural Decomposition Analysis of Carbon Emissions and Policy Recommendations for Energy Sustainability in Xinjiang. Sustainability 2015, 7, 7548–7567.
34. Morris, J.; Gowing, D.J.G.; Mills, J.; Dunderdale, J.A.L. Reconciling agricultural economic and environmental objectives: The case of recreating wetlands in the Fenland area of eastern England.
Agric. Ecosyst. Environ. 2000, 79,245–257.
35. Network, C.R. Accelerate the degradation of natural pasture, altay region, Xinjiang. Available online: http://www.cnr.cn/gundong/200811/t20081127_505162369.html (accessed on 10 October 2014).
36. Park, S.; Howden, M.; Crimp, S. Informing regional level policy development and actions for increased adaptive capacity in rural livelihoods. Environ. Sci. Policy 2012, 15,23–37.
37. Li, G.; Qiu, D.; Wang, L.; Wang, P.; Luo, D. Impacts of Difference among Livelihood Assets on the Choice of Economic Compensation Pattern for Farmer Households Farmland Protection in Chongqing City. Acta Geogr. Sin. 2012, 67,504–515.
38. Zhou, Y.; Xing, X.; Fang, K.; Liang, D.; Xu, C. Environmental efficiency analysis of power industry in China based on an entropy SBM model. Energy Policy 2013, 57,68–75.
39. Li, Y.; Zhao, L.; Suo, J. Comprehensive Assessment on Sustainable Development of Highway Transportation Capacity Based on Entropy Weight and TOPSIS. Sustainability 2014, 6, 4685–4693. 40. Chen, M.; Lu, D.; Zha, L. The comprehensive evaluation of China’s urbanization and effects on
resources and environment. J. Geogr. Sci. 2010, 20, 17–30.
41. Wang, C.; Zhang, X.; Hong-Ru, D.; Wang, F. Quantitative Analysis of the Dynamic Relationship Between Urbanization Level and Eco-environment Quantity in Xinjiang, China. J. Desert Res.
2012, 32,1794–1802.
42. Ge, Z.; Zhang, G.; Yang, H.; Zhang, P. Research on the Coupling Relationship between Land Use Change and the Farmer’s Livelihoods in Areas of Returning Farmland to Forest around Beijing—A case study of Laishui county. Issues For. Econ. 2014, 34, 62–67.
43. Falco, S.D.; Chavas, J.P.; Smale, M. Farmer Management of Production Risk on Degraded Lands: The Role of Wheat Genetic Diversity in Tigray Region, Ethiopia; IFPRI: Washington, DC, USA, 2006.
44. He, R.; Liu, S.; Liu, Y.; Li, L.; Liang, L.; Li, T. Evaluation and Spatial Distribution of Farmer’s Livelihood Capital in Representative Mountain Areas: A Case Study of Liangshan Yi Autonomous Prefecture of Sichuan, China. Mt. Res. 2014, 32,641–651.
45. Jiang, J.; Zhao, X.; Zhang, L.; Hou, C.; Li, W.; Yan, J. Study on Alternative Livelihood Choice and the Factors Affecting Livelihoods Choice: A Case of the Yellow River Water Supply Area of Gannan. J. Nat. Resour. 2012, 27,552–564.
47. Maharjan, K.L.; Joshi, N.P. Determinants of household food security in Nepal: A binary logistic regression analysis. J. Mt. Sci. 2011, 8, 403–413.