102–110頁 August 2016, pp. 102–110 特集ノート
The Prosodic Features of the “moe” and “tsun” Voices
Shigeto Kawahara*萌え声とツン声の韻律特徴
SUMMARY: As a case study of the general theme of this special issue—“different phonetic realizations of different so- cial characters”, this paper explores prosodic features of two types of prototypical maid voices, which have been emerging in recent Japanese culture: “moe” and “tsun”. Two professional voice actresses read simple Japanese SOV sentences in three types of voices: Moe, tsun, and normal. Acoustic analyses show that the moe voice is characterized by higher f0 and louder voice than the normal voice, whereas the tsun voice is characterized by lower f0 and quieter voice. The current study also finds that the speakers manipulate H-tone targets more extensively than L-tone targets to differentiate different speech styles, which is compatible with some previous studies and models of intonation. In terms of its research value, the current findings may not be ground-breaking; however, an additional value of this research lies in the fact that this sort of material makes phonetic analyses more accessible to the general public as well as to students in undergraduate education. To that end, some sample sounds are made available at http://bit.ly/1WCu5DA.
Key words: intonation, intensity, special speaking style, vocal attractiveness, tsun and moe
1. Introduction
This research note investigates the prosodic features of “tsun” and “moe” voices, two prototypical voice types observed in recent Japanese anime characters. Although these two concepts have existed for a while now, they are admittedly very difficult to define pre- cisely. Both terms refer to types of people in the recent Japanese anime characters and related cultural domains.
“Moe” can be characterized by a set of adjectives like
“pretty, cute, small, accessible, friendly, and cheerful”, whereas “tsun” would be characterized as “beautiful, tall, thin, shy, and inaccessible”. This paper is not a place to settle this debate; readers who are interested in this debate are encouraged to refer to their relevant wikipedia pages1) (Moe (slang) and tsundere, and pages referenced therein). The precise definitions of these concepts are not crucial in this paper—what is crucial is the fact that there is this distinction.
The psychological reality of this distinction has been tested in previous experiments on sound symbolism. It has been shown that maids working at Akihabara—and also more “generic” Japanese speakers—usually asso- ciate obstruents with names for tsun girls, and sono- rants with names for moe girls (Kawahara et al. 2015, Shinohara and Kawahara 2013). These results show
* The Institute of Cultural and Linguistic Studies, Keio University(慶應義塾大学言語文化研究所)
that there is a sense in which this distinction between tsun and moe has been established in the contemporary Japanese culture, and most likely, in the Japanese lan- guage as well.
These two types of girls are often distinguished in terms of their voice characteristics in anime (see also Starr 2015, Teshigawara 2003a, b for analyses of speech styles in Japanese anime). One salient feature is their intonational differences—but how do these intonatio- nal differences between different voice types manifest themselves? This question is the main topic of this pa- per. We can conceive of two (or three) hypotheses about how the different types of voices can differ from one an- other in terms of intonation. Consider Figure 1, which illustrates different ways in which different speech styles can affect low–high–low (LHL) tonal patterns.
One hypothesis is that voice differences vary in terms of pitch register, which would realize itself as shifts in pitch range, as in Figure 1(a). For example, moe voice can be shifted, with respect to the normal voice, higher overall. The alternative hypothesis is that the differ- ences may be more localized; instead of shifting the whole pitch range, speakers may choose some partic- ular tonal targets to express different kinds of voice, for example, primarily high tonal targets (Figure 1(b-1)) or low tonal targets (Figure 1(b-2)).
in pitch range/register; (b-1)=change in high tonal targets; (b-2) change in low tonal targets.
Kawahara (2013) found evidence for the pattern schematized in Figure 1(b-1). Kawahara (2013) ex- plored whether two maids working at a maid cafe in Akihabara make a difference between their own voice and maid voice in terms of intonational differences. The results demonstrate that maid voice is characterized by H(igh) tone targets, but not so much in the L(ow) tone targets.
However, Kawahara (2013) did not explore different types of maids, a distinction which was discovered to be crucial in their naming conventions in later studies (Kawahara et al. 2015, Shinohara and Kawahara 2013). This paper therefore explores the intonational differ- ences between these two types of maid voices, in terms of how they differ from the normal voice. The analysis is based on the speech of professional voice actresses, who were asked to produce two types of maid voices, tsun and moe.
2. Method
The data reported in this paper is a part of a larger pool of data based on the pronunciation of two profes- sional voice actresses. In general, they were asked to act as two types of Japanese maids, tsun and moe. They also produced all of the materials in their normal voice, except for a set of standard phrases used in a maid cafe.
2. 1 Stimuli
To explore the nature of intonational differences, sev- eral simple SOV Japanese sentences were prepared, which are listed in (1). An effort was made to avoid obstruents as much as possible, as they can perturb f0 contours. Both the subject and object nouns were four- mora long, and accented on the second (antepenulti- mate) mora. Hence they had a LHLL f0 contour. /ga/ and /o/ are nominative and accusative case particles. Three of the four verbs were five-mora long, and one of them was four-mora long. All verbs were accented
“Morimura felt sorry for Amalia.”
2. 2 Speakers
The speakers were two professional female voice ac- tresses. Speaker 1 had a long professional experience (her seventh year at the time of recording), whereas Speaker 2 had slightly less than two years of experi- ence. These two speakers had no trouble understanding the concept of tsun and moe.
2. 3 Recording
The recording took place in a sound-attenuated recording room at the National Institute for Japanese Language and Linguistics (NINJAL), Tachikawa, Tokyo, courtesy of Prof. Hanae Koiso. A portable recorder (TASCAM DR-40) was placed on a table in front of the speakers. Unlike “usual” speakers that we record in phonetic experiments, the voice actresses pre- ferred to stand up during their recording.
2. 4 Procedure
The recording for this experiment was embedded within a larger recording session, which lasted for two hours for each speaker. The total compensation was 20,000 yen for each speaker. The speakers were first asked to produce basic phrases that are associated with the maid or anime culture in Japanese, both in tsun and moe voices; e.g. okaerinasaimase goshujin- sama “welcome home, Master” and goshujin-sama sorosoro omezame-no ojikandesu“Master, it’s time to wake up” (some speech samples are made available at http://bit.ly/1WCu5DA). The stimuli were pre- sented in standard Japanese orthography, with a mixture of kanji and hiragana. The voice actresses examined all of the stimulus lists carefully before the recording, dur- ing which time they also confirmed the reading of the kanjicharacters as well as the accent placement of each stimulus word.
The recording was blocked in a Latin Square format: In the first session, the speakers were asked to read in the order of normal voice, tsun voice and moe voice.
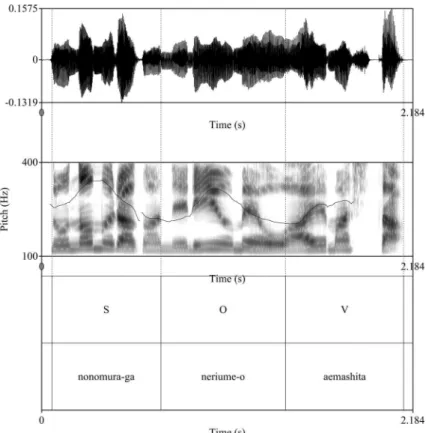
Figure 2 A sample illustrative annotation. S=Subject, O=Object, V=Verb. The second annotation tier showing actual Japanese words was added here for illustration. The intonational contour is superimposed on the spectrogram.
The second Latin Square order was tsun-moe-normal. The third was moe-normal-tsun. This Latin Square de- sign was deployed to control for potential order effects. Each sentence was repeated three times within each block. Therefore, each voice type was represented by 36 tokens for each speaker (3 Latin Square orders × 3 repetitions × 4 sentences).
2. 5 Analysis
Using Praat (Boersma 2001), for each sentence, three annotation intervals were assigned, each corresponding to the subject noun, the object noun and the verb, as shown in Figure 2.
To normalize the f0 contour of each sentence, each interval was divided into 15 equally-timed windows, and the mean f0 value was calculated within each window2). The last window of the verb often failed to produce f0 values due to sentence-final creakiness (Kawahara and Shinya 2008), and hence it was dis- carded from the following analysis.
Since Kawahara (2013) found that maids working in Akihabara made a difference between the maid voice
and their own voice in terms of the magnitude of LH rise and HL fall in LHL tonal sequences, these mea- sures were also calculated in the current study. First, within each of the SOV intervals, the maximum f0 (=H) was extracted; the minimum f0 before the H (=L1 in L1HL2) and the minimum f0 after H (=L2 in L1HL2)) were also extracted. Rise was calculated as the dif- ference between the maximum and the first minimum (=H−L1); Fall was calculated as the difference between the maximum and the second minimum (H−L2). All of these processes were automated using Praat’s scripting function.
As an additional analysis, maximum3) intensity was analyzed for each type of sentence, because the general auditory impression was that the moe voice was louder than the normal voice, and that the tsun voice was qui- eter than the normal voice. Since there is a sense in which loudness or intensity is one acoustic dimension that defines the general prosody of speech (e.g. Fry 1955, Plag et al. 2011), the intensity analysis was ex- pected to shed light on potential prosodic differences between the different voice patterns.
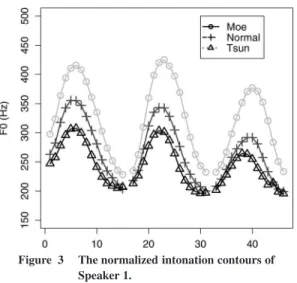
Figure 3 The normalized intonation contours of Speaker 1.
2. 6 Statistical Analyses and Predictions
R (R Development Core Team 1993–2016) was used to conduct statistical analyses as well as to create fig- ures of the results. Two statistical tests were deployed to compare the three hypotheses illustrated in Figure 1. First, a general linear model (glm) was fit to L-tone and H-tone targets, respectively, to examine whether and how the three different speech styles affect these tones. Second, a Brown–Forsythe test, which com- pares variability across conditions, was run to compare L-tones and H-tones. Figure 1(a) predicts no variabil- ity differences between L-tones and H-tones across dif- ferent speech styles; Figure 1(b-1) predicts H-tones to show more variability across different speech styles; Figure 1(b-2) predicts L-tones to show more variabil- ity across different speech styles.
3. Results: Intonation
Figure 3 illustrates the intonational contour of the three voice types of Speaker 1: Normal (+), tsun (△) and moe (◦). The first observation is that with respect to the normal voice, the tsun voice is lower, whereas the moe voice is higher.
Another observation is that the differences between the three intonational contours manifest themselves more when the f0 is high (i.e. H-tone targets) than when it is low (i.e. L-tone targets). A glm model with the normal voice as a baseline reveals that the tsun voice and normal voice do not differ in the L-tones (t(318) = −0.94, n.s.), but the moe voice is slightly higher than the normal voice (t(318) = 5.62, p < .001). Another glm model, targeting H-tones, shows that the
ural variability than L-tones? To address this alterna- tive, another Brown–Forsythe test was run using just the data from the object nouns of the normal voice— which is probably the “most neutral” environment (nei- ther sentence-initial nor sentence-final)—to compare the natural variability between H-tones and L-tones. This test reveals no significant differences (F(1, 72) = 1.07, n.s.). Another alternative would be to say that H-tones show more variability due to syntactic differ- ences than do L-tones. To address this alternative, an- other Brown–Forsythe test was run using only the data from object nouns including all the three speech styles. The result is significant (F(1, 212) = 74.4, p < .001). Therefore, the higher variability in H-tones seem to come about at least partly due to speech style differ- ences.
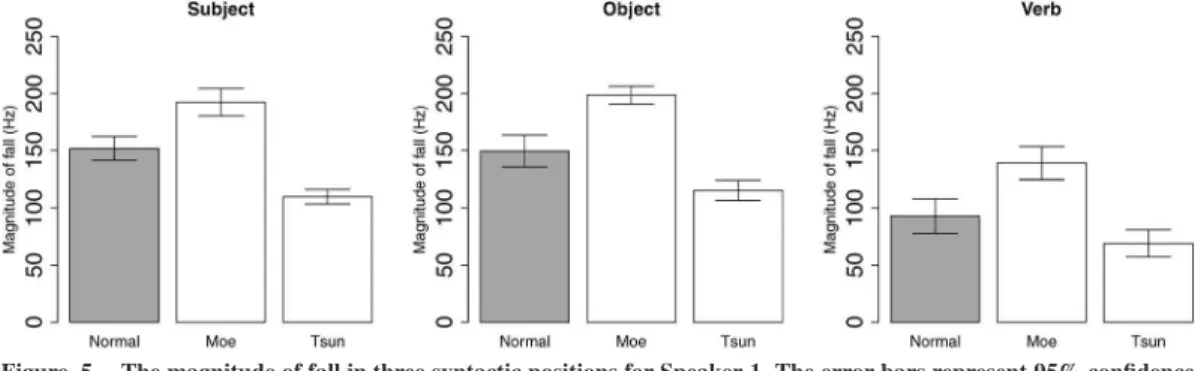
The observation that a speaker expresses the speech style differences more clearly on the H-tone targets than on the L-tone targets is compatible with the finding by Kawahara (2013). It also predicts that the magnitude of rises and falls should be bigger for the moe voice than for the normal voice, and bigger for the normal voice than for the tsun voice (see Figure 1(b-1)). The pat- terns in Figure 1(b-2) predict the opposite. Figure 1(a) predicts no differences across the speech styles. To test these predictions, the magnitude of rises and falls of Speaker 1 is shown in Figure 4 and 5, respectively. The error bars represent 95% confidence intervals.
Across all three syntactic positions (subject, object, verb), we observe that the moe voice shows the largest magnitude of rise and fall, the tsun voice shows the smallest, and the normal voice lies in-between. A large number of repetitive multiple comparisons (3 types of voice × 3 syntactic position × 2 rise and fall = 18 com- parison) was avoided, as it would increase the probabil- ity of a Type 1 error (Myers and Well 2003); however, the fact that the error bars do not overlap seems to sug- gest that all differences between the three voice types are reliable throughout. These results corroborate the observation we made above that the speaker manipu- lates H-tones more than L-tones, rather than changing
Figure 4 The magnitude of rise in three syntactic positions for Speaker 1. The error bars represent 95% confidence intervals.
Figure 5 The magnitude of fall in three syntactic positions for Speaker 1. The error bars represent 95% confidence intervals.
her whole pitch range.
Let us now move on to the next speaker. Figure 6 shows the intonational contours of the tsun, moe and normal voice of Speaker 2. As was the case for Speaker 1, the moe voice is generally higher than the normal voice, and the tsun voice is lower than the normal voice. Unlike Speaker 1, we observe clear separations be- tween the three voice types in the L-tones (normal vs. tsun: t = −4.38, p < .001; normal vs. moe: t = 15.31, p < .001). Nevertheless, we observe larger sep- arations in the patterning of H-tones (normal vs. tsun:
−9.08, p < .001; normal vs. moe: t = 24.0, p < .001.). A Brown–Forsythe test shows that H-tones show more variability than L-tones (F(1, 640) = 129.41, p < .001), indicating that this speaker, too, manipulates H-tone targets more than L-tone targets to express different speech styles4). We may be able to consider this pattern to be a combination of Figure 1(a) and Figure 1(b-1).
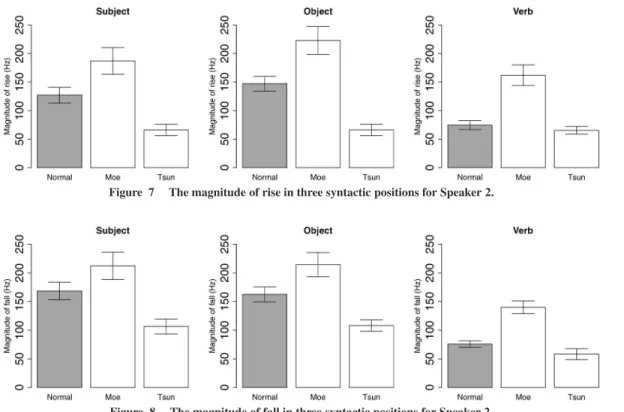
The magnitude of the rises and falls of Speaker 2 is shown in Figures 7 and 8. The fact that the moe voice shows larger rises and falls compared to the normal voice supports the previous observation that H-tone is raised more than L-tone. Also, similarly, the fact that
Figure 6 The normalized intonation contours of Speaker 2.
the tsun voice shows smaller rises and falls with respect to the normal voice indicates that the L-tone is not low- ered as much as H-tones.
Figure 7 The magnitude of rise in three syntactic positions for Speaker 2.
Figure 8 The magnitude of fall in three syntactic positions for Speaker 2.
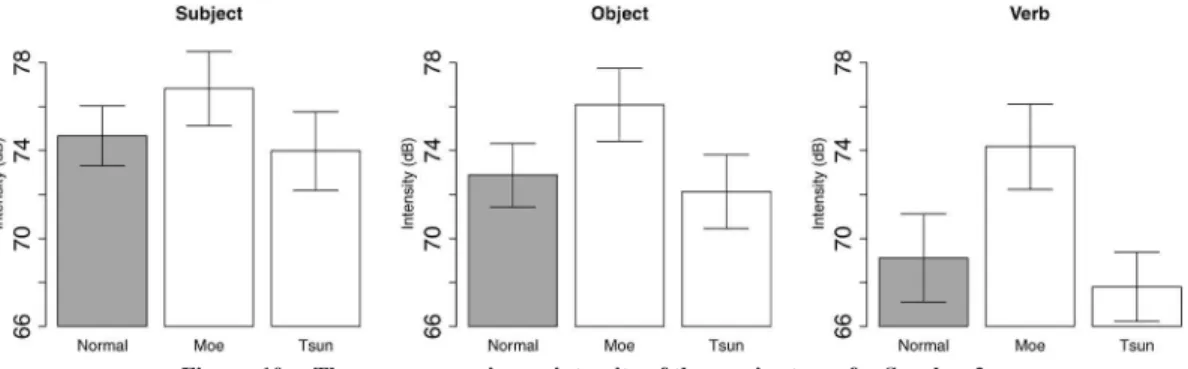
4. Results: Intensity
Figures 9 and 10 show the average maximum inten- sity of three voice types for Speakers 1 and 2. The results confirm the impressionistic observation stated in the method section—the moe voice is loud and the tsun voice is quiet. A glm analysis shows that for Speaker 1, the moe voice is louder than the normal voice (t = 8.76, p < .001), and the tsun voice is qui- eter than the normal voice (t = −7.24, p < .001). The same patterns holds for Speaker 2, although the differ- ence between tsun voice and the normal voice is less clear. Statistically speaking, however, the moe voice is louder than the normal voice (t = 8.42, p < .001), and the tsun voice is indeed quieter than the normal voice (t = −2.24, p < .05).
5. Discussion
For both speakers, the moe voice is generally char- acterized by higher voice with respect to their normal voice, whereas the tsun voice is characterized by lower voice. These patterns make intuitive sense: The moe voice, which capitalizes on “cuteness”, involves higher voice. On the other hand, the tsun voice, which is asso-
ciated with “inaccessibility”, involves lower voice. We can perhaps understand these associations in terms of Ohala’s (1984, 1994) frequency code hypothesis: The higher voice implies smallness and the lack of animos- ity, whereas the lower voice implies threat or inacces- sibility. Also relevant is the finding that lower f0 is of- ten associated with a “cold” angry voice (Chuenwat- tanapranithi et al. 2008, cf. Erickson 2005 for a “hot” angry voice), and that higher f0 is considered to be more attractive than lower voice for women’s voice (Collins and Missing 2003, Feinberg et al. 2008)5).
The two voice actresses recorded in this project, es- pecially Speaker 1, change H-tone targets more than L-tone targets. This patterning is compatible with Fujisaki’s model of intonation (Fujisaki 1983, Fujisaki and Hirose 1984), in which much of the intonational variation is made at high frequency levels rather than at the intonational baseline level (see also Pierrehum- bert and Beckman 1988, chapter 7). The moe voice of Speaker 2 may deviate from this model, but it is nevertheless true that this speaker changes H-tone tar- gets more than L-tone targets. It could be the case that Speaker 2 is using falsetto—or what is known as “ura- goe” in Japanese6)—for the moe voice, which allows her to change her L-baseline more drastically than nor-
Figure 9 The average maximum intensity of three voice types for Speaker 1. The error bars are 95% confidence intervals.
Figure 10 The average maximum intensity of three voice types for Speaker 2.
mal speech, but there is nevertheless a general pressure to keep L-tones constant across different voice styles, at least more so than H-tones. Alternatively, we can also understand the situation as follows: Speaker 2 wants to keep the L-tone baselines, but her H-tone targets for the moe voice are simply too high to start with her L-tone baseline. At any rate, the descriptive generalization is clear—the H-tone targets are raised more than the L- tone targets. It may be possible that Speaker 1 keeps the low baseline more consistently than Speaker 2 be- cause Speaker 1 had a more extensive experience as a professional voice actress—this speculation, however, needs to be tested with more speakers in future experi- mentation.
The intensity differences observed in this experiment can perhaps be interpreted in the following way. The moe voice represents a “lively” character who enunci- ates lucidly. The tsun voice on the other hand represents a “cool, calm and inaccessible” character, who would speak in a quieter voice. Admittedly, these are post-hoc explanations, and are not as explanatory as one wishes, because, as stated in the introduction, moe and tsun can be defined in terms of so many different parameters. At the very least, the intensity patterns seem to make intu-
itive sense.
Overall, this paper focused on the prosodic aspects of tsun and moe voice, which are relatively easy to study. However, it is certainly likely that there are other dimensions in which these voice types may dif- fer; e.g., impressionistically speaking, the moe voice sounds more nasalized than the normal voice; the tsun voice sounds breathier than the normal voice. Studying these aspects is left for future research (see Sadanobu 2015, Starr 2015, Teshigawara 2003a, and Teshigawara 2003b in this regard). For example, Teshigawara (2003a, b) argues that villains’ voices in anime are char- acterized by pharyngeal constriction—would we ob- serve the same characteristics in tsun voice (although tsun girls are not exactly villains)? What about other acoustic dimensions that potentially affect “vocal at- tractiveness/asethetics”? (see Babel et al. 2014, Ba- bel and McGuire 2015, Starr 2015 and references cited therein.)
One final remark: In terms of research value, the find- ings of this paper may not be ground-breaking. How- ever, this sort of research has two additional benefits. One is that this kind of research is useful for phoneti- cians to reach out to the general public. Showing that
A sample of each type of sentence can be downloaded from http://bit.ly/1WCu5DA.
Acknowledgements
Thanks to Kazuko Shinohara for her collaboration on this general project, and to Akiko Takemura for her help with the annotation in Praat. I am also grateful to Toshio Matsuura and two anonymous reviewers for comments on a previous version of the paper, as well as Helen Stickney for her careful proofreading. This work is partially supported by JSPS KAKENHI Grant
#26770147 and #26284059. All remaining errors are mine.
Notes
1) Tsun is often used in a larger phrase “tsun-dere”, but it can also be used in isolation. In fact, tsun can be un- derstood as one phase of tsundere, either diarchonically or synchronically (Togashi 2009). Moe voice is perhaps very similar, if not identical, to what Starr (2015) refers to as
“sweet voice”.
2) The version of Praat used in this analysis was 6.0.15. A similar analytical technique was deployed in Déprez et al. (2013) and Kawahara (2013).
3) A similar analysis was conducted with average intensity, which yielded very similar results.
4) No inherent differences are found in the variability of H- tones and L-tones in the object nouns of the normal voice (F(1, 72) = 0.52, n.s.). A Brown–Forsythe test using only the object noun data across the three speech styles reveals a significant effect (F(1, 216) = 37.5, p < .001), showing that the variability difference does not (solely) come from amenability to syntactic differences.
5) An anonymous reviewer pointed out that extremely high F0—for example, screaming—could be disturbing. There- fore, there has to be a threshold, above which high voice can be taken to be non-attractive. In general, characteris- tics of vocal aesthetics should probably be more nuanced than “high f0 is cute for women” (Babel et al. 2014). 6) An anonymous reviewer pointed out that falsetto “is not
a term readily agreed upon”. The precise vocal fold char- acteristics of this type of voice, however we call it, is an
Boersma, P. (2001) “Praat, a system for doing phonetics by computer.” Glot International 5, 341–345.
Chuenwattanapranithi, S., Y. Xu, B. Thipakorn and S. Manee- wongvatana (2008) “Encoding emotions in speech with the size code.” Phonetica 65, 210–230.
Collins, S. A. and C. Missing (2003) “Vocal and visual attrac- tiveness are related in women.” Animal Behaviour 65, 997– 1004.
Déprez, V., K. Syrett and S. Kawahara (2013) “The interac- tion of syntax, prosody, and discourse in licensing French wh-in-situquestions.” Lingua 124, 4–19.
Erickson, D. (2005) “Expressive speech: Production, percep- tion and applications to speech synthesis.” Acousatical Sci- ence and Technology26, 317–325.
Feinberg, D. R., L. M. DeBruine, B. C. Jones and D. I. Perrett (2008) “The role of femininity and averageness of voice pitch in asethetic judgments of women’s voices.” Percep- tion37, 615–623.
Fry, D. B. (1955) “Duration and intensity as physical corre- lates of linguistic stress.” Journal of the Acoustical Society of America27, 1765–1768.
Fujisaki, H. (1983) “Dynamic characteristics of voice funda- mental frequency in speech and singing.” In P. F. Mac- neilage (ed.) The production of speech, 39–55. New York: Springer.
Fujisaki, H. and K. Hirose (1984) “Analysis of voice fun- damental frequency contours for declarative sentences of Japanese.” Journal of the Acoustical Society of Japan 5, 233–242.
Kawahara, S. (2013) “The phonetics of Japanese maid voice I: A preliminary study.” On-in Kenkyuu [Phonological Stud- ies] 16, 19–28.
Kawahara, S., K. Shinohara and J. Grady (2015) “Iconic in- ferences about personality: From sounds and shapes.” In M. Hiraga, W. Herlofsky, K. Shinohara and K. Akita (eds.) Iconicity: East meets west, 57–69. Amsterdam: John Ben- jamins.
Kawahara, S. and T. Shinya (2008) “The intonation of gap- ping and coordination in Japanese: Evidence for Intonatio- nal Phrase and Utterance.” Phonetica 65, 62–105. Myers, J. and A. Well (2003) Research design and statistical
analysis. Mahwah: Lawrence Erlbaum Associates Publish- ers.
Ohala, J. J. (1984) “An ethological perspective on common cross-language utilization of f0 of voice.” Phonetica 41, 1–16.
Ohala, J. J. (1994) “The frequency code underlies the sound symbolic use of voice pitch.” In L. Hinton, J. Nichols and J. J. Ohala (eds.) Sound symbolism, 325–347. Cambridge: Cambrdige University Press.
Pierrehumbert, J. B. and M. Beckman (1988) Japanese tone structure. Cambridge: MIT Press.
Plag, I., G. Kunter and M. Schramm (2011) “Acoustic corre- lates of primary and secondary stress in North American English.” Journal of Phonetics 39, 362–374.
R Development Core Team (1993–2016) R: A language and environment for statistical computing. Vienna, Austria: R Foundation for Statistical Computing.
Sadanobu, T. (2015) “Four types of linguistic resources for variable speaking units in common Japanese.” Journal of the Phonetic Society of Japan19, 109–114.
Shinohara, K. and S. Kawahara (2013) “The sound symbolic nature of Japanese maid names.” Proceedings of Japan Cognitive Linguistics Association13, 183–193.
Starr, R. L. (2015) “Sweet voice: The role of voice quality in a Japanese feminie style.” Language in Society 44, 1–34. Teshigawara, M. (2003a) Voices in Japanese animation. Doc-
toral dissertation, University of Victoria.
Teshigawara, M. (2003b) “Voices in Japanese animation: How people percieve voices of good guys and bad guys.” Pro- ceedings of ICPhS 15, 2413–2416.
Togashi, J.-I. (2009) A case study of tsundere expression: Tsundere attributes and their linguistic expressions. Ms., Daito Bunka University.
(Recieved Mar. 8, 2016, Accepted May 2, 2016)