Measurement of the single
π
0production rate in neutral current neutrino
interactions on water
K. Abe,47J. Amey,16C. Andreopoulos,45,26M. Antonova,21S. Aoki,23A. Ariga,1Y. Ashida,24S. Assylbekov,7D. Autiero,28 S. Ban,24M. Barbi,39G. J. Barker,55G. Barr,35C. Barry,26P. Bartet-Friburg,36M. Batkiewicz,12V. Berardi,17 S. Berkman,3,51S. Bhadra,60S. Bienstock,36A. Blondel,11S. Bolognesi,5S. Bordoni,14,† S. B. Boyd,55D. Brailsford,25 A. Bravar,11C. Bronner,22M. Buizza Avanzini,9R. G. Calland,22T. Campbell,7S. Cao,13S. L. Cartwright,43R. Castillo,14
M. G. Catanesi,17A. Cervera,15A. Chappell,55C. Checchia,19D. Cherdack,7 N. Chikuma,46G. Christodoulou,26 A. Clifton,7 J. Coleman,26G. Collazuol,19D. Coplowe,35L. Cremonesi,38 A. Cudd,29A. Dabrowska,12G. De Rosa,18 T. Dealtry,25P. F. Denner,55S. R. Dennis,26C. Densham,45D. Dewhurst,35F. Di Lodovico,38S. Di Luise,10S. Dolan,35
O. Drapier,9 K. E. Duffy,35J. Dumarchez,36M. Dunkman,29P. Dunne,16 M. Dziewiecki,54S. Emery-Schrenk,5 A. Ereditato,1 T. Feusels,3,51A. J. Finch,25 G. A. Fiorentini,60M. Friend,13,‡ Y. Fujii,13,‡ D. Fukuda,33Y. Fukuda,30 A. P. Furmanski,55V. Galymov,28A. Garcia,14S. G. Giffin,39C. Giganti,36K. Gilje,32F. Gizzarelli,5T. Golan,58M. Gonin,9 N. Grant,55D. R. Hadley,55L. Haegel,11J. T. Haigh,55P. Hamilton,16D. Hansen,37J. Harada,34T. Hara,23M. Hartz,22,51
T. Hasegawa,13,‡ N. C. Hastings,39T. Hayashino,24Y. Hayato,47,22R. L. Helmer,51M. Hierholzer,1 A. Hillairet,52 A. Himmel,8T. Hiraki,24A. Hiramoto,24S. Hirota,24M. Hogan,7J. Holeczek,44F. Hosomi,46K. Huang,24A. K. Ichikawa,24 K. Ieki,24M. Ikeda,47J. Imber,9J. Insler,27R. A. Intonti,17T. J. Irvine,48T. Ishida,13,‡T. Ishii,13,‡E. Iwai,13K. Iwamoto,46
A. Izmaylov,15,21A. Jacob,35B. Jamieson,57M. Jiang,24 S. Johnson,6 J. H. Jo,32P. Jonsson,16C. K. Jung,32,§ M. Kabirnezhad,31A. C. Kaboth,41,45T. Kajita,48,§H. Kakuno,49J. Kameda,47D. Karlen,52,51I. Karpikov,21T. Katori,38
E. Kearns,2,22,§M. Khabibullin,21A. Khotjantsev,21 D. Kielczewska,53,*T. Kikawa,24 H. Kim,34J. Kim,3,51S. King,38 J. Kisiel,44A. Knight,55A. Knox,25T. Kobayashi,13,‡ L. Koch,42T. Koga,46P. P. Koller,1 A. Konaka,51 K. Kondo,24 A. Kopylov,21 L. L. Kormos,25A. Korzenev,11Y. Koshio,33,§K. Kowalik,31 W. Kropp,4 Y. Kudenko,21,∥R. Kurjata,54 T. Kutter,27J. Lagoda,31I. Lamont,25M. Lamoureux,5E. Larkin,55P. Lasorak,38M. Laveder,19M. Lawe,25M. Lazos,26 M. Licciardi,9 T. Lindner,51Z. J. Liptak,6R. P. Litchfield,16X. Li,32A. Longhin,19J. P. Lopez,6T. Lou,46L. Ludovici,20 X. Lu,35L. Magaletti,17K. Mahn,29M. Malek,43S. Manly,40L. Maret,11A. D. Marino,6 J. Marteau,28J. F. Martin,50
P. Martins,38S. Martynenko,32T. Maruyama,13,‡ V. Matveev,21K. Mavrokoridis,26 W. Y. Ma,16E. Mazzucato,5 M. McCarthy,60N. McCauley,26K. S. McFarland,40C. McGrew,32A. Mefodiev,21 C. Metelko,26M. Mezzetto,19 P. Mijakowski,31 A. Minamino,59O. Mineev,21 S. Mine,4 A. Missert,6M. Miura,47,§ S. Moriyama,47,§ J. Morrison,29 Th. A. Mueller,9 S. Murphy,10J. Myslik,52T. Nakadaira,13,‡ M. Nakahata,47,22 K. G. Nakamura,24 K. Nakamura,22,13,‡
K. D. Nakamura,24Y. Nakanishi,24S. Nakayama,47,§T. Nakaya,24,22K. Nakayoshi,13,‡ C. Nantais,50C. Nielsen,3,51 M. Nirkko,1K. Nishikawa,13,‡Y. Nishimura,48P. Novella,15J. Nowak,25H. M. O’Keeffe,25R. Ohta,13,‡K. Okumura,48,22
T. Okusawa,34W. Oryszczak,53S. M. Oser,3,51T. Ovsyannikova,21R. A. Owen,38Y. Oyama,13,‡ V. Palladino,18 J. L. Palomino,32V. Paolone,37N. D. Patel,24P. Paudyal,26M. Pavin,36D. Payne,26J. D. Perkin,43Y. Petrov,3,51L. Pickard,43 L. Pickering,16E. S. Pinzon Guerra,60C. Pistillo,1B. Popov,36,¶M. Posiadala-Zezula,53J.-M. Poutissou,51R. Poutissou,51
A. Pritchard,26P. Przewlocki,31 B. Quilain,24T. Radermacher,42E. Radicioni,17P. N. Ratoff,25M. Ravonel,11 M. A. Rayner,11A. Redij,1 E. Reinherz-Aronis,7C. Riccio,18P. Rojas,7E. Rondio,31B. Rossi,18S. Roth,42A. Rubbia,10 A. C. Ruggeri,18A. Rychter,54R. Sacco,38K. Sakashita,13,‡F. Sánchez,14F. Sato,13E. Scantamburlo,11K. Scholberg,8,§ J. Schwehr,7 M. Scott,51Y. Seiya,34 T. Sekiguchi,13,‡ H. Sekiya,47,22,§D. Sgalaberna,11R. Shah,45,35 A. Shaikhiev,21 F. Shaker,57D. Shaw,25M. Shiozawa,47,22T. Shirahige,33S. Short,38M. Smy,4J. T. Sobczyk,58H. Sobel,4,22M. Sorel,15 L. Southwell,25P. Stamoulis,15J. Steinmann,42T. Stewart,45P. Stowell,43Y. Suda,46S. Suvorov,21A. Suzuki,23K. Suzuki,24 S. Y. Suzuki,13,‡ Y. Suzuki,22R. Tacik,39,51M. Tada,13,‡ S. Takahashi,24A. Takeda,47Y. Takeuchi,23,22R. Tamura,46 H. K. Tanaka,47,§H. A. Tanaka,50,51,**D. Terhorst,42R. Terri,38T. Thakore,27L. F. Thompson,43S. Tobayama,3,51W. Toki,7
T. Tomura,47C. Touramanis,26T. Tsukamoto,13,‡ M. Tzanov,27Y. Uchida,16A. Vacheret,16M. Vagins,22,4 Z. Vallari,32G. Vasseur,5C. Vilela,32T. Vladisavljevic,35,22T. Wachala,12K. Wakamatsu,34C. W. Walter,8,§D. Wark,45,35
W. Warzycha,53M. O. Wascko,16A. Weber,45,35 R. Wendell,24,§R. J. Wilkes,56M. J. Wilking,32 C. Wilkinson,1 J. R. Wilson,38R. J. Wilson,7 C. Wret,16Y. Yamada,13,‡ K. Yamamoto,34M. Yamamoto,24 C. Yanagisawa,32,††T. Yano,23 S. Yen,51N. Yershov,21M. Yokoyama,46,§ J. Yoo,27K. Yoshida,24T. Yuan,6 M. Yu,60 A. Zalewska,12J. Zalipska,31L. Zambelli,13,‡K. Zaremba,54M. Ziembicki,54E. D. Zimmerman,6M. Zito,5and J.Żmuda58
(T2K Collaboration)
1
University of Bern, Albert Einstein Center for Fundamental Physics, Laboratory for High Energy Physics (LHEP), Bern, Switzerland
2
Boston University, Department of Physics, Boston, Massachusetts, USA
PHYSICAL REVIEW D
97,
032002 (2018)
3
University of British Columbia, Department of Physics and Astronomy, Vancouver, British Columbia, Canada
4
University of California, Irvine, Department of Physics and Astronomy, Irvine, California, USA
5
IRFU, CEA Saclay, Gif-sur-Yvette, France
6
University of Colorado at Boulder, Department of Physics, Boulder, Colorado, USA
7
Colorado State University, Department of Physics, Fort Collins, Colorado, USA
8
Duke University, Department of Physics, Durham, North Carolina, USA
9
Ecole Polytechnique, IN2P3-CNRS, Laboratoire Leprince-Ringuet, Palaiseau, France
10
ETH Zurich, Institute for Particle Physics, Zurich, Switzerland
11
University of Geneva, Section de Physique, DPNC, Geneva, Switzerland
12
H. Niewodniczanski Institute of Nuclear Physics PAN, Cracow, Poland
13
High Energy Accelerator Research Organization (KEK), Tsukuba, Ibaraki, Japan
14
Institut de Fisica d’Altes Energies (IFAE), The Barcelona Institute of Science and Technology, Campus UAB, Bellaterra (Barcelona) Spain
15
IFIC (CSIC and University of Valencia), Valencia, Spain
16
Imperial College London, Department of Physics, London, United Kingdom
17
INFN Sezione di Bari and Universit`a e Politecnico di Bari, Dipartimento Interuniversitario di Fisica, Bari, Italy
18
INFN Sezione di Napoli and Universit `a di Napoli, Dipartimento di Fisica, Napoli, Italy
19
INFN Sezione di Padova and Universit `a di Padova, Dipartimento di Fisica, Padova, Italy
20
INFN Sezione di Roma and Universit `a di Roma“La Sapienza,”Roma, Italy
21
Institute for Nuclear Research of the Russian Academy of Sciences, Moscow, Russia
22
Kavli Institute for the Physics and Mathematics of the Universe (WPI), The University of Tokyo Institutes for Advanced Study, University of Tokyo, Kashiwa, Chiba, Japan
23
Kobe University, Kobe, Japan
24
Kyoto University, Department of Physics, Kyoto, Japan
25
Lancaster University, Physics Department, Lancaster, United Kingdom
26
University of Liverpool, Department of Physics, Liverpool, United Kingdom
27
Louisiana State University, Department of Physics and Astronomy, Baton Rouge, Louisiana, USA
28
Universit´e de Lyon, Universit´e Claude Bernard Lyon 1, IPN Lyon (IN2P3), Villeurbanne, France
29
Michigan State University, Department of Physics and Astronomy, East Lansing, Michigan, USA
30
Miyagi University of Education, Department of Physics, Sendai, Japan
31
National Centre for Nuclear Research, Warsaw, Poland
32
State University of New York at Stony Brook, Department of Physics and Astronomy, Stony Brook, New York, USA
33
Okayama University, Department of Physics, Okayama, Japan
34
Osaka City University, Department of Physics, Osaka, Japan
35
Oxford University, Department of Physics, Oxford, United Kingdom
36
UPMC, Universit´e Paris Diderot, CNRS/IN2P3,
Laboratoire de Physique Nucl´eaire et de Hautes Energies (LPNHE), Paris, France
37
University of Pittsburgh, Department of Physics and Astronomy, Pittsburgh, Pennsylvania, USA
38
Queen Mary University of London, School of Physics and Astronomy, London, United Kingdom
39
University of Regina, Department of Physics, Regina, Saskatchewan, Canada
40
University of Rochester, Department of Physics and Astronomy, Rochester, New York, USA
41
Royal Holloway University of London, Department of Physics, Egham, Surrey, United Kingdom
42
RWTH Aachen University, III. Physikalisches Institut, Aachen, Germany
43
University of Sheffield, Department of Physics and Astronomy, Sheffield, United Kingdom
44
University of Silesia, Institute of Physics, Katowice, Poland
45
STFC, Rutherford Appleton Laboratory, Harwell Oxford, and Daresbury Laboratory, Warrington, United Kingdom
46
University of Tokyo, Department of Physics, Tokyo, Japan
47
University of Tokyo, Institute for Cosmic Ray Research, Kamioka Observatory, Kamioka, Japan
48
University of Tokyo, Institute for Cosmic Ray Research, Research Center for Cosmic Neutrinos, Kashiwa, Japan
49
Tokyo Metropolitan University, Department of Physics, Tokyo, Japan
50
University of Toronto, Department of Physics, Toronto, Ontario, Canada
51
TRIUMF, Vancouver, British Columbia, Canada
52
University of Victoria, Department of Physics and Astronomy, Victoria, British Columbia, Canada
53
University of Warsaw, Faculty of Physics, Warsaw, Poland
54
55
University of Warwick, Department of Physics, Coventry, United Kingdom
56
University of Washington, Department of Physics, Seattle, Washington, USA
57
University of Winnipeg, Department of Physics, Winnipeg, Manitoba, Canada
58
Wroclaw University, Faculty of Physics and Astronomy, Wroclaw, Poland
59
Yokohama National University, Faculty of Engineering, Yokohama, Japan
60
York University, Department of Physics and Astronomy, Toronto, Ontario, Canada
(Received 19 May 2017; published 2 February 2018)
The single π0
production rate in neutral current neutrino interactions on water in a neutrino beam with a peak neutrino energy of 0.6 GeV has been measured using the PØD, one of the subdetectors of the T2K near detector. The production rate was measured for data taking periods when the PØD contained water (2.64×10²⁰
protons-on-target) and also periods without water (3.49×10²⁰
protons-on-target). A mea-surement of the neutral current singleπ0
production rate on water is made using appropriate subtraction of the production rate with water in from the rate with water out of the target region. The subtraction analysis yields 1064169signal events where the uncertainties are statistical (stat.) and systematic (sys.) respectively. This is consistent with the prediction of 157 events from the nominal simulation. The measured to expected ratio is0.680.26ðstatÞ 0.44ðsysÞ 0.12ðfluxÞ. The nominal simulation uses a flux integrated cross section of7.63×10−39 cm2per nucleon with an average neutrino interaction energy of 1.3 GeV.
DOI:10.1103/PhysRevD.97.032002
I. INTRODUCTION
The Tokai to Kamioka (T2K) long-baseline neutrino experiment is designed to make precision measurements of the neutrino oscillation parametersθ23andΔm
2 32viaνμ
disappearance and to search for the mixing angleθ13viaνe appearance in aνμbeam. An intense, almost pure beam ofνμ
is produced by colliding 30 GeV protons with a graphite target at the J-PARC facility in Tokai-mura, Ibaraki[1]. The resultant neutrino beam is directed 2.5° away from the axis between the target and the far detector, resulting in a narrow band beam with peak energy near 0.6 GeV. The direction, stability and flux of the beam are measured using a suite of near detectors (ND280) located 280 m downstream of the target. At this distance, the neutrino beam is not expected to have been affected by oscillations. The far detector, Super-Kamiokande, is located 295 km downstream of the target, a distance consistent with the oscillation maximum.
Super-Kamiokande uses water as both a detection medium and target to measure the amount of νe and νμ present after
oscillation has occurred. As neutral currentπ0 events can cause an irreducible background to theνeappearance signal, it is important to provide a constraint using measurements of the production rate on water using the near detector.
This paper details the first measurement of neutral current single π0 production (NC1π0) on water, using a neutrino beam with peak energy of 0.6 GeV[2]. The mean neutrino energy for the NC1π0interactions selected in this
analysis is 1.3 GeV.
Two processes dominate neutral current single π0
pro-duction by neutrinos: resonant propro-duction and coherent scattering. In resonant production, a neutrino interacts with a nucleon to produce a baryonic resonance, usually
Δð1232Þ, which subsequently decays to a nucleon and aπ0.
Coherent scattering occurs when a neutrino interacts with the entire nucleus, exchanging little energy and leaving the nucleus in its ground state. The dominant decay mode for a
π0
is to two photons [3] and if one decay photon is not detected, a NC1π0
event can be indistinguishable from a charged current νe interaction, leading to an irreducible background in νμ→νe oscillation measurements. While previous measurements performed using the T2K near detector have improved our knowledge of sub-GeV neu-trino interactions, the rate of NC1π0production on water is
still relatively unknown at the neutrino energies of the T2K beam. Measurements of NC1π0production on a variety of
targets and different neutrino energy distributions have been made in other experiments[4–8].
In this analysis, the signal is defined by the final state particles, with a NC1π0interaction defined by a single
π0
particle exiting the nucleus along with any number of
*
Deceased. †
Present address: CERN. ‡
Also at J-PARC, Tokai, Japan. §
Affiliated member at Kavli IPMU (WPI), the University of Tokyo, Japan.
∥
Also at National Research Nuclear University“MEPhI”and Moscow Institute of Physics and Technology, Moscow, Russia.
¶
Also at JINR, Dubna, Russia. **
Also at Institute of Particle Physics, Canada. ††
Also at BMCC/CUNY, Science Department, New York, New York, USA.
Published by the American Physical Society under the terms of the Creative Commons Attribution 4.0 International license. Further distribution of this work must maintain attribution to the author(s) and the published article’s title, journal citation, and DOI. Funded by SCOAP3.
MEASUREMENT OF THE SINGLEπ0 PRODUCTION… PHYS. REV. D
97,032002 (2018)
protons and neutrons but no charged leptons or other mesons. The rate of signal events on water is determined using event samples with a two photon signature from exposures with water in and out of the target region. Using the presence of a muon decay tag, two photon candidate events are divided into signal-enriched and background-enriched samples. The number of signal events, number of background events, energy scale, and shape of the back-ground are then determined for each sample using a simultaneous maximum likelihood fit to the invariant mass distribution of the signal-enriched and background-enriched samples. Finally, the number of interactions on water is determined using a weighted subtraction of the rate of signal events determined during the exposure with water in the target region and the exposure with the water removed.
The major sections of this paper are as follows. SectionII describes the T2K ND280 π0 detector, as well as the simulation of the expected neutrino interactions and detector response. Section IIIdescribes the event selection efficien-cies and reconstruction resolutions for signal-enriched and background-enriched event samples and the selected event samples are described in Sec. IV. The extraction of the number of signal events is described in Sec. V followed by a discussion of the systematic uncertainty in Sec. VI. Section VII describes the calculation of the event rate on water and compares it with the expectation.
II. T2K ND280 PØD DESCRIPTION AND SIMULATION
The T2K ND280 π0 detector (PØD) is a scintillator-based tracking calorimeter optimized to measure NC1π0
production in the momentum range that contributes back-grounds to νe appearance measurements [9]. The PØD is composed of layers of plastic scintillator alternating with water bags and brass or lead and is one of the first large scale detectors to use multipixel photon counters (MPPCs). Relative to the neutrino beam, it sits upstream of a tracking detector made up of two fine grain scintillator modules placed between three time projection chambers. Both the PØD and tracking detector are in a 0.2 T magnetic field and surrounded by electromagnetic calorimeters and muon range detectors [10–13].
The PØD comprises 40 scintillator modules, each 38 mm thick, formed from two layers of scintillating bars with the long axis oriented either horizontally or vertically and instrumented using wavelength shifting fibers with a MPPC on one end and mirrored on the other [9]. The triangular scintillating bars used to produce each of the two layers in each module have a height of 17 mm and a base of 32 mm and are interlocked to form a layer that is 17 mm thick. Two views are formed of an event, commonly labeled the X-Z and the Y-Z view, where thezaxis is horizontal and points downstream, theyaxis points in the vertical direction, and the xaxis is perpendicular to the Y-Z plane. A minimum
ionizing particle will typically generate a charge in the MPPC equivalent to approximately38photoelectrons=cm, or an average of about 30 photoelectrons in a single bar. The scintillator modules are arranged in three regions. The most upstream and downstream regions are made of seven modules interleaved with 4.5 mm thick sheets of stainless steel–clad lead that function as 4.9 radiation length electromagnetic calorimeters to improve the con-tainment of photons and electrons. The central region serves as a target containing water. It has 25 water target layers that are 28 mm thick interleaved with 26 scintil-lator modules and 1.3 mm brass sheets. When water is in the detector, the target fiducial region contains approx-imately 1900 kg of water and 3570 kg of other materials. Data collected with and without water in the PØD are analyzed separately.
This analysis utilizes data collected with a predomi-nantlyνμbeam generated between January 2010 and May
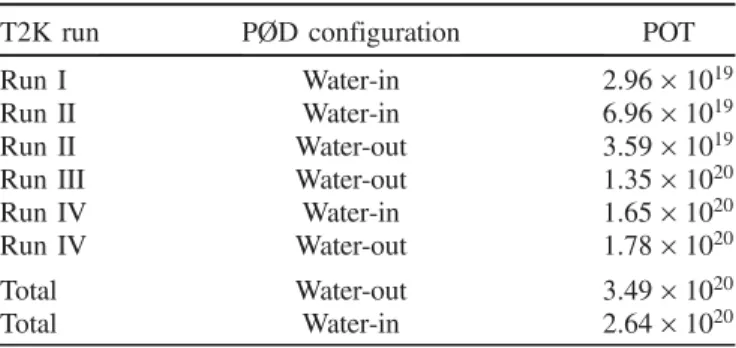
2013 (see [2] for a detailed description). The neutrinos are generated using a fast extracted 30 GeV proton beam with a spill of 6–8 bunches that are separated by 582 ns. The proton beam strikes a graphite target producing pions and kaons which, after magnetically focusing the positive mesons, decay in flight to neutrinos. The magnetic focusing can be altered to focus negative mesons. The T2K runs, the configuration of the PØD, and the corresponding protons on target (POT) are summarized in TableI.
The simulated data set used in this analysis corresponds to 4.01×10²¹ POT (water-out configuration) and 7.18×10²¹
POT (water-in configuration). Neutrino interactions are simulated using the NEUT [14] event generator, version
5.1.4.2, with the interactions distributed within the full ND280 volume, as well as the surrounding hall. Interactions on all nuclear targets present in ND280 are simulated. Details of the neutrino interaction simulation process are described in[14–16]. The T2K run periods are simulated using the nominal detector and beam configura-tions and then combined using the appropriate POT nor-malization to form the final expectation. External, nonbeam associated backgrounds are not simulated, but are limited in the data sample by the duty cycle of the neutrino beam. Particles produced in neutrino interactions are simulated
TABLE I. Summary of T2K runs, including the configuration of the PØD and the number of POT used in this analysis.
T2K run PØD configuration POT
Run I Water-in 2.96×10¹⁹
Run II Water-in 6.96×10¹⁹
Run II Water-out 3.59×10¹⁹
Run III Water-out 1.35×10²⁰
Run IV Water-in 1.65×10²⁰
Run IV Water-out 1.78×10²⁰
Total Water-out 3.49×10²⁰
usingGEANT4.9.4[17]. The standardGEANTphysics list for
electromagnetic interactions is used in the simulation. Neutral current singleπ0production in the T2K neutrino
beam is dominated by resonant Δð1232Þ production, which is simulated using the Rein-Sehgal [18] model for neutrino-induced resonant pion production. The simu-lated NC1π0 cross section on water integrated over the T2K neutrino beam flux is 7.63×10−39 cm2 or 4.24× 10−40 cm2nucleon−1 while the NC1π0 cross section for
the fiducial region in the water-out configuration is 4.20×10−40 cm2AMU−1 [2,14]. There is an additional 12% uncertainty in the neutrino flux integrated over the energy of neutrinos generating a NC1π0 interaction [2].
This uncertainty is larger than presented in other T2K analyses because of the higher average neutrino energy and, for this analysis, is unconstrained by other near detector measurements to allow direct comparison between the data and simulation.
III. EVENT RECONSTRUCTION AND SELECTION
Events are reconstructed in the PØD using scintillation light signals that occur in time windows containing the neutrino bunch arrival. A hit is constructed from the integrated charge during each time window and the time relative to the start of the window at which the integrated light signal crosses a threshold equivalent to approximately 2.5 photoelectrons. Activity in different time windows is independently reconstructed as separate events. The reconstruction proceeds by selecting groups of hits con-sistent with a tracklike signature that is classified as a light-ionizing track, such as a muon or charged pion, a heavy-ionizing track, such as a proton, or a nontrack object, such as a portion of an electromagnetic shower. Hits from nontrack objects, as well as any hits not gathered into a tracklike object, are then used to form groups that are consistent with showerlike particles such as photons or electrons coming from a single vertex. In events without a tracklike signature, the vertex is estimated by assuming that the particle signatures in the event emanate from a single point, with the particle directions going away from the vertex. While events with tracklike objects will generally be rejected in the later analysis, if a tracklike object is found, then the vertex is fixed at the upstream end of the longest track. After vertex reconstruction, all reconstructed non-tracklike objects, are classified as either EM-like or shower-like. The showerlike objects primarily comprise interacting pions, interacting protons, or misidentified light-ionizing tracks. The result of the reconstruction is a single vertex with an associated collection of objects corresponding to light-ionizing tracks, heavy-ionizing tracks, EM-like, and other showerlike objects. A muon decay tag is associated with the reconstructed vertex when energy deposition consistent with a Michel electron is found.
A signal-enriched sample of exactly two photon candi-dates with invariant mass less than500MeV=c2is selected
using eight selection criteria: event quality, vertex in the fiducial volume, energy containment in the PØD, lack of a muon decay signature, fraction of energy in the two most energetic photon candidates, particle identification, recon-structed direction and object separation. In comparison to the signal, a distinguishing characteristic of the background is that it contains either aμor a charged pion, both of which can generate a muon decay signature, so a separate back-ground-enriched sample is selected by applying all criteria with the exception of the muon decay criterion which is reversed.
To be considered in this analysis, an event must occur during a neutrino beam spill and have a single recon-structed vertex as well as good data quality. The vertex must be in the fiducial volume defined as at least 25 cm from the edge of the active volume and inside the water target region of the PØD [19]. The containment criteria requires that all reconstructed objects are contained inside the PØD by requiring that no reconstructed objects have hits in the last layer of the PØD or in the outer two bars of any layer. This limits external background and improves the photon energy reconstruction.
The signature of interest is two reconstructed photons from theπ0decay with no evidence of a muonlike object. To ensure that selected events have two reconstructed photon candidates containing most of the recorded energy deposition, a“charge-in-shower”requirement is placed on the fraction of energy in the two most energetic EM-like objects. The required fractions of 92% (water-in), and 80% (water-out) were chosen to optimize the statistical significance of the selected number of signal events using simulated samples. Due to the planar nature of the PØD and the shape of the scintillator bars, the performance degrades for particles at an angle of more than approximately 75° from thezaxis. As such, the direction of the reconstructed total event momentum must be less than 60° from thezaxis, limiting the phase space covered by this measurement.
Two well-separated decay photon candidates are required to limit the background from particles with over-lapping energy deposits. The object separation in each projection is calculated by finding the distance between the two closest hits of the reconstructed objects. Due to the planar nature of the PØD, it is possible for two objects to overlap in one projection, but not in the other, and separation is only required in one of the two projections. The object separation is required to be greater than 9 cm (14 cm) in at least one projection for the water-in (water-out) configuration.
Figure1shows the position of the reconstructed vertex relative to the true vertex position along the z axis for the water-out configuration of the PØD for simulated NC1π0 events that have passed all selection criteria. For
the water-in (water-out) configuration, the biases are
MEASUREMENT OF THE SINGLEπ0 PRODUCTION… PHYS. REV. D
97,032002 (2018)
−0.06cm (0.08cm) along thexaxis, 0.06 cm (0.20 cm) along theyaxis, and 1.67 cm (1.72 cm) along the zaxis. The expected vertex residual distribution is asymmetric due to its dependence on the reconstructed photon position and direction and is characterized by half the distance between the 16 and 84% quantiles. For the water-in (water-out) configuration, the resolutions are 5.5 cm (6.8 cm) along the x axis, 6.1 cm (8.0 cm) along the y axis, and 8.6 cm (11.2 cm) along thez axis.
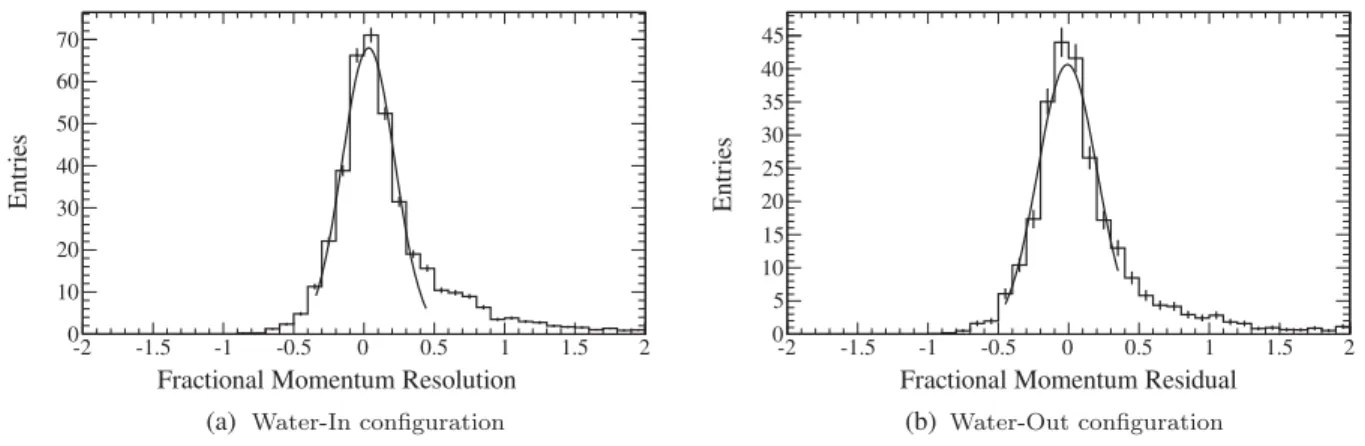
The momentum resolution of theπ0is a combination of the energy and angular resolution for two reconstructed photons. The total energy for the reconstructed photons is determined calorimetrically, and the fraction of the total energy carried by each reconstruct photons is calculated using the projections where the photon objects are geo-metrically distinct. Figure2shows the fractional momen-tum residual (the difference of the reconstructed and true momenta divided by the true momentum) for the water-out configuration of the PØD for NC1π0 events passing all selection criteria. A Gaussian is fit to the central region to determine the shift and width of the momentum distribu-tion. The fractional momentum residual distribution has a mean of−3.2%with a width of 18.7% for the PØD water-in
configuration. For the water-out configuration, the mean is −0.8%with a width of 21.1%. The reconstructed opening angle distribution for simulated NC1π0
events passing all selection criteria in both the water-in and water-out configurations has a mean of−0.01rad from the nominal value and a rms of 0.06 rad.
The reconstruction efficiency ϵfor a NC1π0 event and
signal-enriched sample purity are summarized in TableII. The efficiency is defined as the number of true NC1π0
events reconstructed in the fiducial volume divided by the Resolution (cm)
-100 -80 -60 -40 -20 0 20 40 60 80 100
Entri
es/(1 c
m
)
0 10 20 30 40 50
Residual (cm)
-100 -80 -60 -40 -20 0 20 40 60 80 100
Entri
es/(1 c
m
)
0 5 10 15 20 25
(a) (b)
FIG. 1. Residual of the reconstructed vertex position relative to the true vertex position along the beam direction for selected NC1π0
events. Vertical lines correspond to the 16 and 84% quantiles.
Fractional Momentum Resolution
-2 -1.5 -1 -0.5 0 0.5 1 1.5 2
En
tri
es
0 10 20 30 40 50 60 70
Fractional Momentum Residual
-2 -1.5 -1 -0.5 0 0.5 1 1.5 2
En
tri
es
0 5 10 15 20 25 30 35 40 45
(a) (b)
FIG. 2. Distribution of the fractional difference between the reconstructed NC1π0
momentum and the true momentum for selected NC1π0
events. A Gaussian distribution is fit to the central region.
TABLE II. Efficiencies and the purity of the selection. On-water and not-water indicate the material that the neutrino interacted with.
Efficiency,ϵ (%) Purity (%)
Water-in
Total 6.10 48.7
On-water 6.20 56.2
Not-water 6.04 45.3
Water-out
number of NC1π0 interactions occurring within the same
volume, while the purity is defined as the fraction of the selected events which result from a true NC1π0
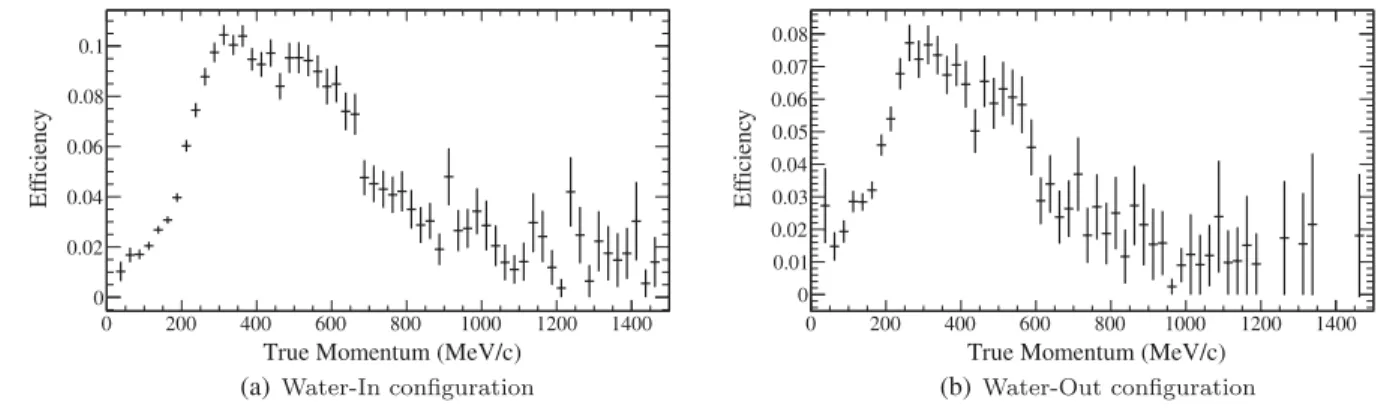
interaction. The average efficiency is 6.10% for the water-in configu-ration and 4.79% for the water-out configuconfigu-ration. There is a small location dependence in the efficiency for the water-in configuration, so the efficiency is tabulated separately for interactions which occur in the water target and for interactions which occur on another material. The average purity for the water-in (water-out) configuration is 48.7% (46.1%) for all events with a two photon invariant mass less than 500MeV=c2 corresponding to a rejection of more than 99.5% of the background events. Figure3shows the efficiency of the NC1π0selection as a function of the true π0momentum.
IV. SELECTED EVENT SAMPLES
Tables III and IV show the number of observed and expected events found in the signal-enriched and back-ground-enriched samples. The expectation for each sample is broken down into the number of expected signal and
background events, and the number of background events is further broken down by the presence of charged leptons with and without a π0
in the final state of the neutrino interaction. Categories are also included for simulated events containing multiple neutrino interactions and back-ground entering from outside the PØD. Approximately 10% of the events in the background-enriched sample are due to signal interactions. In the data, 775 events were selected as a NC1π0-enriched sample for the water-in configuration and 555 events were selected for the water-out configuration of the PØD compared to an expectation of 893 (629) for the water-in (water-out) configuration. The distribution of the true neutrino energy for the selected sample of simulated events is shown in Fig.4separated by event topology with the mean neutrino energy for the NC1π0 signal being 1.3 GeV. The
contri-butions from neutral current (NC) and charged current (CC) interactions are shown separately.
The event signature for this analysis is two recon-structed photons with an invariant mass M close to that of the π0. The reconstructed invariant mass is M¼ ffiffiffiffiffiffiffiffiffiffiffiffiffiffiffiffiffiffiffiffiffiffiffiffiffiffiffiffiffiffiffiffiffiffi
2E1E2ð1−cosθÞ
p
where E1 and E2 are the
True Momentum (MeV/c)
0 200 400 600 800 1000 1200 1400
E
ffic
ie
n
cy
0 0.02 0.04 0.06 0.08 0.1
True Momentum (MeV/c)
0 200 400 600 800 1000 1200 1400
E
ffic
ie
n
cy
0 0.01 0.02 0.03 0.04 0.05 0.06 0.07 0.08
(a) (b)
FIG. 3. Efficiency to select a NC1π0
event as a function of the true momentum of the π0
.
TABLE III. Breakdown of the sample of events that satisfy the selection criteria for the PØD water-in configuration. The sample of simulated events is broken down into signal and background and then the background sample is further subdivided by interaction type. The values have been rounded.
Signal-enriched
sample
Background-enriched sample
Data 775 227
Expectation 893 331
Signal 435 33
Background 458 297
Neutral current 109 74
Charged current withπ0
56 39
Charged current withoutπ0 239 167
External 39 9
Multiple 15 8
TABLE IV. Breakdown of the sample of events that satisfy the selection criteria for the PØD water-out configuration. The sample of simulated events is broken down into signal and background and then the background sample is further subdi-vided by interaction type. The values have been rounded.
Signal-enriched
sample
Background-enriched sample
Data 555 123
Expectation 629 210
Signal 290 24
Background 339 187
Nonsignal neutral current 68 45 Charged current withπ0
40 22
Charged current withoutπ0
150 100
External 70 13
Multiple 11 7
MEASUREMENT OF THE SINGLEπ0 PRODUCTION… PHYS. REV. D
97,032002 (2018)
reconstructed energies of each photon candidate andθis the angle between the photon candidates. Figure5shows the distribution of the selected events in the signal-enriched and background-signal-enriched samples where the expectation for each distribution has been normalized to the observed number of events. The reconstructed energy distribution of the signal-enriched samples is shown in Fig.6. The expected composition for each distribution is shown using the same breakdown as in TablesIIIandIV, however, the contributions from external and multiple interactions have been combined into a single category.
V. EXTRACTING THE SIGNAL EVENT RATE
The number of NC1π0 events is found using a six
parameter unbinned extended maximum likelihood fit to the invariant mass distribution of the signal-enriched and background-enriched samples. Four of the parameters, NSESig, NSEBkg, NBESig, andNBEBkg, are related to the number of
signal and background events in the signal-enriched (SE) and background-enriched (BE) samples. The remaining two parameters control the energy scale of electromagnetic particles relative to minimum ionizing tracks and the shape of the expected background.
Energy (MeV)
0 200 400 600 800 1000 1200 1400 1600 1800 2000
Ev en ts/20 MeV 0 10 20 30 40 50 60 70 0 π NC with 0 π NC without 0 π CC with 0 π CC without Other (a) Energy (MeV)
0 200 400 600 800 1000 1200 1400 1600 1800 2000
Ev en ts/20 MeV 0 5 10 15 20 25 30 35 40 45 0 π NC with 0 π NC without 0 π CC with 0 π CC without Other (b)
FIG. 4. Distribution of the true neutrino energy for the simulated events in the signal-enriched sample.
)
2
Invariant Mass (MeV/c
0 50 100 150 200 250 300 350 400 450 500
) 2 Ev en ts/(20 MeV/c 0 10 20 30 40 50 60 70 80
90 NC with π0
0 π NC without 0 π CC with 0 π CC without Other Data ) 2
Invariant Mass (MeV/c
0 50 100 150 200 250 300 350 400 450 500
)
2
Ev
en
ts / (20 MeV/c
0 10 20 30 40
50 NC with π0
0 π NC without 0 π CC with 0 π CC without Other Data (a) ) 2
Invariant Mass (MeV/c
0 50 100 150 200 250 300 350 400 450 500
)
2
Ev
en
ts / (20 MeV/c
0 10 20 30 40 50 60
70 NC with π0
0 π NC without 0 π CC with 0 π CC without Other Data ) 2
Invariant Mass (MeV/c
0 50 100 150 200 250 300 350 400 450 500
)
2
Ev
en
ts / (20 MeV/c
0 5 10 15 20 25
30 NC withπ0
0 π NC without 0 π CC with 0 π CC without Other Data (b)
The likelihood is extended by assuming that the probability of the observed numbers of signal-enriched (NSE
γγ) and background-enriched (NBEγγ ) events is given by
the product of Poisson distributions and, in each case, the expected number of two photon events is a sum of the signal events (NSig) and the background events (NBkg).
The expected invariant mass distribution for the signal (background) events in the signal-enriched (background-enriched) sample is generated using the simulation after event reconstruction. The distributions are normalized such that the sum over the signal-enriched bins is equal to the total number of events NSEγγ and, likewise, for the
background-enriched sample NBE
γγ .
The ratio of the number of signal and background events in the signal-enriched sample to the numbers in the back-ground-enriched sample (NSE
Sig=NBESig and NSEBkg=NBEBkg) are
determined by the efficiency of the muon decay tag and the probability of a muon decay tag false positive. Both relations are estimated using a sample of stopping muons from neutrino interactions occurring upstream of the PØD. This sample is selected by requiring a single tracklike object entering the upstream face of the detector and stopping in the water target region.
The number of background events in the signal-enriched sample is related to the background events in the back-ground-enriched sample by the muon decay reconstruction efficiency and is allowed to vary within the uncertainty on the muon decay tag efficiency. For the water-in (water-out) configuration, the expected efficiency is 45.6% (43.9%) and the observed efficiency is44.10.5%(46.20.6%). The fractional difference between data and expectation is combined with its statistical error and used as a Gaussian constraint in the likelihood on the ratio between the number of background events in the signal-enriched and background-enriched samples. The constraint is 3.4% for the water-in configuration and 5.2% for the water-out configuration.
The fitted number of signal events in the background-enriched sample relative to the number in the
signal-enriched sample is allowed to vary within the uncer-tainty on the probability of a false positive muon decay tag. The uncertainty in modeling the false muon decay tag rate has been estimated by fitting the time distribution of muon decay tags occurring after a stopping muon, but within the same trigger window, to an exponential plus a constant. The fitted exponential lifetimes are consistent with the expect-ation for muon decay, and the constant term estimates the probability of incorrectly finding a muon decay tag. For the water-in (water-out) configuration there is a 1.10.5% (1.30.7%) difference in the constant term between the data and expectation which provides a 1.6% (2.0%) constraint on the false tag probability.
Since there is an uncertainty in the shape of the back-ground underneath the π0 invariant mass peak, an extra shape parameter has been added to the fit. The deviation from the expected background shape is assumed to have the same shape as the signal probability distribution, while the normalization is constrained by the background-enriched sample. The shape factor is allowed to be positive or negative meaning that the amount of background in the region of theπ0
invariant mass can be either increased or decreased. Two cases are considered in the fit. In the first instance, the number of signal and background events are determined by using the nominal shape for the background which is equivalent to fixing the shape parameter to a value of zero. In the second case, no prior constraint is placed on the shape parameter, and the uncertainty in the rate is estimated by constraining it with both the signal-enhanced and background-enhanced samples. See Sec.VIwhere this case is used to estimate the systematic uncertainty due to the unknown background shape.
The overall energy scale in the PØD is set using penetrating muon tracks and must be translated to an energy scale for electromagnetic particles with uncertainty introduced due to the relative response of the detector to different particle types. The final electromagnetic energy scale is determined using the position ofπ0invariant mass peak. The mean difference between the reconstructed and
Energy (MeV)
0 200 400 600 800 1000 1200 1400
Ev en ts/20 MeV 0 10 20 30 40 50 60 70 80
90 NC withπ0
0 π NC without 0 π CC with 0 π CC without Other Data (a) Energy (MeV)
0 200 400 600 800 1000 1200 1400
Ev en ts/20 MeV 0 10 20 30 40 50 60 70 80 0 π NC with 0 π NC without 0 π CC with 0 π CC without Other Data (b)
FIG. 6. Expected and observed reconstructedπ0
energy for the signal-enriched sample. The expectation for each sample is normalized to the observed number of events.
MEASUREMENT OF THE SINGLEπ0 PRODUCTION… PHYS. REV. D
97,032002 (2018)
true photon opening angle in the simulation is small (0.01 rad) and has negligible effect on the invariant mass distribution so the difference between the measured and simulated invariant mass scales is assigned to the energy scale uncertainty. No prior constraint is placed on the energy scale parameter, however, based on a survey of the detector material distribution and the uncertainties in the particle propagation model, the prior uncertainty is approx-imately 10% relative to the energy scale determined using penetrating muons. In the water-in (water-out) configura-tion, the fitted value for the electromagnetic energy scale parameter is89.53.4%(96.70.6%).
The best fit values for the number of signal and back-ground events with the energy scale parameter uncon-strained, while using the nominal shape for the background, are shown in TableV. Figure7compares the invariant mass
expectation to the data, where the energy scale correction determined during the fit has been applied to the data. The mass bins above440MeV=c2are not fully populated with data because the criteria requiring events have a recon-structed invariant mass less than 500MeV=c2
is applied prior to determining the best fit energy scale. The goodness of fit is calculated as a binned χ2 of the invariant mass
distributions between 0 and440MeV=c2
where the range has been limited to the region that the data populates. Considering only statistical uncertainty, theχ2value for the
PØD water-in configuration is 40.4 for 39 degrees of freedom, leading to a p-value of 0.41. The χ2 value for
the PØD water-out configuration is 53.5 for 39 degrees of freedom, leading to a p-value of 0.06.
)
2
Invariant Mass (MeV/c
0 50 100 150 200 250 300 350 400 450 500
)
2
Ev
en
ts / (20 MeV/c
0 10 20 30 40 50 60 70 80 90
Total Fit
Fit Background
Data
)
2
Invariant Mass (MeV/c
0 50 100 150 200 250 300 350 400 450 500
)
2
Ev
en
ts / (20 MeV/c
0 5 10 15 20 25 30 35 40
Total Fit
Fit Background
Data
)
2
Invariant Mass (MeV/c
0 50 100 150 200 250 300 350 400 450 500
)
2
Ev
en
ts / (20 MeV/c
0 10 20 30 40 50 60 70
Total Fit
Fit Background
Data
)
2
Invariant Mass (MeV/c
0 50 100 150 200 250 300 350 400 450 500
)
2
Ev
en
ts / (20 MeV/c
0 5 10 15 20 25 30
Total Fit
Fit Background
Data
(a)
(b)
FIG. 7. Comparison of the data to the best fit invariant mass distributions for the water-in and water-out configurations, with the best fit energy scale applied to the data. The left (right) plots show the distributions for the signal-enriched (background-enriched) samples. The effect of the measured energy scale on the 500MeV=c2
selection criterion has not been applied to the expectation. TABLE V. Best fit values for the number of events in the PØD water-in and PØD water-out configurations. Only statistical uncertainties are included.
NSE
Sig (expected) NSEBkg (expected) NBESig (expected) NBEBkg(expected)
VI. SYSTEMATICS
The systematic uncertainties are summarized in TableVI and are described below. The detector systematics are separately estimated for the water-in and water-out con-figurations. Since the detector performance is different and run periods do not overlap in time, the systematic uncertainty related to detector performance is assumed to be uncorrelated between the water-in and water-out configurations.
Because the event reconstruction proceeds in two stages, first reconstructing tracklike signatures in each event, and then reconstructing the remaining activity assuming show-ering signatures, reconstruction efficiencies primarily affect the result in two ways. First, an inefficiency is introduced when an electromagnetic object is reconstructed as track-like, because the object will then not be considered by the shower reconstruction. Other efficiencies are more closely related to the shower reconstruction, including efficiencies related to the particle identification of showering signa-tures, the reconstructed distance between showering objects, and the fraction of the visible energy assigned to each showering object.
The track particle identification efficiency uncertainty is estimated using the sample of stopping muons described in Sec. V. The uncertainty for each input parameter to the particle identification procedure is estimated and propa-gated through the particle identification likelihood to
determine the effect on the identification efficiency. For simulated muons, there is a5.400.05%(5.060.03%) uncertainty in the misidentification rates for the water-in (water-out) configuration. Combining the difference in quadrature with the statistical uncertainty leads to a total track object particle identification systematic of 5.4% (5.1%) for the water-in (water-out) configuration.
The efficiencies of the charge-in-shower, object separation and shower particle identification criteria are related to the properties of a showering particle and are studied using control samples selected by reversing these cuts to create double “sideband” distributions. For example, to estimate the uncertainty in the efficiency of the charge-in-shower criterion, events that fail the object separation and shower particle identification criteria, but which pass all other criteria, are selected to create a control sample with low signal purity. The estimated uncertainty for the efficiency of the charge-in-shower criterion is then the relative difference between the percentage of control sample events passing the criterion relative to the expectation. For the water-in con-figuration, 54.0% of the simulated and51.32.2%of the data control sample events are selected. Combining the difference between the simulation and data in quadrature with the statistical error leads to a systematic uncertainty of 6.6% in the efficiency due to the charge-in-shower criterion. A similar calculation is done for the water-out configuration. The procedure is then repeated for the object separation and shower particle identification criteria. Because these three uncertainties are estimated using statistically limited data sets collected during independent water-in and water-out run periods they are assumed to be uncorrelated between the configurations, and the uncertainty will likely be reduced by the collection of additional data. The on-water uncertainty for these uncertainties is estimated by combining the water-in and water-out uncertawater-inties water-in quadrature (summarized water-in TableVI).
After the best fit values were found in Sec.V, the fitted value and uncertainty on the energy scale were used to estimate the effect of the energy scale on the estimated efficiency. This effect was modeled by scaling the NC1π0
reconstruction efficiency shown in Fig.3using many trials of the energy scale parameter distributed according to the best fit parameter and statistical uncertainty. The shifted efficiency curve represents a new expectation for the trial energy scale parameter and is used to estimate the expected number of saved signal events in the simulation. The fractional shift and rms of the distribution of the expected number of signal events are then added in quadrature to estimate the uncertainty due to the energy scale for the estimated efficiency. The time variation of the energy scale was tracked using through-going minimum ionizing par-ticles, and it introduces an efficiency uncertainty of 1.8% for both the water-in and water-out configurations.
Several systematic uncertainties were associated with the fiducial volume. Uncertainties on measurements of the
TABLE VI. Summary of event rate systematic errors. The uncorrelated systematic errors are tabulated and summed, fol-lowed by the systematic error that is correlated between the water-in and water-out configurations.
Uncertainty (%)
Parameter Water-in
(%)
Water-out (%)
Geometry differences 2.8% 2.8% Photoelectron peak discrepancy 0.6% 0.4%
Energy scale 5.8% 0.9%
Channel to channel variations <0.1% <0.1% Time variation of energy scale 1.8% 1.8%
Mass uncertainty 0.4% 0.6%
Alignment <0.1% <0.1% Fiducial volume scaling 1.5% 2.0% Fiducial volume shift 1.1% 1.7% Flux shape and event generator 2.5% 3.3% Track particle identification efficiency 5.4% 5.1% Shower particle identification
efficiency
6.6% 2.6%
Object separation 9.1% 11.6%
Charge-in-shower 6.6% 3.0%
Background shape (statistical) 3.8% 4.2% Total uncorrelated systematic 16.4% 15.0% Total correlated systematic 19.8%
Total systematic 25.7% 24.8%
MEASUREMENT OF THE SINGLEπ0 PRODUCTION… PHYS. REV. D
97,032002 (2018)
detector mass were used to reweight the selected events to extract the uncertainty due to fiducial mass. The effect of alignment between detector elements on the efficiency was studied and found to be negligible (<0.1%). Additionally, there are two fiducial volume uncertainties. One reflects how the result is affected by changing the fiducial volume definition, while the other quantifies the uncertainty due to a systematic shift between the simulated and true detector volumes. When combined, the fiducial volume uncertainty is 1.9% for water-in and 2.6% for water-out.
The systematic uncertainty due to the background shape is estimated by comparing the effect on the fitted signal rate with the shape parameter fixed to when it is unconstrained. Following the procedure outlined in Sec.V, the best values for the shape parameter with the water-in and water-out configurations are found to be statistically consistent with theχ2value for the invariant mass distribution being 47.5
for 38 degrees of freedom for the water-in configuration and 38.7 for 38 degrees of freedom for the water-out configuration. Because the backgrounds in both the water-in and water-out configuration arise from the same physical processes, it is assumed that this uncertainty is fully correlated between the water-in and water-out configura-tions and the uncertainty is directly applied to the on-water signal event rate. The change in the in and water-out event rates between the case where the shape parameter is fixed to zero and where the shape parameter is free leads to a 19.8% uncertainty in the on-water rate due to the background shape parameter.
While this analysis uses background-enriched control samples to minimize the uncertainty due to the model of the cross sections, changes in the generated event kinematics have an effect. This was studied using the neutrino flux shape and cross section uncertainties detailed in [2,16]. For the water-in configuration, the flux shape and cross section introduce a 2.5% uncertainty, and for the water-out configuration, a 3.3% uncertainty. Because rate of observed events is consistent with the expectation, the full 12% flux uncertainty is included and given as a separate uncertainty.
VII. NUMBER OF EVENTS ON WATER
The number of NC1π0 events in the PØD measured
using both the water-in and water-out configuration (Table V) can be used to determine the number of events occurring directly on water. Accounting for the statistical (stat) and systematic (sys) uncertainties, the measured number of NC1π0 events with water in the PØD is found
to be 34233ðstatÞ 88ðsysÞ during an exposure of 3.49×10²⁰ POT, where the systematic uncertainty
includes effects that are correlated between the water-in and water-out configurations. The ratio between the observed and expected rate is 0.790.08ðstatÞ
0.20ðsysÞ. Similarly, with water out of the PØD, the
mea-sured number is24626ðstatÞ 61ðsysÞfor an exposure of
2.64×10²⁰ POT, and the ratio between the observed and
expected rate is 0.850.09ðstatÞ 0.21ðsysÞ. To allow direct comparison to the expected NC1π0 event rate, the
quoted ratios include neither the 12% flux normalization uncertainty nor the NC1π0 cross section uncertainty.
The total number of events on water is found using a statistical subtraction by relating the event rate during the in exposure to the event rate during the water-out exposure. The total number of signal events in the water-in (WI) configuration can be divided into two parts, NWI ¼NOn-WaterþNNW, where NNW is the number of
signal events that occur on targets other than water (referred to as“not-water”events) in the water-in configuration. The number of not-water (NW) events, which is proportional to the number of water-out (WO) events, can be subtracted from the total number of on-water events by
NOn-Water ¼NWI−
ϵNWPOTWI
ϵWOPOTWO
NWO; ð1Þ
where the efficienciesϵNW andϵWO are given in TableII,
and the POT is given in Table I. After the subtraction in Eq. (1), 10641ðstatÞ 69ðsysÞ events were found, where the uncertainties that are correlated between the water-in and water-out configurations have been taken into account. The simulation predicts 157 true NC1π0 events
on water.
The ratio of the number of measured to number of predicted on-water events, including the correlated and uncorrelated uncertainties described in Sec.VI, is0.68
0.26ðstatÞ 0.44ðsysÞ 0.12ðfluxÞ, where the NC1π0
cross section uncertainties are excluded.
VIII. CONCLUSION
An on-water NC1π0 rate measurement has been
per-formed by combining data from a 2.64×10²⁰
POT neutrino beam exposure of the T2K ND280 PØD using a water-in configuration with a3.49×1020
POT exposure using a water-out configuration. This is the first use of the subtraction method to measure neutral current event rates with the T2K near detector.
The signal event rates are found using an extended maximum likelihood fit to the reconstructed invariant mass for each sample in a range of0–500MeV=c2. As described in Sec.III, the phase space of the analysis has been limited to the region where the PØD has acceptance. The analysis finds34233ðstatÞ 88ðsysÞ[24626ðstatÞ 61ðsysÞ] signal events in the PØD water-in (water-out) data com-pared to an expectation of 433 (290) events. Excluding the 12% normalization and NC1π0 cross section
uncer-tainties, the resulting observed to expected ratios are
0.790.08ðstatÞ 0.20ðsysÞ for water-in and 0.85
0.09ðstatÞ 0.21ðsysÞ for water-out configurations.
efficiencies yields 10641ðstatÞ 69ðsysÞ signal events on water compared to an expectation of 157 events and an on-water NC1π0 production rate of 0.680.26ðstatÞ
0.44ðsysÞ 0.12ðfluxÞrelative to theNEUTexpectation. As
noted in Sec.VI, the largest systematic errors, for example, the uncertainty in the background shape, are determined using statistically limited data sets and additional exposure is expected to reduce these uncertainties. The observed event rates are consistent with the expectation and indicate that the event rate from neutral currentπ0production is not
underestimated. This provides confidence that the neutral currentπ0 background to electron neutrino appearance in
T2K is not underestimated.
ACKNOWLEDGMENTS
We thank the J-PARC staff for superb accelerator
performance. We thank the CERN NA61/SHINE
Collaboration for providing valuable particle production data. We acknowledge the support of MEXT, Japan; NSERC (Grant No. SAPPJ-2014-00031), NRC and CFI, Canada; CEA and CNRS/IN2P3, France; DFG, Germany; INFN, Italy; National Science Centre (NCN) and Ministry of Science and Higher Education, Poland; RSF, RFBR, and MES, Russia; MINECO and ERDF funds, Spain; SNSF and SERI, Switzerland; STFC, UK; and DOE, U.S. We also thank CERN for the UA1/NOMAD magnet, DESY for the HERA-B magnet mover system, NII for SINET4, the WestGrid and SciNet consortia in Compute Canada, and GridPP in the United Kingdom. In addition, participation of individual researchers and institutions has been further supported by funds from ERC (FP7), H2020 Grant No. RISE-GA644294-JENNIFER, EU; JSPS, Japan; Royal Society, UK; the Alfred P. Sloan Foundation and the DOE Early Career Program, USA.
[1] K. Abeet al.(T2K Collaboration),Nucl. Instrum. Meth. A
659, 106 (2011).
[2] K. Abeet al.(T2K Collaboration),Phys. Rev. D87, 012001 (2013);87, 019902(E) (2013).
[3] K. A. Oliveet al.(Particle Data Group),Chin. Phys. C38, 090001 (2014).
[4] M. Pohlet al.(Gargamelle Antineutrino Propane Collabo-ration), Phys. Lett.82B, 461 (1979).
[5] S. Nakayamaet al.(K2K Collaboration),Phys. Lett. B619, 255 (2005).
[6] A. A. Aguilar-Arevalo et al. (MiniBooNE Collaboration),
Phys. Rev. D81, 013005 (2010).
[7] Y. Kurimotoet al.(SciBooNE Collaboration),Phys. Rev. D
81, 033004 (2010).
[8] Y. Kurimotoet al.(SciBooNE Collaboration),Phys. Rev. D
81, 111102 (2010).
[9] S. Assylbekov et al.,Nucl. Instrum. Methods Phys. Res., Sect. A686, 48 (2012).
[10] N. Abgrallet al.(T2K ND280 TPC Collaboration),Nucl. Instrum. Methods Phys. Res., Sect. A637, 25 (2011). [11] D. Allan et al. (T2K UK Collaboration), J. Instrum. 8,
P10019 (2013).
[12] S. Aokiet al.,Nucl. Instrum. Methods Phys. Res., Sect. A
698, 135 (2013).
[13] P. A. Amaudruz et al. (T2K ND280 FGD Collaboration),
Nucl. Instrum. Methods Phys. Res., Sect. A696, 1 (2012). [14] Y. Hayato,Acta Phys. Pol. B40, 2477 (2009).
[15] K. Abeet al.(T2K Collaboration),Phys. Rev. D87, 092003 (2013).
[16] K. Abeet al.(T2K Collaboration),Phys. Rev. D89, 092003 (2014);89, 099902(E) (2014).
[17] S. Agostinelli et al. (GEANT4), Nucl. Instrum. Methods Phys. Res., Sect. A506, 250 (2003).
[18] D. Rein and L. M. Sehgal, Ann. Phys. (N.Y.) 133, 79 (1981).
[19] K. Gilje, Ph.D. thesis, Stony Brook University, 2014.
MEASUREMENT OF THE SINGLEπ0 PRODUCTION… PHYS. REV. D
97,032002 (2018)