The opinions expressed in the papers are solely those of the author(s), and do not represent those of the organization to which the author(s) belong(s) or the Research Institute for Economics, Trade and Industry. In the present study, we use an age-specific Markov chain of order two as the main analytical framework. As explained in the previous section, the existing studies mainly used an age-dependent Markov chain of order one, where health status is defined by age-dependent percentiles of health expenditures.
First, the use of a second-order Markov chain allows us to identify states with different levels of health shocks by examining states with a zero level of spending in the previous year and a certain level of spending in the current year. Second, defining states using absolute health expenditures allows us to easily compare changes in the health transition matrix between ages. It is a longitudinal database that follows individuals for how long they participate in the same health insurance.
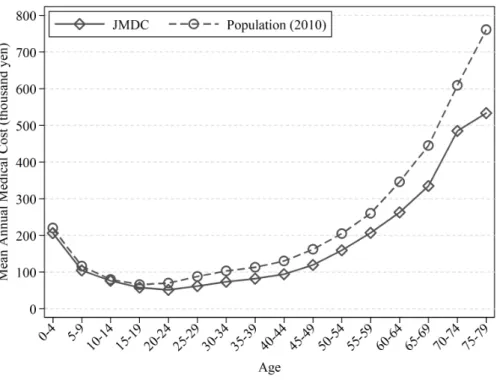
This approach is taken because some individuals are only in the database for part of the year. Before discussing the descriptive characteristics of medical costs found in the JMDC Claims Database, it is important to look at how the subjects appearing in that database differ from the overall population. However, in the case of middle-aged persons, age profiles of medical costs are steeper for women.
Now that we have defined health transition statuses based on the distribution of medical costs for those who did not pay medical costs in the past year, we turn our attention to the persistence of medical shocks – its magnitude and age-specific differences.
6 Results
- Markov Chain of Order Two Rather than Order One
- Initial Health Shock Occurrence Probabilities and their Distribution
- Persistency After Health Shocks
- Implications of the Results
These values, with the exception of 267,000 yen, come from the rounded number of medical cost distribution for those who are between 30 and 40 years old and have not paid any medical costs in the past year: below the median for stateQ1, from the 50th to the 75th percentile for stateQ2, from the 75th percentile to the 90th percentile for Q3 and from the 90th percentile to 266,999 for stateQ4. With the exception of the state's fifth quarter, which is based on the threshold amount found in the high medical cost scheme, our state fractions do not show an extreme distribution, indicating that our definition of health status works well. When Markov order one is used, different types of individuals, those who are experiencing a certain level of expenditure for the first time and those who have been experiencing that level of expenditure for some time, are mixed together in the same state.
As can be seen from the figure, the decrease in the percentage of subjects with the worst health status (state Q5) is very slow - even five years later, 59.0% of subjects remain. For example, among people in the age group 55-59 years, the percentage of them that we could not observe one year later is 8.60%, and two years later is 44.49%. However, we have checked and confirmed that the difference in medical costs between the subjects from each age group who remained in the database and those who dropped out is not that large.
The graphs in Figure 4 clearly indicate that persons in the same condition Q5 have dramatically different probabilities of remaining in it in the following years, depending on their condition two years earlier. To make visible the differences in medical costs between patients who are in the same condition but switched from other states in the previous year, we present Table 7, which shows the summary statistics of medical costs of patients in the worst health ( stateV5 ) divided by the age group and the state in the previous year (Here we only show the transition paths from the states Q1 and Q5). On the other hand, average values show a more obvious difference, especially for those in their teens and twenties, but this is mainly due to the very large difference in the maximum values.
Therefore, we can say that for most people in the same current condition, the medical costs are not that different compared to their condition in the previous year. This number can be interpreted as the change in the frequency of health shocks for healthy people in relation to their age. Again, considering the existence of the mixture of types of people in the worst health state (state Q5), we perform the same analysis, this time conditional on two states.
Finally, when people experience a health shock at a certain age, that effect can persist in the following years. These results imply that consumers' dynamic behavior, such as saving or participating in health insurance, should differ across ages, not only because of their remaining lifespan or family structure, but also because of the differences in the probability of a health shock and in health shock persistence. We first examine the case in which individuals in the worst state of health (Q5) incur medical costs of ¥267,000 each year—the amount that comes from the threshold value of medical costs for those in the worst state of health (Q5) ( Figure 19 ) .
In addition, the differences in predicted 10-year medical costs exhibit a U-shaped age profile, reflecting the fact that cost persistence differs by age, as we have seen in Section 6.3. While the difference in the case of the lower threshold was about 0.9 million yen for men aged 55, the difference grew to about 2.8 million yen in the case where the annual medical cost was one million yen.
7 Conclusion
Chen, Yui Ohtsu, and Nobuyuki Izumida, "Medical Expenditure in Japan: An Analysis Using Administrative Data from a Citizen's Health Insurance Plan." Jeske, Karsten, and Sagiri Kitao, "US Tax Policy and the Demand for Health Insurance: Can a Regressive Policy Improve Welfare?", Journal of Monetary Economics. Kan, Mari, and Wataru Suzuki, "Concentration and Persistence of Health Care Expenditures Among the Non-Elderly Population," Journal of Health and Society.
Monheit, Alan C., "Persistence in Short-Term Health Expenditures: Incidence and Consequences," Medical Care III53-III64. Palumbo, Michael G., "Uncertain Medical Expenditures and Precautionary Savings Near the End of the Life Cycle," The Review of Economic Studies. Pashchenko, Svetlana, and Ponpoje Porapakkarm, "Quantitative Analysis of Health Insurance Reform: Separating Regulation from Redistribution," Review of Economic Dynamics.
Suzuki, Wataru, Yasushi Iwamoto, Michio Yuda, and Ryoko Morozumi, "Patterns of Medical Care Distribution and Long-Term Care Expenditures - Estimates Based on Administrative Data in Fukui Prefecture," Japanese Journal of Health Economics and Policy. Yogo, Motohiro, "Portfolio Choice in Retirement: Health Risk and the Demand for Annuities, Housing, and Risky Assets," Journal of Monetary Economics.
Appendix
Source: Japan Medical Data Center (JMDC) claims database and the 2012 annual report “Basic data on medical insurance” by the Japanese Ministry of Health, Labor and Welfare (http://www.mhlw .go.jp/ .file/06 -Seisakujouhou-12400000-Hokenkyoku/kiso22.pdf). Data sources: Japan Medical Data Center (JMDC) claims database and the 2012 annual report "Basic data on medical insurance" from the Japanese Ministry of Health, Labor and Welfare (http:// www.mhlw.go.jp/file/ 06-Seisakujouhou-12400000-Hokenkyoku/kiso22.pdf). Note: In this paper we consider individuals in state Q1 to be in the best state of health, those in Q2 are in good health, while Q3 represents relatively good health, Q4 stands for poor health, and Q5 stands for the poorest health. .
Furthermore, it is important to note that we do not observe the actual expenditure when it comes to individuals who have the worst health status (state Q5) because some of them use the high-cost medical expenditure benefit system and some do not. We defined the health transition states according to individual's overall medical costs for that year: 0–7,800 yen for Q1, 7,801–.