First, we use matched employer-employee data for Japan to disaggregate output in each industry in Japan's manufacturing sector in the Organization for Economic Co-operation and Development (OECD) Intercountry Input-Output (ICIO) table in manufacturing for export or local sales. Specifically, using matched data from the Economic Census of Business Activity (ECBA) and the Basic Wage Structure Survey (BSWS), we break down output in each industry of Japan's manufacturing sector in the OECD Input table -Inter-country output (ICIO) in production for export and domestic sales, and examine the GVC participation of Japanese manufacturing plants, which can be calculated from our ICIO split table. Using information on exports and domestic sales from our data, we have broken down output in each manufacturing industry in Japan in the ICIO table into output for export and domestic sales.
They extend the input-output table of Japan's system of national accounts (SNA) to reflect the difference in the ratio of imported intermediate goods to total goods between exporting and non-exporting firms. Overall, these studies suggest various alternative ways to account for firm heterogeneity within industries in SU/IO tables. Against this background, our study introduces heterogeneity within industries in the ICIO table by distinguishing production for foreign markets (exports) and production for the domestic market (domestic sales).
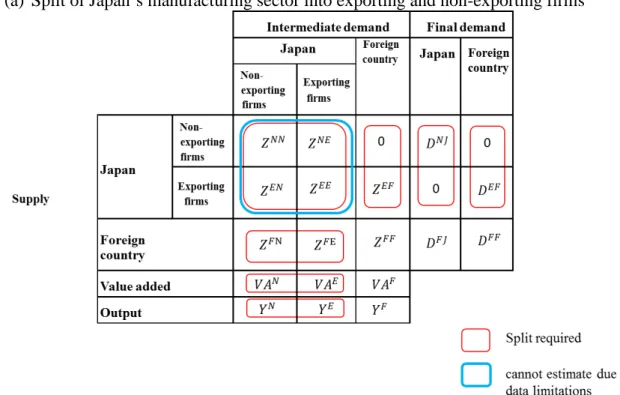
To account for such heterogeneity, we split the output of each industry in the IO table into exports and domestic sales following the methodology introduced by Koopman et al. 2012) to calculate input-output connections in a partitioned IO table. Next, we explain the process for dividing the output of each industry in Japan's manufacturing sector into output for export and domestic sales in the ICIO table.

Sequence of estimation
In each industry, the sales of exporting plants are divided into exports and domestic sales. Aggregate domestic sales of exporting plants are added to aggregate sales of non-exporting plants and the sum represents the total domestic sales of the industry. ii) Added value. The added value of exporting plants is divided into the added value derived from exports and the added value derived from domestic sales based on the share of exports and domestic sales in total production.10 The added value at the industry level derived from exports is aggregate value added derived from the export of all exporting plants.
The added value at the industry level obtained from domestic sales is the sum of the added value of non-exporting plants and the added value obtained from domestic sales of exporting plants. iii). The methodology for calculating intermediate goods input for production for export and for domestic sale is similar to the calculation of added value. We divide intermediate goods inputs from export plants into intermediate goods used for exports and for domestic sales based on the share of exports and domestic sales in total output.
Share of exporting plants
The first is to ensure that the equilibrium conditions in the combined ICIO table are always satisfied and that the estimated ICIO table is consistent with the original ICIO table. The second is to ensure that the estimated ICIO split table is consistent with the structure of production for export and domestic sales. Before we begin the analysis of the ICIO split table, let us examine the differences between production for export and domestic sales in the Japanese manufacturing sector.
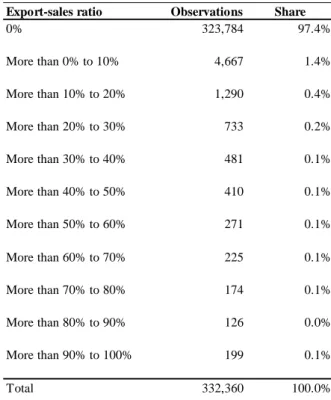
In addition, we present some basic data on plant performance and factor content in production using our micro data. As you can see, this share varies by industry, but is generally less than 10% for most industries (with the exception of the chemical products industry).11.
Share of exports and domestic sales
Heterogeneity in value added/sales ratio and labor productivity
Heterogeneity of factor content in production for export and domestic sale
We then discuss the differences in labor inputs for production for export and production for domestic sales. The highest regular labor intensity is observed in production for domestic sale of textile products. The only exception where production for export is more labor intensive is the wood products industry.
The combined ECBA and BSWS employer-employee matching data include the numbers of university graduates and non-regular workers in each plant. We use the same approach to aggregate the number of workers involved in production for export and domestic sales for each industry as described for value added in Section 3.2. 12 Capital (physical fixed assets other than land) used for production for export and domestic sale is calculated in the same way as added value obtained from production for export and domestic sale.
Further, as shown in Figure 9, in most industries production for export requires fewer non-regular workers than production for domestic sale. Overall, the figures presented here show that there is considerable heterogeneity in production for export and domestic sales from a number of perspectives.

Extended Input–Output Table 1 Main indicators
Results and discussion .1 Results
- Discussion of factor input differences between production for export and production for domestic sale
We now examine our input-output tables, taking into account the heterogeneity in production for exports and domestic sales. Note that in the machinery and equipment industry the share of non-regular workers is similar in terms of production for export and production for domestic sales, while in the computer, electronic and optical products industry it is higher for production for domestic sales. These observations imply a heterogeneity of factor inputs in production for exports and domestic sales, which can vary considerably across and within industries.
Thus, our findings suggest that accounting for heterogeneity in export production in a split input-output table can provide a better picture of factor inputs and the distribution of value added within industries. Next, we discuss the differences between the main indicators presented in Section 3.3 that emerge when we divide the production of Japanese industry in the ICIO table into production for export and production for domestic sale. We conclude that this result is the result of a low ratio between domestic value and added sales of production for export, which means greater dependence on foreign inputs in production.
The production of intermediate inputs abroad reduces the value added/domestic sales ratio, meaning that the Japanese manufacturing sector relies on backward linkages. To strengthen our argument, we calculate the simple correlation between domestic value added in exports and foreign value added in exports for the machinery and equipment, computer, electronic and optical equipment, and electrical machinery and appliance industries (Table 6 ). In sum, these findings imply that cross-border fragmentation is greater than suggested based on measures that do not take into account the strong heterogeneity in production for export and domestic sales.
We then compare in Table 7 our estimates of value added in foreign final demand with those reported in the TiVA database.17 To highlight the results even more clearly, Figure 11 shows the difference visually for textiles, machinery and equipment, computers , electronic and optical equipment, electrical machinery, other transportation equipment and total production. Thus, if we look at the heterogeneity of factories in production for export and production for domestic sales, we see that the DVA embodied in foreign final demand is lower than the results based on the ICIO table which does not take such heterogeneity into account taken. We also found lower DVA and factor inputs, which were reflected in exports and foreign final demand in these sectors.
First, we find that production for domestic sale contributes relatively high factor content to production for export. This means that a significant part of production for domestic sale is used as inputs for production for export. Second, the input of capital and highly skilled labor (university graduates) into production for domestic sale benefits more from final foreign demand than from production for export in the manufacturing sector as a whole and in most industries.

Conclusion
Thus, we can conclude that analyzes using a non-split IO table overestimate the level of factor inputs driven by final foreign demand. Most of Japan's manufacturing output for export is carried out by a relatively small number of large factories, which employ approximately only 8% of workers in the manufacturing sector. Production for export is larger and more capital intensive (both in terms of physical and human capital) than production for domestic sale.
Labor productivity in production for export is much higher than in production for domestic sale. Domestic value added in exports, domestic value added embodied in foreign final demand, and factor inputs embodied in foreign final demand calculated from the shared IO table are lower than the results calculated from the unshared IO table. This means that Japanese firms benefit less from foreign final demand than is often claimed.
Production for domestic sale benefits relatively more from exports and foreign final demand than production for export. Capital and highly skilled labor benefit to a greater extent from exports and foreign final demand than less skilled labor (regular and non-regular status employees). There are large differences between industries in the factor inputs involved in foreign final demand.
Our findings suggest that considering production for export and production for domestic sales within industries can provide a more complete and better picture of firm heterogeneity in the ICIO table. Maggioni (2013) “Using trade microdata to improve trade in value added measures: Proof of concept using Turkish data,” in A. Ribarsky (2014) “Trade in value added, employment and investment,” paper prepared for the IARIW 33rd General Conference Rotterdam, The Netherlands, August.
Noguera (2012) “Accounting for intermediate goods: Production sharing and value-added trade,” Journal of International Economics.
Framework of Estimation of Split IO Table Using Quadratic Programming The following is the framework for the quadratic programming we implement
Set initial elements of the split IO table
Implement quadratic programming
We also performed quadratic programming to estimate variables without fixed 𝛼𝛼𝑖𝑖, but the solutions have improbable elements (e.g., in some industries, the output of the export sectors is greater than the output for domestic sales). 21 It is also possible to use the share of added value from microdata. So let's use the share of total inputs and as a result the added value 𝑣𝑣𝐹𝐹𝑖𝑖𝑖𝑖𝐸𝐸 and 𝑣𝑣𝐹𝐹𝑖𝑖𝑖𝑖𝑁𝑁 is calculated indirectly from the estimated output and total input.
Appendix Table 1: Comparison of results for VA embodied in the foreign final question between original and extended IO table (mil.