Generalized model of thermal boundary conductance between SWNT and surrounding supercritical Lennard-Jones fluid
– Derivation from molecular dynamics simulations –
JinHyeok Cha, Shohei Chiashi, Junichiro Shiomi and Shigeo Maruyama*
Department of Mechanical Engineering, The University of Tokyo 7-3-1 Hongo, Bunkyo-ku, Tokyo 113-8656 Japan
Abstract
Using classical molecular dynamics simulations, we have studied thermal boundary conductance (TBC) between a single-walled carbon nanotube (SWNT) and surrounding Lennard-Jones (LJ) fluids. With an aim to identify a general model that explains the TBC for various surrounding materials, TBC was calculated for three different surrounding LJ fluids, hydrogen, nitrogen, and argon in supercritical phase. The results show that the TBC between an SWNT and surrounding LJ fluid is approximately proportional to local density (L) formed on the outer surface of SWNT and energy parameter () of LJ potential, and inverse proportional to mass (m) of surrounding LJ fluid. In addition, the influence of the molecular mass of fluid on TBC is far more than other inter-molecular potential parameters in realistic range of molecular parameters. Through these parametric studies, we obtained a phenomenological model of the TBC between an SWNT and surrounding LJ fluid.
*Corresponding author: TEL: +81 3 5841 6421; FAX: +81 3 5800 6983.
Email: [email protected]
Key words: SWNT, molecular dynamics simulation, thermal boundary conductance
Nomenclature
a Proposed constant, kg m s-1K-1 c Heat capacity, J kg-1K-1
T Temperature difference, K Eb Total potential energy of the system, eV K Thermal boundary conductance, MW m-2K-1 kb Boltzmann’s constant, J K-1
L Length of the respective tube, nm
m Mass, amu
N Number of molecules
r Distance, nm
S Contact area, nm2
T* Dimensionless temperature VR Repulsive force term
VA Attractive force term
V Volume, nm3
Lennard-Jones potential, eV
L Local density, number of molecules nm-3
Density, kg m-3
* Dimensionless density
Energy scale of LJ potential, eV
Length scale of LJ potential, nm
Relaxation time constant, ps v Velocity, m s-1
Subscript
C Carbon
SWNT Single-walled carbon nanotube LJ Surrounding LJ fluid molecules
SWNT-LJ Inter material property between an SWNT and LJ fluid MD Molecular dynamics simulation
model The obtained model
1. Introduction
Single-walled carbon nanotubes (SWNTs) [1] have been investigated in various fields to take advantage of their outstanding electrical, optical, mechanical and thermal properties [2,3]. In thermal engineering, their thermal conductivity that is believed to surpass even the value of diamond has caught particular attention. One of the promising applications is to use SWNTs as additives to enhance thermal conductivity of composite materials [4-8]. For instance, the thermal conductivity enhancement by adding nanotube in oil has been measured to be much higher than the enhancement predicted by theoretical models based on Fourier’s law of heat conduction [9].
In addition, SWNTs have been shown to augment thermal conductivity of epoxy more than larger-diameter carbon fibers [10]. On the other hand, it is known that the effective thermal conductivity of the composite can be strongly influenced by thermal boundary resistance (TBR) between carbon nanotubes and surrounding medium [11, 12]. Therefore, to quantify the heat flow through the system for thermal management, it is essential to understand TBR.
Thermal boundary resistance, with its importance in small scale, has been studied by various methods and viewpoints. Since convectional models such as acoustic mismatch model (AMM) and diffuse mismatch model (DMM) fail to accurately predict TBR [13], molecular dynamics simulations, with capability of resolving the atomistic structure and dynamics at the interface, have been widely used. One of the first works was reported by Maruyama and Kimura [14] who demonstrated that temperature discontinuity resulting from thermal resistance exists at the solid-liquid surface, so-called Kapitza resistance. This was followed by Ohara and Suzuki [15] who investigated interfacial thermal resistance at a solid-liquid surface based on the intermolecular energy transfer. There have been also several researches on TBR between SWNT and surrounding material [16-19]. For the interface between SWNT and octane liquid, Shenogin et al. [16] demonstrated the TBR plays a barrier to thermal conductivity for carbon-nanotube polymer composite and organic suspensions. Furthermore, Carlborg et al. [17] investigated the TBR between SWNT and Lennard-Jones molecules focusing on the frequency dependence of energy transport. Hu et al. [18] showed the TBR between SWNT and air with the influence of energy parameter of LJ potential. While these studies have revealed interfacial thermal transport of specific system or parameter, the general model that relates TBR and molecular potential parameters, which would be useful to design SWNT composites, is not available to this date.
In this study, we investigate the interfacial thermal transport between an SWNT and various surrounding LJ fluids with the aims to identify the general scaling law by exploring a wide range of parameter space. Here, we qualify the interfacial thermal transport in terms of thermal boundary conductance (TBC), the reciprocal of the TBR. The effect of various fluid parameters was investigated using non-stationary MD simulation, to resolve atomic-scale dynamics between an SWNT and surrounding LJ fluid such as argon, hydrogen, and nitrogen in the supercritical phase.
2. Simulation Method
A 25.1-nm-long SWNT consisting of 2000 carbon atoms was placed in the center of a rectangular simulation cell and surrounded by fluid of 1280 molecules, as shown in Fig. 1.
Simulations were conducted for an armchair SWNT with chirality (5, 5), which has a radius of 0.69 nm. The cross-sectional area of the simulation cell was varied from 2.3×2.3 nm to 46.0×46.0 nm and periodic boundary conditions were applied in all directions.
We employed the Brenner potential [20] with a simplified form [21] to describe the carbon-carbon interactions within the SWNT as the total potential energy of the system Eb, which is expressed as the sum of the binding energy of each bond between carbon atoms i and j.
i ji j
ij A ij ij R
b V r B V r
E
) (
* (1)
VR(rij) and VA(rij) are the repulsive and attractive force terms, respectively, which take the Morse-type form with a cutoff function. Bij* represents the effects of the bonding condition of the atoms. We employed the parameter set II, which is known to be better at reproducing the carbon-carbon force constant [20].
For the interaction between carbon and the surrounding LJ fluid, we adopted the 12-6 Lennard-Jones (LJ) potential based on Van der Waals forces between surrounding fluids molecules,
6 12
4
ij ij
ij r r
r , (2)
where and are the energy and length scales and rij is the distance between i and j molecules.
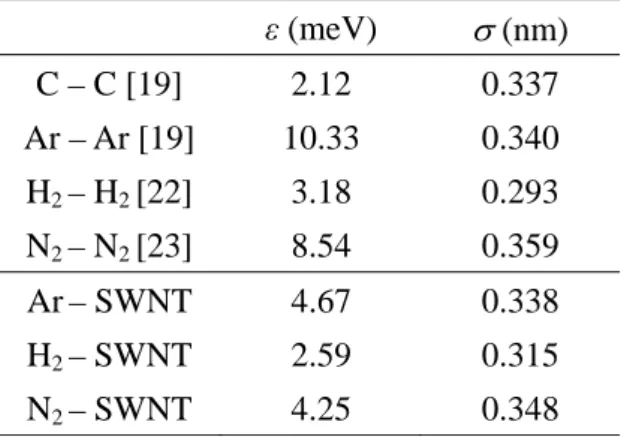
The LJ parameters used are shown in Table 1 [19,22,23]. We determined SWNT-LJ and SWNT-LJ at the interface between SWNT and surrounding LJ fluid by the Lorentz-Berthelot mixing rules as follows.
C LJ
LJ
SWNT
. (3)
2
LJ C LJ SWNT
. (4)
The cutoff distance of the LJ potential function was set to 3.5LJ, and the velocity Verlet method [24] was adopted to integrate the equation of motion with a time step of 0.5 fs. The temperature was defined by assuming the local equilibrium,
N i
B
i Nk T
mv 2 3 2
1 2
, (5)
where m, N, vi, kB and T are mass, number of molecules, velocity of molecule i, Boltzmann
constant, and temperature, respectively. The temperature was controlled by the velocity scaling method.
In this research, we setup the simulation with dimensionless temperature T*=kBT/LJ, and dimensionless density ρ*=ρLJ3/m. Since the intrinsic heat-conduction resistance of SWNT and fluid is sufficiently small compared to the SWNT-LJ fluid TBR, the heat transfer problem can be simplified to interfacial resistance between two point masses with certain heat capacities and thus, we employed the lumped-heat-capacity method. The density ρ* is varied from 0.001 to 0.3 by adjusting the cell size of the unit cell. When setting up the density ρ*, changing the cell size or increasing the number of fluid molecules did not considerably affect the results. In each case, the first step was to keep the SWNT and surrounding LJ fluid at a fixed temperature for 10 ps. The system was then equilibrated for 990 ps without temperature control. After 1000 ps, the SWNT was heated instantaneously from T*=3.0 to 4.5. Note that the temperature of the system was always kept to be above critical temperature of bulk LJ system [25]. Figure 2 shows the result of a simulation with argon of ρ*=0.04 in a 7.0×7.0×25.1 nm cell, and the relaxation time in this case was 300 ps. Variations in the SWNT and surrounding LJ fluid temperature were then recorded.
The ensemble-average was obtained from five independent simulations with different initial conditions. By fitting the temperature difference with ΔT=ΔT0 exp(-t/τ), we obtain the relaxation time τ. Then, the thermal boundary conductance K can be calculated as
1
LJ LJ LJ SWNT SWNT SWNT
1
1
S
V c V
K c
, (6)
where ρ, c, V and S are density, heat capacity, volume and contact area, respectively [17]. The subscripts SWNT and LJ refer to the SWNT and surrounding LJ fluid. The contact area S was calculated as S=L(d+SWNT-LJ), where d is the diameter of the (5, 5) SWNT, SWNT-LJ is length parameter at interface between SWNT and surrounding LJ fluid, and L is the length of the SWNT.
3. Results and Discussion
3.1 Density dependence of thermal boundary conductance
The TBC between an SWNT and various surrounding LJ fluids was calculated over a wide density range. The density and fluid dependences of TBC are shown in Fig. 3. Note that the data are plotted on a log-log scale. The TBC of SWNT-hydrogen case was higher than other fluids for all calculated densities, whereas nitrogen and argon have almost the same TBC values, ranging from 0.037 to 1.27 MW/m2K. It can be seen that, for all the tested fluids, TBC show
nonlinear dependence on the dimensionless density with a kink at around *=0.04, which cannot be explained by the phase transition as the simulations were performed for supercritical fluids.
Now we consider the local fluid density, which is the number density of LJ molecules in the first adsorption layer surrounding the SWNT. The maximum value of the density in the first adsorption layer is termed ρL. As seen from the radial distribution functions shown in Fig. 4, the local density of each fluid ρL increases with dimensionless density ρ*. The distance between the first adsorption layer and the SWNT is different for each fluid, and this distance depends on the value of SWNT-LJ shown in Table 1. Although the second layer was begun to be observed at higher
*, the peak density of the layer was so small that it was considered to have negligible influence on the TBC. The molecules exhibited no noticeable layering beyond the second layer.
Figure 5 shows how the TBC depends on ρL of each fluid. The TBC increases linearly with ρL, and the hydrogen case is found to be much more sensitive to ρL than argon or nitrogen.
By comparing Fig. 4 and Fig. 5 we found that the difference in sensitivity should originate from other inter molecular parameters, which are explored in the next section.
3.2 Fluid dependence of thermal boundary conductance
The parameters used in the simulations were energy scale , length scale and mass m, as seen in Table 1 and Table 2. In order to determine the effect of each parameter on determining the thermal boundary conductance, we have calculated TBC for systems with hypothetical fluids with parameters varied in realistic range. With argon parameters as standard values, each parameter was varied by keeping the other two constant. For all the cases, ρ* was kept at 0.04.
Firstly, Figure 6(a) shows the relationship between LJ and TBC. The TBC increases from 0.19 to 0.54 MW/m2K as LJ increases from 3.18 to 10.34 meV. Secondly, we investigated the effect of LJ. As seen in Fig. 6(b), the change in TBC, which ranges from 0.54 to 0.72 MW/m2K, is smaller than in the case of LJ (Fig. 6(a)). Lastly, we evaluated the effect of mLJ. As seen in Fig. 6(c), we found that the TBC was inverse-proportional to the mass. The dependence of
LJ, LJ and mLJ were fitted by K∝LJ0.9, K∝LJ-1.34 and K∝mLJ-0.76
, respectively.
3.3 Generalized model of thermal boundary conductance
Through the above parametric studies, we obtained a phenomenological description of the thermal boundary conductance between an SWNT and surrounding LJ fluid, described by
LJ LJ L
model a m
K
(7)
where a is equal to 1.0310-30 kg m s-1K-1. The effects of εLJ and mLJ of thermal boundary
conductance are simplified from the fitted relations εLJ0.9 and mLJ-0.76
, as seen in the insets in Fig.
6(a) and Fig. 6(c), respectively. Here, we omitted the LJ from the model because of the weak dependence of TBC on LJ in the realistic range, as shown in the inset in Fig. 6(b). We verified the accuracy of the Eq. (7) by comparing values of the TBC with those obtained from MD simulation (Fig. 7), and they show high consentaneity. However, the values of TBC for two-nitrogen and one-argon cases taken in lower densities seem the TBC obtained from MD is much higher than that from Eq. (7). We believe they should be clarified with more elaborate physical mechanism for heat transfer between SWNT and surrounding fluid in future.
4. Conclusion
The thermal boundary conductance K between a single-walled carbon nanotube (SWNT) and various surrounding Lennard-Jones (LJ) fluids was investigated using non-stationary molecular dynamics simulations. We found that the density dependence on thermal boundary conductance is proportional to the local density of the molecules in the first adsorption layer. The hydrogen case is found to be much more sensitive to the local density than argon or nitrogen. This comes from that dependence of TBC on fluid molecular parameters, where TBC is approximately proportional to energy scale () of LJ potential, and inverse proportional to mass (m) of surrounding LJ fluid. The molecular mass was found to influence TBR far more than other fluid parameters (i.e., and ) within the realistic parameter ranges. Through the parametric studies, we have obtained a phenomenological model of the thermal boundary conductance between an SWNT and surrounding LJ fluid and verified the accuracy of the model.
Acknowledgment
Part of this work was financially supported by Grant-in-Aid for Scientific Research (22226006 and 19051016), and Global COE Program 'Global Center for Excellence for Mechanical Systems Innovation'.
References
[1] S. Ijima, T. Ichihashi, Single-shell carbon nanotubes of 1-nm diameter, Nature (London) 363 (1993) 603-605.
[2] R. Saito, G. Dresselhaus, M. S. Dresselhaus, Physical Properties of Carbon Nanotubes, Imperial College Press, London, 1998.
[3] A. Jorio, G. Dresselhaus, and M. S. Dresselhaus, Carbon Nanotubes: Advanced Topics in the Synthesis, Structure, Properties and Applications, Springer-Verlag, Berlin, 2008.
[4] P. Kim, L. Shi, A. Majumdar, P. L. McEuen, Thermal transport measurements of individual multiwalled nanotubes, Physical Review Letters 87 (2001) 215502-215505.
[5] S. Maruyama, A molecular dynamics simulation of heat conduction of a finite single-walled carbon nanotube, Nanoscale and Microscale Thermophysical Engineering 7 (1) (2003) 41-50.
[6] S. Maruyama, A molecular dynamics simulation of heat conduction in finite length SWNTs, Physica B (Amsterdam) 323 (2002) 193-195.
[7] E. Pop, D. Mann, Q. Wang, K. Goodson, H. Dai, Thermal conductance of an individual single-Wall carbon nanotube above room temperature, Nano Letters 6 (1) (2006) 96-100.
[8] J. Shiomi, S. Maruyama, Molecular dynamics of diffusive-ballistic heat conduction in single-walled carbon nanotubes, Japanese Journal of Applied physics 46 (4) (2008) 2005-2009.
[9] S. U. S. Choi, Z. G. Zhang, W. Yu, F. E. Lockwood, E. A. Grulke, Anomalous thermal conductivity enhancement in nanotube suspensions, Applied Physics Letters 79 (4) (2001) 2252-2254.
[10] M. J. Biercuk, M. C. Llaguno, M. Radosavljevic, J. K. Hyun, A. T. Johnson, J. E. Fischer, Carbon nanotube composites for thermal management, Applied Physics Letters 80 (15) (2002) 2767-2769.
[11] M. B. Bryning, D. E. Milkie, M. F. Islam, J. M. Kikkawa, A. G. Yodh, Thermal conductivity and interfacial resistance in single-wall carbon nanotube epoxy composite, Applied Physics Letters 87 (2008) 161909.
[12] S. T. Huxtable, D. G. Cahill, S. Shenogin, L. P. Xue, R. Ozisik, P. Barone, M. Usrey, M. S.
Strano, G. Siddons, M. Shim, P. Keblinski, Interfacial heat flow in carbon nanotube suspensions, Nature materials 2 (11) (2003) 731-734.
[13] E. T. Swartz, R. O. Pohl, Thermal boundary resistance, Reviews of modern Physics 61 (3) (1989) 605-668.
[14] S. Maruyama, T. Kimura, A study on thermal resistance over a solid-liquid interface by the molecular dynamics method, Thermal Science & Engineering 8 (1) (1999) 63-68.
[15] T. Ohara, D. Suzuki, Intermolecular energy transfer at a solid-liquid interface, Microscale Thermophysical Engineering 4 (2000) 189-196.
[16] S. Shenogin, L. Xue, R. Ozisik, P. Keblinski, D. G. Cahill, Role of thermal boundary resistance on the heat flow in carbon-nanotube composites, Journal of Applied Physics 95 (12)
(2004) 8136-8144.
[17] C. F. Carlborg, J. Shiomi, S. Maruyama, Thermal boundary resistance between single-walled carbon nanotubes and surrounding matrices, Physical Review B 78 (2008) 205406.
[18] M. Hu, S. Shenogin, P. Keblinski, Thermal energy exchange between carbon nanotube and air, Applied Physics Letters 90 (2007) 231905-3.
[19] J. Shiomi, Y. Igarashi, S. Maruyama, Thermal boundary conduction between a single –walled carbon nanotube and surrounding material, Transactions of the Japan Society of Mechanical Engineers 76 (2010) 642-649.
[20] D. W. Brenner, Empirical potential for hydrocarbons for use in simulating the chemical vapor deposition of diamond films, Physical Review B 42 (15) (1990) 9458-9471.
[21] Y. Yamaguchi, S. Maruyama, A molecular dynamics simulation of the fullerene formation process, Chemical Physics Letters 286 (1998) 336-342.
[22] S. Maruyama, T. Kimura, Molecular dynamics simulation of hydrogen storage in single-walled carbon nanotubes, ASME International Mechanical Engineering Congress and Exhibit, Orland, 2000.
[23] S.Tsuda, T. Tokumasu, K. Kamijo, A molecular dynamics study of bubble nucleation in liquid oxygen with impurities, Heat Transfer-Asian Research 34 (7) (2005) 514-526.
[24] H. J. C. Berendsen, J. P. M. Postma, W. F. van Gunsteren, A. DiNola, J. R. Haak, Molecular dynamics with coupling to an external bath, Journal of Chemical Physics 81 (8) (1984) 3684-3690.
[25] J. P. Hansen, L. Verlet, Phase transitions of the Lennard-Jones system, Physical Review 184 (1) (1969) 151-161.
Tables
Table 1. Parameters of Lennard-Joned fluid.
ε (meV) (nm) C – C [19] 2.12 0.337 Ar – Ar [19] 10.33 0.340 H2 – H2 [22] 3.18 0.293 N2 – N2 [23] 8.54 0.359
Ar– SWNT 4.67 0.338
H2 – SWNT 2.59 0.315 N2 – SWNT 4.25 0.348
Table 2. Mass of Lennard-Jones fluid.
C Ar H2 N2
m (amu) 12.0 39.95 2.02 28.01
Figure Captions
Figure 1. Snapshot of a typical molecular dynamics simulation of argon with dimensionless density ρ*=0.04.
Figure 2. (a) Temperature time history for SWNT and surrounding LJ fluid, and (b) temperature difference between the SWNT and argon for ρ*=0.04.
Figure 3. Density dependence of thermal boundary conductance between SWNT and surrounding LJ fluids.
Figure 4. Radial distribution functions of (a) argon, (b) hydrogen and (c) nitrogen for different values of ρ*.
Figure 5. Correlation between local density and thermal boundary conductance.
Figure 6. The effect of each parameter (a) energy scale εLJ (b) length scale LJ and (c) mass mLJ
on determining the thermal boundary conductance. Corresponding insets show the difference in TBC resulting from using approximated relations. All cases are performed at ρ*=0.04.
Figure 7. Comparison of thermal boundary conductance values obtained from MD simulation and Eq.(7).
Fig. 1
Fig. 2
0 1000 2000
400 500
3 4
T (K) T *
SWNT
Surrounding Fluid
Time (ps)
(a)
0 1000 2000
0 100 200
0 1
T (K) T *
Time (ps)
(b)
Fitting line
Fig. 3
10 -3 10 -2 10 -1 10 -1
10 0 10 1
*
K (MW /m 2 K)
Hydrogen
Argon
Nitrogen
Fig. 4
6 8 10
0 20 40 60
Distance from SWNT axis (Å) R a di al di s tr ibut ion f u nc ti on ( n m
-3)
Argon
0.3 0.1 0.04 0.01 0.004 0.001 (a)
6 8 10
0 20 40 60
Distance from SWNT axis (Å) R adi al di s tr ibut ion f unc ti on ( n m
-3)
Hydrogen
0.3 0.1 0.04 0.01 0.004 0.001 (b)
0.6 0.8 1
0 20 40 60
Distance from SWNT axis (nm) R a di al di s tr ibuti o n f u nc ti on ( n m
-3)
*
Argon
0.3 0.1 0.04 0.01 0.004 0.001 (a)
0.6 0.8 1
0 20 40 60
Distance from SWNT axis (nm) R a di al di s tr ibut ion f u nc ti on ( n m
-3)
*
Hydrogen
0.3
0.1
0.04
0.01 0.004
0.001
(b)
Fig. 4
0.6 0.8 1
0 20 40 60
Distance from SWNT axis (nm) R a di al di s tr ibuti o n f u nc ti on ( n m
-3)
*
Nitrogen
0.3
0.1
0.04
0.01 0.004
0.001
(c)
Fig. 5
0 20 40 60
0 2 4 6
L (nm -3 )
K (MW /m 2 K)
Argon
Nitrogen
Hydrogen
Fig. 6
0 5 10
0 0.5 1
(meV) K (MW /m
2K)
Ar (a)
K
3 3.2 3.4 3.6
0 0.5 1
K (MW /m
2K)
(Å) Ar (b)
K
0 5 10
0 0.5 1
100 101
10-1 100
LJ(meV) K (MW /m
2K)
Ar (a)
K
LJ0.90K
LJ0.90K
LJ0.3 0.32 0.34 0.36 0
0.5 1
0.3 0.4
10-1 100
K (MW /m
2K)
LJ(nm) Ar (b)
K
LJ-1.34K
LJ-1.34 K
LJ-1
Fig. 6
0 100
0 2 4 6
m (amu) K (MW /m
2K)
Ar (c)
K m
-0.760 100
0 2 4 6
100 101 102 10-1
100
m
LJ(amu) K (MW /m
2K)
Ar (c)
K m
LJ-0.76K m
LJ-0.76K
LJ-1Fig. 7
10
-210
-110
010
110
-210
-110
010
1Argon
Hydrogen Nitrogen
K MD K mo d e l (MW /m
2K )
(MW/m
2K )