1
Digital Isotope Coding to Trace Growth Process of Individual Single-Walled Carbon Nanotubes
Keigo Otsuka,1 Shun Yamamoto,1 Taiki Inoue,*1 Bunsho Koyano,1 Hiroyuki Ukai,1 Ryo Yoshikawa,1 Rong Xiang,1 Shohei Chiashi,1 Shigeo Maruyama*1,2
1 Department of Mechanical Engineering, The University of Tokyo, 7-3-1 Hongo, Bunkyo- ku, Tokyo 113-8656, Japan
2 Energy NanoEngineering Laboratory, National Institute of Advanced Industrial Science and Technology (AIST), 1-2-1 Namiki, Tsukuba 305-8564, Japan
ABSTRACT
Single-walled carbon nanotubes (SWCNTs) are attracting increasing attention as an ideal material for high-performance electronics through the preparation of arrays of purely semiconducting SWCNTs. Despite significant progress in the controlled synthesis of SWCNTs, their growth mechanism remains unclear due to difficulties in analyzing the time- resolved growth of individual SWCNTs under practical growth conditions. Here we present a method for tracing the diverse growth profiles of individual SWCNTs by embedding digitally coded isotope labels. Raman mapping showed that, after various incubation times, SWCNTs elongated monotonically until their abrupt termination. Ex situ analysis offered an opportunity to capture rare chirality changes along the SWCNTs, which resulted in sudden acceleration/deceleration of the growth rate. Dependence on growth parameters, such as temperature and carbon concentration, was also traced along individual SWCNTs, which
2
could provide clues to chirality control. Systematic growth studies of with a variety of catalysts and conditions, which combine the presented method with other characterization techniques, will lead to further understanding and control of chirality, length and density of SWCNTs.
KEYWORDS
single-walled carbon nanotube, chemical vapor deposition, isotope labeling, growth rate, incubation, lifetime
TOC graphic
3
Single-walled carbon nanotubes (SWCNTs) are promising materials for high-performance transistors due to their extraordinary electrical properties and ultra-thin structures.1,2 High- density aligned arrays of purely semiconducting SWCNTs are required to maximize their potential.3 Although post-growth removal of metallic SWCNTs from substrates4,5 is permissible provided that semiconducting SWCNTs are perfectly preserved, the ultimate goal is to directly synthesize such semiconducting SWCNT arrays. In recent years, SWCNTs with specific chirality above 90% have been synthesized using high-melting-point catalysts6,7 with thermodynamic and kinetic control. In addition, researchers have developed improved syntheses of catalysts and SWCNTs for growing high-density SWCNT arrays,8–10 to achieve the best-performing density with uniform separation.3,11 The nucleation and lengths of SWCNTs need to be further controlled to achieve uniformity over a large area.
In conventional chemical vapor deposition (CVD), dissociated carbon precursors are dissolved and diffuse in/on catalyst nanoparticles. After a period of incubation, carbon atoms precipitate and form caps (nucleation), followed by continuous growth of tube walls until catalytic activity is lost (termination). For chirality-selective growth, the nucleation and growth rate of specific SWCNTs has been studied both theoretically12,13 and experimentally.14–16 Some researchers reported the dependence of population and growth rate/length on the chiral angle,7,14,17 while others concluded that there is no correlation.15,16,18 Most of these studies were based on ex situ analysis; therefore, the lengths could not be broken down into the growth rate and the growth time (catalyst lifetime or CVD time minus incubation time). In contrast, comprehensive in situ observation of bulk SWCNTs revealed average growth rates, incubation times and lifetimes, which were dependent on temperature,
4
carbon concentration and growth enhancers (e.g. water).18–25 However, these approaches did not consider differences among SWCNTs and thus cannot provide the information needed for chirality control. Micro-scale in situ measurements using transmission electron microscopy (TEM)26–28, scanning electron microscopy (SEM)29 and Raman spectroscopy14 revealed the detailed growth behaviors of individual SWCNTs. These studies employed extreme growth conditions due to the nature of the in situ measurement, often resulting in defective or short carbon nanotubes (CNTs). Also, the limited number of CNTs that can be observed during a single synthesis cycle has hindered reliable comparison of a wide variety of CNTs.
In this work, we propose a digital isotope coding method to trace the elongation of horizontally aligned individual SWCNTs. Isotope labeling is used in the field of nanocarbon materials for ex situ growth analysis by monitoring Raman shifts.30–36 We embedded binary- like codes in SWCNTs by periodically introducing a 13C ethanol pulse with three different ratios. The programmed sequence of the isotope codes identifies the time-resolved growth profiles of individual SWCNTs with a wide range of lengths (from 10 to >200 μm), including growth rate, incubation time, lifetime and even pause time. We confirmed that SWCNTs usually start growing after a period of incubation and elongate monotonically until their abrupt termination. One exception of non-constant growth rate along an SWCNT is seen at intramolecular junctions via spontaneous chirality change. Modulation of growth conditions, such as temperature and carbon concentration, can also be linked with changes in growth behavior of individual SWCNTs using our technique.
5
RESULLTS AND DISCUSSION
SWCNT growth with digital isotope coding
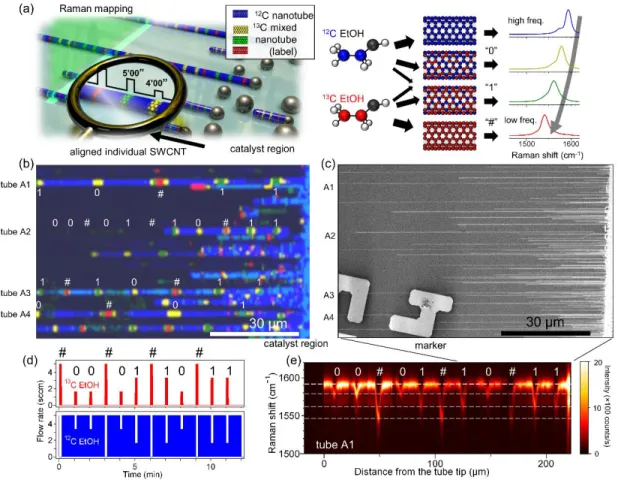
Figure 1 illustrates the overall concept of digital isotope coding. SWCNT segments synthesized from three different ratios (33%, 67% and 100%) of 13C ethanol are defined with binary-like labels 0, 1 and #, respectively. The label # indicates the start of new binaries and enables time determination from a small number of labels. Raman spectra of a pure 12C nanotube and the three types of labels are shown in a right part of Figure 1a. An excitation wavelength of 532 nm (2.33 eV) was used throughout, unless stated otherwise. A 33%
difference in the 13C ethanol content resulted in >10 cm−1 downshift of the G-band; thus, each label can be easily distinguished even when the Raman frequency is shifted by environmental factors.
Raman mapping and SEM images were obtained from the same area and are shown in Figure 1b and c, respectively. The blue, yellow, green and red parts of Figure 1b correspond to pure 12C nanotubes and isotope labels 0, 1 and #, respectively. Ethanol flow rate versus the CVD time to generate this particular isotope coding is shown in Figure 1d. The 13C ethanol was introduced for 10 s to produce all kinds of labels, as it took ~10 s for two isotopic gases to be completely switched at the sample position for the current growth condition.
Computer-controlled mass flow controllers enabled accurate and quick introduction of two types of isotopic ethanol (Figure S1b). Figure 1e shows a Raman intensity map along an SWCNT (tube A1), where different types of isotope labels are well distinguished. The sequence of G-band downshifts was the same as the programmed one (Figure 1d).
6
In Figure 1b, labels are fixed to four SWCNTs (tubes A1–4). The isotope labels introduced later (e.g. 1-0-#-1-1) appeared near the original catalyst position, clearly indicating a base- growth mode for all the SWCNTs observed in this study (more than 100 tubes). This result is consistent with a study on horizontally aligned SWCNTs grown on sapphire using iron catalysts31 but inconsistent with a study on those grown on ST-cut quartz using copper catalysts.37
Figure 1. Digitally coded isotope labeling of individual SWCNTs. (a) Schematic of isotope labeling to trace the growth of individual SWCNTs. Isotope labels with one-third and two-thirds
13C are defined as label “0” and label “1”, respectively, while SWCNTs grown from 100% 13C are denoted “#”, signaling the start of new binaries. Raman spectra of SWCNTs grown from ethanol
7
with four different fractions of 13C are shown on right. The excitation wavelength was 532 nm.
(b,c) Raman mapping image (b) and SEM image (c) of the same SWCNT arrays. Named SWCNTs (tubes A1–4) are labelled with white letters (digital codes) in (b). Details of tube A2 are described in Figure S12. (d) Gas flow rates of 12C ethanol and 13C ethanol for isotope coding.
(e) Raman intensity map along the entire length of a representative SWCNT (tube A1).
Growth profiles of individual SWCNTs
Aligned SWCNTs were grown at 800°C for 12 min (tCVD = 12 min) with 2-bit isotope labeling at one minute intervals (Δt = 1 min) (Figure 1d). One CVD process consumed <20 μL (<15 mg) of 13C ethanol but yielded more than one million SWCNTs. Each SWCNT needs two or three labels to identify the growth time under this condition. The time evolution of the lengths L of five representative SWCNTs is plotted in Figure 2a. For example, one SWCNT (tube A4) started to grow right after the ethanol supply and elongated at a constant rate (γ = dL/dt ≈ 23 μm/min) until spontaneous growth termination at t ≈ 6 min. Growth of the other SWCNTs was initiated after incubation,38 and most SWCNTs continued growing until the ethanol supply was stopped (t = 12 min). It is worth mentioning that this is the first report of time-resolved growth of individual SWCNTs in a practical form (>100 μm long arrays), while a previous isotope labeling study revealed average growth rate and catalyst lifetime for ensemble samples.36
The growth rate of all the SWCNTs remained fairly constant with time, contrary to gradually decaying growth curves reported in many studies14,20,39,40 but in good agreement with others that described abrupt termination.22,41 Such constant growth and abrupt termination were observed in a previous study that analyzed the length distribution of ultra-
8
long CNTs and concluded that CNT lengths follow a Schulz-Flory distribution.41 In contrast, we also found that the average length of many SWCNTs exhibits exponential decay (Figure S4), which is consistent with previous reports on ensemble SWCNTs.20,21,39,40 This is because the number of actively growing SWCNTs decreased with time. A simple simulation that assumes a constant growth rate and random termination with a certain probability (Figure S4d) shows clear exponential decay (L = γ0τ(1-exp(-t/τ)))20,39 of the average length. Iron nanoparticles were thus expected to maintain a certain level of catalytic activity until growth termination, which is probably caused by encapsulation with carbon shells42,43 or carbide formation.35 This indicates that the catalyst lifetime could be elongated by some form of reactivation, e.g. removal of carbon shells from catalysts.
It remains uncertain whether the growth rate of SWCNTs depends on their chirality.12,14–
16,40 One might wonder whether the growth rate of SWCNTs with the same chirality is the same under identical CVD conditions. Figure 2b illustrates two (14,4) SWCNTs with a radial breathing mode (RBM) frequency of ~190 cm−1, which had similar lengths but significantly different growth rates (~8 and ~15 μm/min). Growth rates differ even for the same chirality, which suggests that linking the growth rate to the chirality needs to be performed statistically to avoid this type of variation. This difference may originate from the variation in catalyst nanoparticles, as a recent TEM study revealed that a smaller tube/particle diameter ratio led to a larger growth rate due to differences in growth modes (so-called “tangential” and
“perpendicular” modes).16,27
Figure 2c shows the growth rate as a function of the chiral angle. The SWCNTs we analyzed had lengths of 10–220 μm, and chirality (n,m) was assigned based on Raman
9
spectroscopy (Figure S6). We found that SWCNTs with a near-armchair configuration showed a slight tendency to grow faster than other SWCNTs, in accordance with previous studies.12,14,40 However, the growth rate varies considerably among SWCNTs with similar chiral angles. Note that the SWCNT density was higher near catalyst stripes than the spatial resolution of Raman measurement under the present growth conditions, and therefore the abundance of SWCNTs cannot be meaningfully discussed here (see Figure S3 for length bias by Raman measurement).
Seeking other factors that dominate the growth rate, we also examined the relation between the tube diameter and growth rate. Excitation wavelengths of 488 and 532 nm were used to cover a wide range of diameters. Figure 2d shows an overall tendency for SWCNTs with smaller diameters to grow faster. This can probably be explained by other factors such as the size ratio between SWCNTs and catalysts.16
10
Figure 2. Growth profiles of individual SWCNTs. (a) Time evolution of lengths of representative
SWCNTs obtained with isotope labeling. Crosses (x) represent termination of growth before the end of a CVD cycle at 12 min. Two SWCNTs stopped growing abruptly. The others kept growing until the ethanol supply was stopped. (b) Time evolution of length (black) and growth rate (red) of two SWCNTs with the same chirality (14,4). Inset: the RBM spectra of both SWCNTs had a peak at 190 cm−1 (c,d) Growth rate as a function of chiral angle (c), and tube diameter (d). Thick gray lines are drawn only as guides for the eye. (e) Growth rate versus incubation time. Green circles and blue triangles indicate the same (n,m) SWCNTs. Top panel: Histogram of the incubation time. (f) Growth lifetime versus incubation time for SWCNTs with tCVD = 24 min. Right panel: Histogram of the lifetime.
Our technique is unique in that it clearly determines the growth incubation time.252838 In Figure 2e, the growth rate is plotted versus incubation time τinc for the 12 min CVD. As with the variation of growth rates, incubation time ranged widely under the same condition. We found that fast-growing nanotubes had a shorter incubation time for the first 5 min (see also Figure S3). The correlation is not biased by the limited lengths of analyzable SWCNTs, as SWCNTs that were too short (<10 μm) would be plotted in the gray region in Figure 2e.
Since carbon concentration generally has a positive and negative correlation with growth rate and incubation time, respectively,38 this result implies that each SWCNT experiences a different growth driving force (or supersaturation of carbon) due to diversity of catalyst nanoparticles. Furthermore, SWCNTs with specific chiralities are plotted with green circles and blue triangles for (12,8) and (14,4) indices, respectively, but showed diverse growth rates
11
and incubation times. Future works on catalyst nanoparticles, which might be the origin of these results, are required using TEM, along with the growth profiles of SWCNTs.
The growth lifetime is another unique characteristic that can be determined with this technique. We performed another CVD for 24 min (3-bit coding), and analyzed the SWCNTs with the lengths of 50–230 μm. In Figure 2f, the growth lifetime τlife is plotted against the incubation time τinc. The plots are randomly scattered, and there appears to be no correlation between the incubation time and the growth lifetime. This is reasonable if growth termination is indeed induced by accidental encapsulation of catalyst nanoparticles with carbon shells, as the growth rate remained constant until the abrupt termination. No data points exist in the grey areas due to the limited CVD time (tCVD < τinc + τlife) or insufficient number of labels for determining the time (τlife < (k+1)Δt). By considering such biases in a histogram of the lifetime (right panel of Figure 2f), the SWCNT growth lifetime randomly appeared.
Temperature modulation and changes in growth behavior
Digital coding of isotope labels offers new opportunities to link the modulation of growth conditions, such as pressure and temperature, with corresponding changes in the growth behavior of individual SWCNTs. Many experiments have studied dependence on the growth temperature, but not many have been conducted on the effect of temperature change during CVD on individual SWCNTs.44 Our method of digital-like isotope labeling enables one-by- one investigation of the temperature dependence.
Here, the ethanol flow rate was kept constant with 3-bit isotope labels and a 45 s label interval (Δt = 45 s). CVD synthesis of SWCNTs started at ~750°C; the temperature was then
12
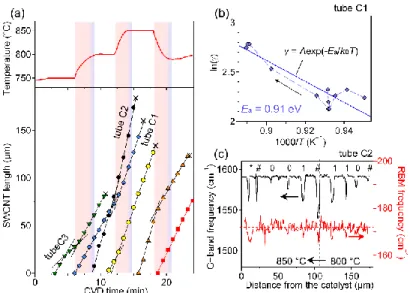
changed to 800, 850 and 800°C at t = 6, 12 and 18 min, respectively. The temperature response was slow due to the large heat capacitance of the furnace. The bottom panel in Figure 3a exhibits the growth curves of representative SWCNTs. This clearly shows that the growth rate γ increased/decreased with the temperature for all the SWCNTs. This is consistent with experiments on ensemble nanotubes.18
The temperature dependence can be traced along an SWCNT without considering the difference in catalyst size/composition. For example, Figure 3b shows an Arrhenius plot of growth rates γ obtained from the single SWCNT represented by blue diamonds (tube C1) in Figure 3a. Each plot corresponds to the growth rate recorded every 45 s at different temperatures. The Arrhenius plot yields the activation energy (0.91 eV) of the rate-limiting process for the growth of this particular SWCNT. This value is close to that for carbon bulk diffusion in iron nanoparticles,45 which is likely to limit the growth rate under this condition.
This method offers an additional opportunity to probe differences among numerous SWCNTs from one growth condition. By identifying the rate-limiting process for each SWCNT, the key to determining the growth rates and chirality could be investigated in detail.
Figure 3c shows typical transitions of G-band and RBM frequencies along the axis of an SWCNT (tube C2 in Figure 3a). This shows the correct sequence of isotope labels and an unchanged RBM frequency over the entire length. At the same time, we observed an SWCNT that appeared to change its chirality when the temperature was changed by 50°C (see Figure S10), although such an intramolecular junction, formed during steep temperature changes remains rare through a few times of temperature perturbation, unlike a previous study (90 cycles).46
13
Figure 3. Temperature-dependent growth behavior of individual SWCNTs. (a) Time evolution of
lengths of SWCNTs (bottom panel) grown at different temperatures (top panel) with tCVD = 24 min. (b) Arrhenius plots of the temperature-dependent growth rate of the individual SWCNT (tube C1: blue diamonds) in (a). The activation energy for the growth of this particular SWCNT was 0.91 eV. Each plot shows growth rates recorded every 45 s. (c) G-band and RBM frequency along the SWCNT (tube C2) plotted as black circles in (a). No change in chirality was observed.
A G-band downshift marked by a star near the catalyst originates from another short SWCNT.
Pressure modulation and changes in growth behavior
The pressure of carbon feedstocks is another important parameter for the growth of SWCNTs and has therefore been chosen carefully to improve the quality and (n,m) selectivity.47 Some studies changed the pressure of carbon feedstocks during CVD to probe the SWCNT growth dynamics.48 Also, it is well known that the growth rate of CNTs
14
correlates positively (e.g. proportional relation) with the pressure of carbon feedstocks.20,21 However, such investigations were usually performed with bulk ensembles.
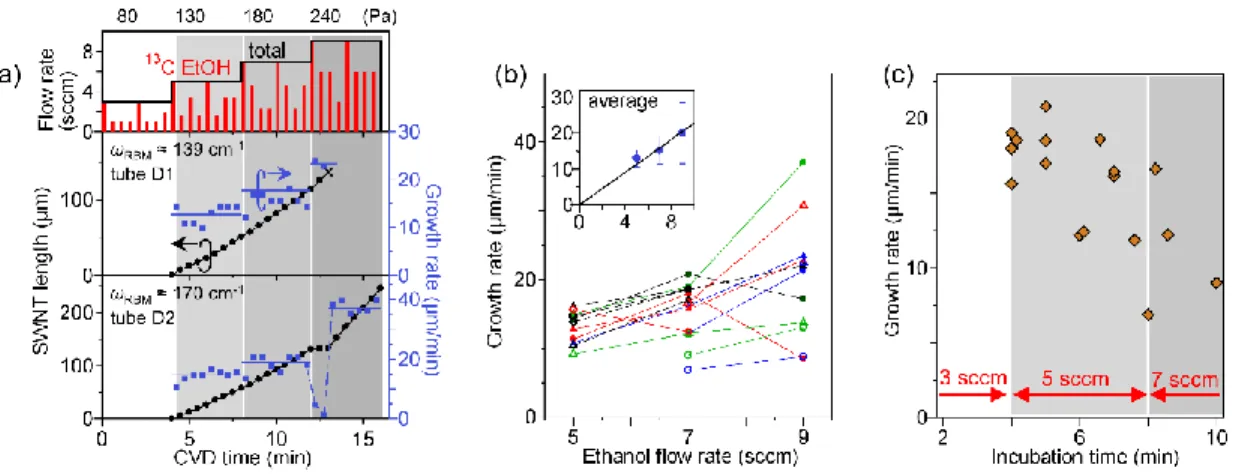
Here, the ethanol flow rate was increased step-by-step from 3 to 9 sccm during CVD (top panel of Figure 4a) while keeping the remaining parameters (e.g. growth temperature of 800°C) constant. Hence the partial pressure of ethanol was proportional to the flow rate.
Thirty-two isotope labels (3-bit coding) were incorporated in the SWCNT growth with Δt = 30 s. Figure 4a shows growth curves for a typical SWCNT (tube D1, middle panel) and an SWCNT with unusual behavior (tube D2, bottom panel). The growth accelerated as the ethanol pressure increased, in accordance with other studies on ensemble SWCNTs.20,21
Figure 4b shows the growth rates of 18 individual SWCNTs at each growth stage. Growth rates of most SWCNTs increased with the ethanol flow rate elevated from 5 to 7 sccm, but that of individual SWCNTs were not always proportional to the flow rate. Interestingly, some SWCNTs even exhibited a negative relation between the ethanol pressure and growth rate.
A similar relation was observed in bulk SWCNT samples when pressures are higher than certain values.20,21 This suggests that each SWCNT has different optimum growth conditions.
Nevertheless, the average growth rate of all the SWCNTs was proportional to the ethanol flow rate (inset of Figure 4b).
In Figure 4c, the growth rate with the 7 sccm ethanol supply is plotted against the incubation time. No SWCNTs nucleated with the supply of 3 sccm ethanol among the 18 studied here, and growth of some SWCNTs was initiated when the ethanol flow rate was increased to 5 sccm. In contrast, when the initial flow rate of ethanol was 5 sccm (Figure 2e), many SWCNTs started to grow within a few minutes. This suggests the presence of a
15
threshold pressure for the nucleation of SWCNTs.48 As with the result shown in Figure 2e, a slower growth rate trend was observed for SWCNTs with longer incubation times.
Surprisingly, some SWCNTs temporally stopped growing for 1–2 min as the flow rate increased but then resumed growing and drastically changed their growth rate as shown in the bottom panel of Figure 4a (tube D2). The Raman mapping image and spectra along the SWCNT (see Figure S11) clearly show that this is a single nanotube. The significantly increased growth rate after 12 min (from 19 to 37 μm/min) suggests a change in the growth mode, though the chirality remained constant along the tube. Further experiments and discussion are needed to understand the pause and resumption of SWCNT growth that is induced by a sudden pressure change.
Figure 4. Linking pressure modulation and growth behavior. (a) Schematic of 13C ethanol flow rate (red bars) and total flow rate (black line) with 3-bit coding (top panel). Time evolution of SWCNT length and growth rate with elevated ethanol flow rates (middle and bottom panels).
The partial pressure of ethanol was almost proportional to the ethanol flow rate in our CVD system. Some SWCNTs (3 out of 18 SWCNTs investigated here) showed a pause in their growth when the ethanol flow rate increased (bottom panel). (b) Growth rate of individual SWCNTs as
16
a function of flow rate. Inset: average growth rate versus ethanol flow rate. Error bars represent the standard deviation. (c) Growth rate (with an ethanol flow rate of 7 sccm) as a function of incubation time. SWCNT growth was initiated only after the ethanol flow rate was increased from 3 to 5 sccm.
Growth rate change at intramolecular junctions
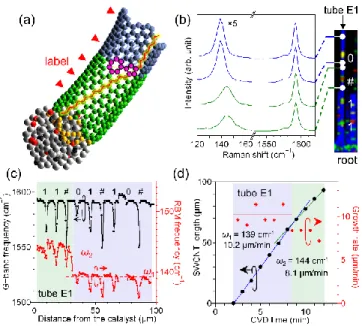
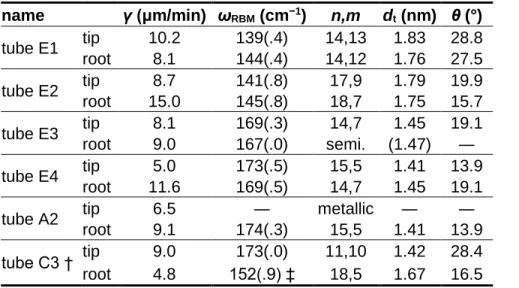
Ex situ characterization can also capture a rare event that provides unique insights into nanotube growth mechanisms. Since the growth behavior of a single (n,m) SWCNT varied considerably, the chirality dependence of the growth rate remains a mystery. While keeping the growth condition constant throughout, we observed spontaneously formed intramolecular junctions (i.e. chirality changes within a nanotube (Figure 5a))44,49 to probe the intrinsic chirality dependence of identical catalyst nanoparticles. As shown in Figure 5b, two different RBM spectra were obtained from an SWCNT (tube E1) at different positions, while the G- band was uniform over the whole length. Figure 5c shows the G-band (black line) and RBM (red line) frequencies along the axis of an SWCNT. Importantly, we found that the RBM frequency ωRBM of the 12C nanotube part suddenly changed from 139 cm−1 (tip side) to 144 cm−1 (root side) ~30 μm away from the catalyst. Despite the change in RBM frequency, the sequence of isotope labels appeared as programmed, indicating that this was a single SWCNT rather than multiple SWCNTs lying close together.
The time evolution of the SWCNT length (black) and the growth rate (red) is plotted in Figure 5d. The growth rate γ changed from 10.2 to 8.1 μm/min exactly at the junction. The difference in diameter dt (from 1.83 to 1.76 nm) and chiral angle θ (from 28.8 to 27.5°) via the junction somehow resulted in the growth rate modulation. Although a chirality change is
17
a quite rare event, ex situ measurements enabled identification of the length evolution of five more SWCNTs with junctions. Formation frequency of such junctions was roughly 1.4 × 10⁻³ μm−1 (five junctions over accumulative length of 3.6 mm examined). Detailed information about the change in growth behavior at junctions is summarized in Table 1. The growth rate increased or decreased at intramolecular junctions, but no clear trend could be found from the limited amount of data. Note that both (n,m) parts of some SWCNTs were resonant to a single laser all along, but in others, the different parts were resonant to different lasers (such as tube C3).
Figure 5. Growth rate change at an intramolecular junction. (a) Schematic of a SWCNT with
spontaneous chirality change induced by a pentagon-heptagon pair. Chiral indices of this schematic are (14,7) (tip) and (15,5) (root). (b) Raman spectra along an SWCNT (tube E1) at four different points shown in a Raman mapping image on the right. (c) Frequencies of G-mode and RBM signals of the SWCNT (tube E1) versus distance from the catalyst. The root (0 < x <
30 μm) and tip (30 < x < 95 μm) have RBM frequencies around 139 and 144 cm−1, respectively.
18
The chirality is likely to change from (14,13) to (14,12). (d) Time evolution of length (black, left axis) and growth rate (red, right axis) of the SWCNT. A chirality change occurred around t = 8.5 min, decreasing the growth rate.
Table 1. Summary of the growth rates of SWCNTs with intramolecular junctions.
name γ (μm/min) ωRBM (cm−1) n,m dt (nm) θ (°) tube E1 tip 10.2 139(.4) 14,13 1.83 28.8
root 8.1 144(.4) 14,12 1.76 27.5
tube E2 tip 8.7 141(.8) 17,9 1.79 19.9
root 15.0 145(.8) 18,7 1.75 15.7
tube E3 tip 8.1 169(.3) 14,7 1.45 19.1
root 9.0 167(.0) semi. (1.47) ―
tube E4 tip 5.0 173(.5) 15,5 1.41 13.9
root 11.6 169(.5) 14,7 1.45 19.1
tube A2 tip 6.5 ― metallic ― ―
root 9.1 174(.3) 15,5 1.41 13.9
tube C3 † tip 9.0 173(.0) 11,10 1.42 28.4
root 4.8 152(.9) ‡ 18,5 1.67 16.5
† The SWCNT was grown at 750°C; ‡ The RBM spectrum was obtained with 633 nm excitation.
The first decimal place in brackets of the RBM frequencyωRBM is not significant as each SWCNT has some variation along its axis.
CONCLUSIONS
We have proposed the digital 13C coding to trace the growth process of a variety of individual SWCNTs with a wide range of length. This provided deeper and previously inaccessible insights into growth process of SWCNTs. Compatibility of this technique with other growth conditions will open a chance to restudy and improve the methods found in literatures. Furthermore, this study have revealed the large variation of growth behavior even among the same (n,m) SWCNTs; therefore, other promising opportunities for future work
19
include the quest for hidden parameters governing the SWCNT growth, in conjunction with other characterization methods, such as TEM and nanoscale optical spectroscopy.
METHODS
Growth and transfer of horizontally aligned SWCNTs. We used r-cut single-crystal quartz substrates (Hoffman Materials Inc.) to grow horizontally aligned SWCNTs. Iron (with a nominal thickness of 0.2 nm) was thermally evaporated in photolithographically patterned stripes with 300 μm separation. Photoresists were removed by immersion in acetone and annealing at 750°C for 5 min in air, immediately followed by a growth process. The typical CVD process was as follows. First, the catalysts were reduced in an Ar atmosphere containing 3% H2 (~40 kPa, 300 sccm) at 800°C for 10 min. The flow rate of Ar/H2 was then decreased to 50 sccm together with the introduction of 5 sccm of ethanol. Total pressure and ethanol partial pressure during the growth was 1.5–1.7 kPa and 140–150 Pa, respectively.
After a certain growth time (tCVD), the ethanol was switched off and pure Ar was introduced until the furnace was cooled to room temperature. By using a PMMA mediated transfer technique, SWCNT arrays were transferred to Si with a 100 nm oxide layer for Raman analysis. To identify the positions of SWCNTs, metallic markers (20 nm thick Au) were patterned on SiO2/Si substrates before transfer of the SWCNTs.
Digitally coded isotope labeling. For isotope labeling, the flow rates of the two ethanol isotopes (12C and 13C (Cambridge Isotope Laboratories, Inc., 1,2-13C2, 99%, <6% H2O)) were
20
separately controlled by electronic mass flow controllers using a computer software (National Instruments, LabVIEW). Most parts of SWCNTs were grown from 12C ethanol to minimize a cost and an influence of impurities in 13C feedstock on the growth (see Figure S7). Short SWCNT parts were synthesized with a certain time interval from three different
13C fractions, which served as binary codes (0, 1) and a label appearing before the binaries (denoted #). Since the flow rate of ethanol was small, and a low-pressure CVD system was used in this study, naturally evaporated ethanol at room temperature was introduced into a reaction chamber. Ar/H2 buffer gas was introduced during CVD to increase gas velocity (~0.4 m/s) while suppressing gas diffusion for better switching of the two isotopic ethanol gases at the quartz substrates.
Raman mapping measurement. We utilized Raman spectrometry (Renishaw, inVia) to determine the types and positions of isotope labels in SWCNTs transferred to SiO2/Si substrates, and then converted them to time evolution of SWCNT lengths. Raman spectra were obtained in 0.6 μm steps along directions both parallel and perpendicular to the SWCNT orientation. Most of the measurements were performed with excitation wavelengths of 532 nm. This is because the strong power of the available laser enabled efficient Raman mapping measurement, and the photon energy is resonant with a wide range of semiconducting SWCNTs grown under the current growth conditions (average diameter is ~1.5 nm).
Typically, each Raman spectrum was acquired over 5 s with excitation by a ~0.6 μm wide and ~17 μm long streamlined laser with an intensity of ~30 mW (power density ~3 × 10⁵ W/cm2).
21
REFERENCES
(1) Cao, Q.; Tersoff, J.; Farmer, D. B.; Zhu, Y.; Han, S. Carbon Nanotube Transistors Scaled to a 40-Nanometer Footprint. Science 2017, 356, 1369–1372.
(2) Shulaker, M. M.; Hills, G.; Park, R. S.; Howe, R. T.; Saraswat, K.; Wong, H.-S. P.;
Mitra, S. Three-Dimensional Integration of Nanotechnologies for Computing and Data Storage on a Single Chip. Nature 2017, 547, 74–78.
(3) Franklin, A. D. Electronics: The Road to Carbon Nanotube Transistors. Nature 2013, 498, 443–444.
(4) Jin, S. H.; Dunham, S. N.; Song, J.; Xie, X.; Kim, J.; Lu, C.; Islam, A.; Du, F.; Kim, J.; Felts, J.; et al. Using Nanoscale Thermocapillary Flows to Create Arrays of Purely Semiconducting Single-Walled Carbon Nanotubes. Nat. Nanotechnol. 2013, 8, 347–
355.
(5) Otsuka, K.; Inoue, T.; Maeda, E.; Kometani, R.; Chiashi, S.; Maruyama, S. On-Chip Sorting of Long Semiconducting Carbon Nanotubes for Multiple Transistors along an Identical Array. ACS Nano 2017, 11, 11497–11504.
(6) Yang, F.; Wang, X.; Zhang, D.; Yang, J.; Luo, D.; Xu, Z.; Wei, J.; Wang, J.-Q.; Xu, Z.; Peng, F.; et al. Chirality-Specific Growth of Single-Walled Carbon Nanotubes on Solid Alloy Catalysts. Nature 2014, 510, 522–524.
(7) Zhang, S.; Kang, L.; Wang, X.; Tong, L.; Yang, L.; Wang, Z.; Qi, K.; Deng, S.; Li, Q.; Bai, X.; et al. Arrays of Horizontal Carbon Nanotubes of Controlled Chirality Grown Using Designed Catalysts. Nature 2017, 543, 234–238.
(8) Hong, S. W.; Banks, T.; Rogers, J. A. Improved Density in Aligned Arrays of Single- Walled Carbon Nanotubes by Sequential Chemical Vapor Deposition on Quartz. Adv.
Mater. 2010, 22, 1826–1830.
22
(9) Zhou, W.; Ding, L.; Yang, S.; Liu, J. Synthesis of High-Density, Large-Diameter, and Aligned Single-Walled Carbon Nanotubes by Multiple-Cycle Growth Methods. ACS Nano 2011, 5, 3849–3857.
(10) Hu, Y.; Kang, L.; Zhao, Q.; Zhong, H.; Zhang, S.; Yang, L.; Wang, Z.; Lin, J.; Li, Q.;
Zhang, Z.; et al. Growth of High-Density Horizontally Aligned SWNT Arrays Using Trojan Catalysts. Nat. Commun. 2015, 6, 6099.
(11) Patil, N.; Jie Deng; Mitra, S.; Wong, H.-S. P. Circuit-Level Performance Benchmarking and Scalability Analysis of Carbon Nanotube Transistor Circuits. IEEE Trans. Nanotechnol. 2009, 8, 37–45.
(12) Ding, F.; Harutyunyan, A. R.; Yakobson, B. I. Dislocation Theory of Chirality- Controlled Nanotube Growth. Proc. Natl. Acad. Sci. 2009, 106, 2506–2509.
(13) Artyukhov, V. I.; Penev, E. S.; Yakobson, B. I. Why Nanotubes Grow Chiral. Nat.
Commun. 2014, 5, 4892.
(14) Rao, R.; Liptak, D.; Cherukuri, T.; Yakobson, B. I.; Maruyama, B. In Situ Evidence for Chirality-Dependent Growth Rates of Individual Carbon Nanotubes. Nat. Mater.
2012, 11, 213–216.
(15) Inoue, T.; Hasegawa, D.; Chiashi, S.; Maruyama, S. Chirality Analysis of Horizontally Aligned Single-Walled Carbon Nanotubes: Decoupling Populations and Lengths. J.
Mater. Chem. A 2015, 3, 15119–15123.
(16) He, M.; Magnin, Y.; Amara, H.; Jiang, H.; Cui, H.; Fossard, F.; Castan, A.; Kauppinen, E.; Loiseau, A.; Bichara, C. Linking Growth Mode to Lengths of Single-Walled Carbon Nanotubes. Carbon 2017, 113, 231–236.
(17) Ishii, A.; Yoshida, M.; Kato, Y. K. Exciton Diffusion, End Quenching, and Exciton- Exciton Annihilation in Individual Air-Suspended Carbon Nanotubes. Phys. Rev. B 2015, 91, 125427.
(18) Kharlamova, M. V.; Kramberger, C.; Saito, T.; Sato, Y.; Suenaga, K.; Pichler, T.;
23
Shiozawa, H. Chirality-Dependent Growth of Single-Wall Carbon Nanotubes as Revealed inside Nano-Test Tubes. Nanoscale 2017, 9, 7998–8006.
(19) Chiashi, S.; Murakami, Y.; Miyauchi, Y.; Maruyama, S. Cold Wall CVD Generation of Single-Walled Carbon Nanotubes and in Situ Raman Scattering Measurements of the Growth Stage. Chem. Phys. Lett. 2004, 386, 89–94.
(20) Einarsson, E.; Murakami, Y.; Kadowaki, M.; Maruyama, S. Growth Dynamics of Vertically Aligned Single-Walled Carbon Nanotubes from in Situ Measurements.
Carbon 2008, 46, 923–930.
(21) Picher, M.; Anglaret, E.; Arenal, R.; Jourdain, V. Self-Deactivation of Single-Walled Carbon Nanotube Growth Studied by in Situ Raman Measurements. Nano Lett. 2009, 9, 542–547.
(22) Hasegawa, K.; Noda, S. Millimeter-Tall Single-Walled Carbon Nanotubes Rapidly Grown with and without Water. ACS Nano 2011, 5, 975–984.
(23) Chen, G.; Davis, R. C.; Kimura, H.; Sakurai, S.; Yumura, M.; Futaba, D. N.; Hata, K.
The Relationship between the Growth Rate and the Lifetime in Carbon Nanotube Synthesis. Nanoscale 2015, 7, 8873–8878.
(24) Navas, H.; Picher, M.; Andrieux-Ledier, A.; Fossard, F.; Michel, T.; Kozawa, A.;
Maruyama, T.; Anglaret, E.; Loiseau, A.; Jourdain, V. Unveiling the Evolutions of Nanotube Diameter Distribution during the Growth of Single-Walled Carbon Nanotubes. ACS Nano 2017, 11, 3081–3088.
(25) Li-Pook-Than, A.; Lefebvre, J.; Finnie, P. Phases of Carbon Nanotube Growth and Population Evolution from in Situ Raman Spectroscopy during Chemical Vapor Deposition. J. Phys. Chem. C 2010, 114, 11018–11025.
(26) Hofmann, S.; Sharma, R.; Ducati, C.; Du, G.; Mattevi, C.; Cepek, C.; Cantoro, M.;
Pisana, S.; Parvez, A.; Cervantes-Sodi, F.; et al. In Situ Observations of Catalyst Dynamics during Surface-Bound Carbon Nanotube Nucleation. Nano Lett. 2007, 7,
24 602–608.
(27) Fiawoo, M.-F. C.; Bonnot, A.-M.; Amara, H.; Bichara, C.; Thibault-Pénisson, J.;
Loiseau, A. Evidence of Correlation between Catalyst Particles and the Single-Wall Carbon Nanotube Diameter: A First Step towards Chirality Control. Phys. Rev. Lett.
2012, 108, 195503.
(28) Zhang, L.; He, M.; Hansen, T. W.; Kling, J.; Jiang, H.; Kauppinen, E. I.; Loiseau, A.;
Wagner, J. B. Growth Termination and Multiple Nucleation of Single-Wall Carbon Nanotubes Evidenced by in Situ Transmission Electron Microscopy. ACS Nano 2017, 11, 4483–4493.
(29) Wako, I.; Chokan, T.; Takagi, D.; Chiashi, S.; Homma, Y. Direct Observation of Single-Walled Carbon Nanotube Growth Processes on SiO2 Substrate by in Situ Scanning Electron Microscopy. Chem. Phys. Lett. 2007, 449, 309–313.
(30) Liu, L.; Fan, S. Isotope Labeling of Carbon Nanotubes and Formation of 12C-13C Nanotube Junctions. J. Am. Chem. Soc. 2001, 123, 11502–11503.
(31) Ago, H.; Ishigami, N.; Yoshihara, N.; Imamoto, K.; Akita, S.; Ikeda, K.; Tsuji, M.;
Ikuta, T.; Takahashi, K. Visualization of Horizontally-Aligned Single-Walled Carbon Nanotube Growth with 13 C/ 12 C Isotopes. J. Phys. Chem. C 2008, 112, 1735–1738.
(32) Li, X.; Cai, W.; Colombo, L.; Ruoff, R. S. Evolution of Graphene Growth on Ni and Cu by Carbon Isotope Labeling. Nano Lett. 2009, 9, 4268–4272.
(33) Whiteway, E.; Yang, W.; Yu, V.; Hilke, M. Time Evolution of the Growth of Single Graphene Crystals and High Resolution Isotope Labeling. Carbon 2017, 111, 173–
181.
(34) Sun, L.; Lin, L.; Zhang, J.; Wang, H.; Peng, H.; Liu, Z. Visualizing Fast Growth of Large Single-Crystalline Graphene by Tunable Isotopic Carbon Source. Nano Res.
2017, 10, 355–363.
(35) Harutyunyan, A. R.; Mora, E.; Tokune, T.; Bolton, K.; Rosén, A.; Jiang, A.; Awasthi,
25
N.; Curtarolo, S. Hidden Features of the Catalyst Nanoparticles Favorable for Single- Walled Carbon Nanotube Growth. Appl. Phys. Lett. 2007, 90, 163120.
(36) Mora, E.; Harutyunyan, A. R. Study of Single-Walled Carbon Nanotubes Growth via the Catalyst Lifetime. J. Phys. Chem. C 2008, 112, 4805–4812.
(37) Ding, L.; Yuan, D.; Liu, J. Growth of High-Density Parallel Arrays of Long Single- Walled Carbon Nanotubes on Quartz Substrates. J. Am. Chem. Soc. 2008, 130, 5428–
5429.
(38) Eres, G.; Rouleau, C. M.; Yoon, M.; Puretzky, A. A.; Jackson, J. J.; Geohegan, D. B.
Model for Self-Assembly of Carbon Nanotubes from Acetylene Based on Real-Time Studies of Vertically Aligned Growth Kinetics. J. Phys. Chem. C 2009, 113, 15484–
15491.
(39) Futaba, D. N.; Hata, K.; Yamada, T.; Mizuno, K.; Yumura, M.; Iijima, S. Kinetics of Water-Assisted Single-Walled Carbon Nanotube Synthesis Revealed by a Time- Evolution Analysis. Phys. Rev. Lett. 2005, 95, 56104.
(40) Liu, B.; Liu, J.; Tu, X.; Zhang, J.; Zheng, M.; Zhou, C. Chirality-Dependent Vapor- Phase Epitaxial Growth and Termination of Single-Wall Carbon Nanotubes. Nano Lett.
2013, 13, 4416–4421.
(41) Zhang, R.; Zhang, Y.; Zhang, Q.; Xie, H.; Qian, W.; Wei, F. Growth of Half-Meter Long Carbon Nanotubes Based on Schulz–Flory Distribution. ACS Nano 2013, 7, 6156–6161.
(42) Stadermann, M.; Sherlock, S. P.; In, J.; Fornasiero, F.; Park, H. G.; Artyukhin, A. B.;
Wang, Y.; De Yoreo, J. J.; Grigoropoulos, C. P.; Bakajin, O.; et al. Mechanism and Kinetics of Growth Termination in Controlled Chemical Vapor Deposition Growth of Multiwall Carbon Nanotube Arrays. Nano Lett. 2009, 9, 738–744.
(43) Yamada, T.; Maigne, A.; Yudasaka, M.; Mizuno, K.; Futaba, D. N.; Yumura, M.;
Iijima, S.; Hata, K. Revealing the Secret of Water-Assisted Carbon Nanotube
26
Synthesis by Microscopic Observation of the Interaction of Water on the Catalysts.
Nano Lett. 2008, 8, 4288–4292.
(44) Yao, Y.; Li, Q.; Zhang, J.; Liu, R.; Jiao, L.; Zhu, Y. T.; Liu, Z. Temperature-Mediated Growth of Single-Walled Carbon-Nanotube Intramolecular Junctions. Nat. Mater.
2007, 6, 293–296.
(45) Wirth, C. T.; Zhang, C.; Zhong, G.; Hofmann, S.; Robertson, J. Diffusion- and Reaction-Limited Growth of Carbon Nanotube Forests. ACS Nano 2009, 3, 3560–
3566.
(46) Zhao, Q.; Xu, Z.; Hu, Y.; Ding, F.; Zhang, J. Chemical Vapor Deposition Synthesis of near-Zigzag Single-Walled Carbon Nanotubes with Stable Tube-Catalyst Interface.
Sci. Adv. 2016, 2, e1501729–e1501729.
(47) Kang, L.; Zhang, S.; Li, Q.; Zhang, J. Growth of Horizontal Semiconducting SWNT Arrays with Density Higher than 100 Tubes/μm Using Ethanol/Methane Chemical Vapor Deposition. J. Am. Chem. Soc. 2016, 138, 6727–6730.
(48) Picher, M.; Anglaret, E.; Jourdain, V. High Temperature Activation and Deactivation of Single-Walled Carbon Nanotube Growth Investigated by in Situ Raman Measurements. Diam. Relat. Mater. 2010, 19, 581–585.
(49) Ouyang, M.; Huang, J. L.; Cheung, C. L.; Lieber, C. M. Atomically Resolved Single- Walled Carbon Nanotube Intramolecular Junctions. Science 2001, 291, 97–100.
ASSOCIATED CONTENT
Supporting Information. Additional discussions are provided about the (1) CVD system, (2) chirality assignment, (3) effects of 13C ethanol on SWCNT growth and (4) Raman spectra (mapping). This material is available free of charge via the Internet at heep://pubs.acs.org.
27 AUTHOR INFORMATION
Corresponding Author
*Authors to whom correspondence should be addressed. E-mail: [email protected] tokyo.ac.jp, [email protected]
ACKNOWLEDGEMENTS
We thank Prof. Yan Li at Peking University for fruitful discussions. Part of this work was financially supported by JSPS KAKENHI Grant Numbers JP15H05760, JP25107002, JP17K06187 and JP17K14601. Part of this work was supported by Laser Alliance, the University of Tokyo. This work was also conducted at the Center for Nano Lithography &
Analysis and the VLSI Design and Education Center (VDEC). K.O. was financially supported by a JSPS Fellowship (JP15J07857).
AUTHOR CONTRIBUTIONS
K.O., S.Y. and S.M. conceived the project and designed the experiments. K.O. and S.Y. set up the CVD system for isotope labeling, synthesized samples and carried out all the measurement. K.O, S.Y., T.I., R.X and S.C. analyzed the data. K.O. and T.I. co-wrote the manuscript. All the authors discussed the results and commented on the manuscript.