In particular, while the dispersion of production at high levels of transportation costs continues to be global (as in core-periphery models), the second phase of dispersion at low levels of transportation costs is much more localized in nature and may be better described as the expansion of existing core areas rather than re-dispersal to marginal areas (Mori [25]). Since the explicit construction of such clusters will have implications for the summary measures to be developed, it is appropriate to outline this construction more explicitly. Individual clusters are implicitly considered to be areas where industry density is unusually high.
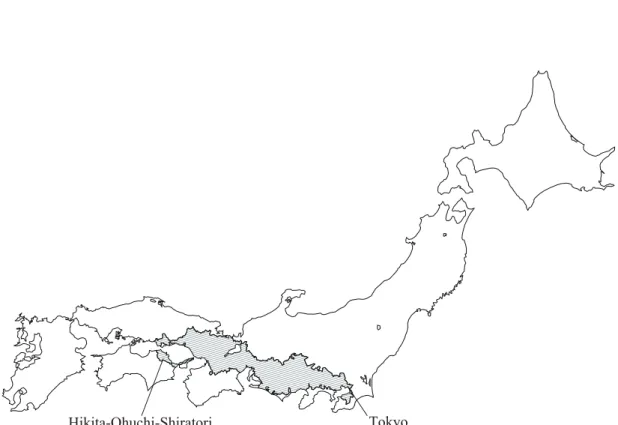
In particular, it is shown in [MS] that for any given cluster scheme, C, the (multinomial) log-likelihood of bpC is given by. It is therefore appropriate to illustrate these results in terms of the “livestock products” industry in Japan, as shown in Figure 4.6 in section 4.3.1 below.
Global Extent and Local Density
In general, Figure 3.2 aims to summarize the main features of this classification system. The opposite extreme of minimal spatial concentration is most naturally characterized by globally dispersed and locally sparse agglomeration patterns such as Figure 3.2(d).19 The two “intermediate” extremes are somewhat more difficult to explain, but do occur (as will be shown in Sections 4.3.2 and 4.3.3 below). In particular, only industries with many establishments may show dense patterns of significant agglomerations in large areas [such as Figure 3.2(b)] and only industries with a small number of establishments may exhibit sparse agglomeration patterns in limited areas [such as Figure 3.2 (c)].
4 Application
Data for Analysis
- Basic Regions
- Economic Area of Regions
- Interregional Distances
- Industry and Establishments Data
First, while we allow enterprises to locate freely within the 3207 municipalities, we do not allow the formation of any cluster including core regions in both Hokkaido and other large islands.21 Second, the electronic constraints for each industry are taken as union of the two. stiffened convex subsets of core clusters inside and outside Hokkaido [see, for example, the cases of “carbonated beverages and sparkling water”, “livestock products”, and “sliding doors and screens”, shown in Figures 4.5(c ), 4.6(c) and 4.7(c), respectively, in section 4.3 below]. Not surprisingly, those SCCS with higher proportions of economic area are concentrated in urban regions. 21 In terms of our definition of neighborhood δ in section 4.2.2 of [MS], the distances between regions of Hokkaido and those of the main islands are implicitly assumed to exceed δ.
In particular, industrial growth in a region may well lead to a gradual increase in the economic space of that region (for example through land filling or deforestation). In Japan, for example, it is doubtful whether mountainous forested areas (which make up 98% of non-economic areas) can be easily made available for industrial establishments in the short term. The travel distance between each pair of neighboring SKCSs is calculated as the length of the shortest route between their municipal offices along the road network.24 From the calculated pairwise distances between adjacent (contiguous) SKCSs, the shortest path distances (and associated ranges of adjacent SKCSs (SKCSs) become calculated in terms of expression (15) in [MS].25 Although there is obviously a certain degree of interdependence between industrial sites and the road network, the spatial structure of this network is mainly determined by topographical factors.
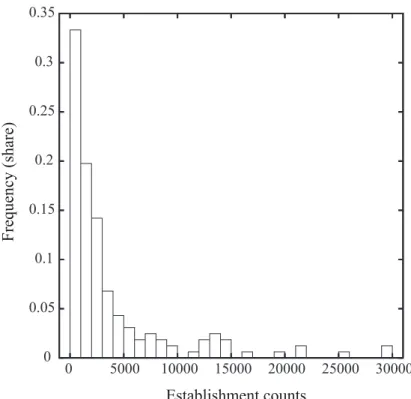
Here, we focus on three-digit manufacturing industries, of which 163 industry types are present in the set of core regions selected for this analysis.26 The number of firms (n) in these 163 industries is taken from the Census of Firms and Enterprises in Japan [20] in 2001, the frequency distribution of these counts is shown in Figure 4.2. 25 As stated in Section 3.1 [MS], shortest path distances are always at least as large as shortest path distances. But in this case, the shortest path distance seems to approximate the shortest path distance quite well.
26 More precisely, out of the 164 industry types in Japan, all but one have an establishment in at least one of our basic regions.
Tests of Spuriousness of Cluster Schemes
Classification of Cluster Patterns
- Globally Dispersed and Locally Sparse Patterns
- Globally Dispersed and Locally Dense Patterns
- Globally Confined and Locally Sparse Patterns
- Globally Confined and Locally Dense Patterns
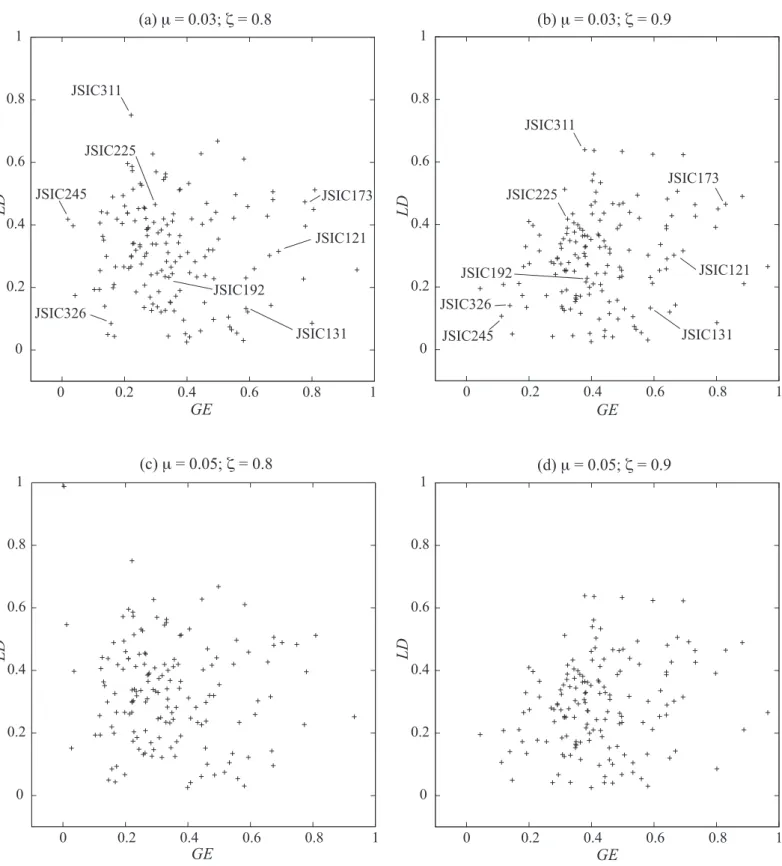
Here we focus mainly on the case of Figure 4.4(a) [µ =0.03 and ζ =0.8] which is seen to exhibit the widest variation of GE and LD values. Industries with relatively high GE values and low LD values [near the southeast corner of Figure 4.4(a)] can be described as exhibiting agglomeration patterns that are both "globally distributed and locally sparse." A clear example is provided by the "soft drinks and sparkling water" industry (JSIC131) shown in Figure 4.5 [with GE=0.589 and LD=0.133]. Industries with high GE and LD values [near the northeast corner of Figure 4.4(a)] can be described as exhibiting "globally dispersed and locally dense" agglomeration patterns. Such industries are by definition present almost everywhere, and can equivalently be described as invisible industries.
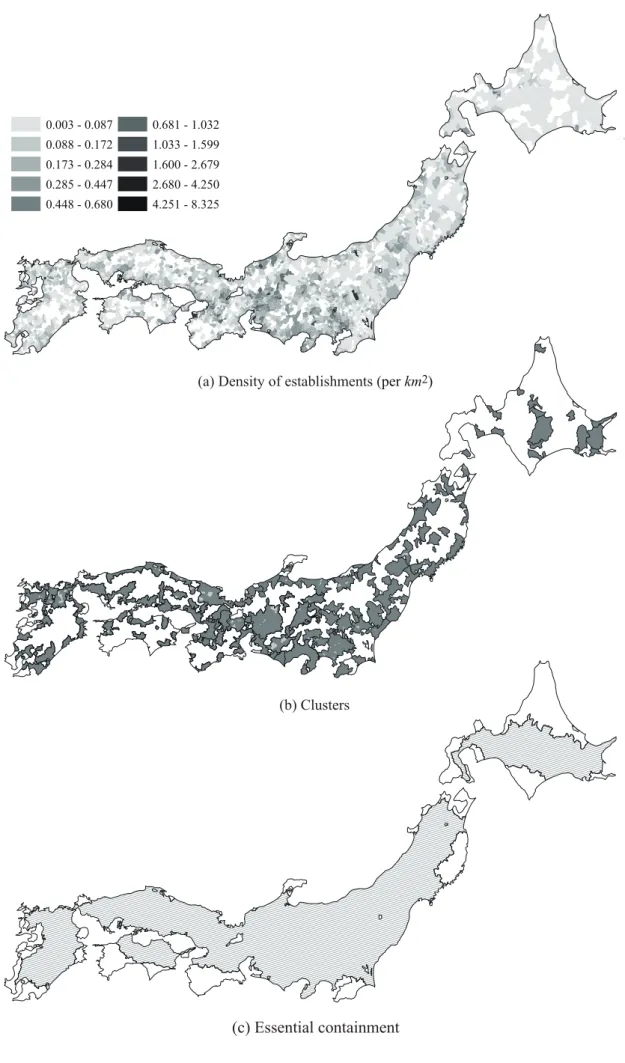
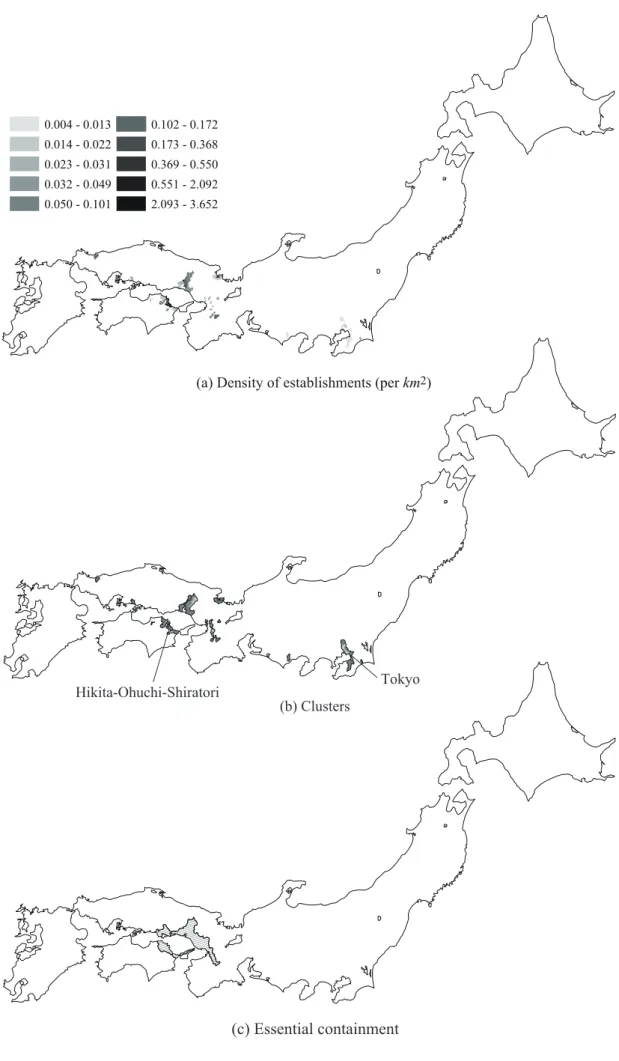
As can be seen in Figure 4.7(a), the companies in this industry are actually found almost everywhere, with clusters densely distributed across the country [Figure 4.7(b)]. The opposite extreme of "globally bounded and locally sparse" agglomeration patterns [in the southwest corner of Figure 4.4(a)] is well illustrated by the "ophthalmic wares". As seen in Figure 4.8(a), this industry has only a small number of firms (mainly located between Tokyo and Osaka), with a disproportionate concentration in the small town of Sabae with a population of 65,000.
As seen in Figure 4.11(b), this pattern is more concentrated towards the Pacific coast between Tokyo and Osaka, with a narrow band extending beyond Osaka and including the major metro areas further west (Kobe, Okayama, Hiroshima and Fukuoka). Finally, as mentioned in Section 3 above, those industries with agglomeration patterns that are both "globally bounded and locally dense" [i.e. in the northwest corner of Figure 4.4(a)] the most spatially concentrated class of industries. Moreover, the chain of connected clusters seen in Figure 4.12(b) essentially fills the gaps between these metro centers, creating the effect of a single "megalopolis". The outputs of JSIC311 provide an important clue as to the nature of this "filling in" process.
It is clear from Figure 4.13(b) that most clusters for this industry also follow the Industrial Belt.33 Furthermore, the outputs of this industry are again mainly intermediate inputs for a variety of manufactured goods, and in particular for motor vehicles (such as the die-cast plastic parts for seats, fenders and instrument panels).
5 Concluding Remarks
Agglomeration Spacing within Industries
Within the new economic geography, many models have been developed to explain the distance between individual agglomerations for a specific industry (e.g. Krugman [22], Fujita and Krugman [8], Fujita and Mori [11], Fujita et al. [10, ch.6 ], Ikeda et al. [17], Akamatsu et al. [1]). From a general equilibrium theory perspective, these models predict whether an agglomeration of industrial firms will be viable in a given location, depending on how other agglomerations of the same industry (as well as population) are distributed across location space. In particular, Fujita and Krugman [8] showed that every agglomeration casts a so-called agglomeration shadow, in which companies have no incentive to move from existing agglomerations.
Because within this "shadow" firms are too close to existing agglomerations (ie, competitors) to realize sufficient local monopoly advantages. Therefore the presence of such shadows serves to limit the number of stable agglomerates within each industry. But while there has been empirical work to study the space between urban centers (such as in Chapter 7 of Marshall [24] and in Ioannides and Overman [18]), there has been to our knowledge no systematic attempt to study the space between industrial agglomerations – and in particular, there is no attempt to identify the presence of actual shadows of the agglomeration.
In particular, since our cluster detection procedure allows the identification of individual agglomerations for each industry, it is easy to construct explicit measures of the distance between them. In the current setting, the most natural measure of the spacing between any pair of clusters, Cj and Ch in a given cluster scheme, C, is the shortest path distance, d(Cj,Ch), between their nearest base regions on a given road network. 35It is interesting to note here that initial investigations of such spacing properties suggest that further restrictions must be imposed.
In particular, for those industries with small e-contents, it is clear that random versions located throughout Japan will necessarily tend to display larger average space for quite false reasons.
Agglomeration Coordination between Industries
More formally, for any pair of industries, i =1, 2, with cluster schemes, Ci = (R0i,C1i, .,CkC . i) satisfying kC1 17] Ikeda, Kiyohiro, Akamatsu, Takashi, Kono, Tatsuhito (2012) “Spatial Period Doobling Agglomeration of a Core-Piphery Model with a System of Cities,” forthcoming in Journal of Economic Dynamics and Control. 2011), "An Industrial Agglomeration Approach to Central Place and City Size Regularities," Journal of Regional Science. A probabilistic modeling approach for detecting industrial agglomerations: Metholodogical framework”, Discussion Paper No. 777, Department of Economic Research, Kyoto University. 2004), "Evidence on the nature and sources of agglomeration economies," in Henderson, J. Vernon and Thisse, Jacques-Franco¸is (eds.), Handbook of Regional and Urban Economics, Vol.4 (Ams-terdam: North-Holland), Ch.49. 31] Statistical Information Institute for Consulting and Analysis (2002), Toukei de Miru Shi-Ku-Cho-Son no Sugata (in Japanese). 32] Statistical Information Institute for Consulting and Analysis (2003), Toukei de Miru Shi-Ku-Cho-Son no Sugata (in Japanese). a) Globally limited and locally dense. Globally distributed and locally sparse pattern: soft drinks and carbonated water (JSIC131) (a) Density of establishments (per km2). Global distributed and local sparse pattern: livestock products (JSIC121) (a) Density of enterprises (per km2). a) Density of enterprises (per km2). Globally limited and locally sparse pattern: ophthalmic goods, including frames (JSIC326) (a) Density of establishments (per km2). c) Necessary containment Tokyo Hikita-Ohuchi-Shiratori. Globally limited and locally scarce pattern: leather gloves and mittens (JSIC245) (a) Density of establishments (per km2). Globally bounded and locally dense pattern: motor vehicles, parts and accessories (JSIC311) (a) Density of establishments (per km2).