Title: A mathematical estimation of cancer incidence using data from population-based cancer registries
Authors:
Ken-ichi Kamo1,2, Satoshi Kaneko1, Kenichi Satoh3,
Hirokazu Yanagihara4, Shoichi Mizuno5 and Tomotaka Sobue1
Affiliations:
1 Statistics and Cancer Control Division, Research Center for Cancer Pre- vention and Screening, National Cancer Center
2 Division of Mathematics, School of Medicine Liberal Arts and Sciences, Sapporo Medical University
3 Department of Environmentrics and Biometrics, Research Institute for Radiation Biology and Medicine, Hiroshima University
4 Department of Social Systems and Management, Graduate School of Sys- tems and Information Engineering, University of Tsukuba
5 Epidemiology and Health Promotion, Tokyo Metropolitan Institute of Gerontology
Corresponding author:
Ken-ichi Kamo
Division of Mathematics, School of Medicine Liberal Arts and Sciences, Sapporo Medical University, S1W16, Chuoku, Sapporo 060-8543, Japan
Phone: +81-11-611-2111 (ext. 2594).
email: [email protected]
Abstract
Accurate cancer incidence data is needed to plan, monitor and evaluate national cancer control programs. In Japan, however, such information is not available due to low reporting rates to cancer registries. In order to have more accurate incidence estimation, we developed a new method. We obtained a nonlinear regression model between observed incidence/mortality (IM) ratios and death certificate notification (DCN) rates in various cancer registries. This model gives us the ”true IM ratio”, which is at zero point of the DCN rate in the regression curve. This is an ideal registration state with- out any missing cases. By multiplying it to cancer mortality number from the National Vital Statistics, corrected cancer incidence can be estimated.
The results of applying this method for Japanese cancer incidence estimation in 1997 were the true IM ratios 2.074 for men and 2.587 for women. Cancer incidences in Japan were estimated to be 346,000 for men and 280,000 for women. This method gives us the best guess regarding the National cancer incidence in a country having several cancer registries with various quali- ties. However, from the viewpoint of cancer control, every registry should establish a system to collect cancer incidence data completely in a region.
Key words
Neoplasms, Cancer, Incidence, Registries, Models(Theoretical)
Introduction
Knowing cancer incidence number is fundamental for planning, monitor- ing and evaluating national and regional cancer control programs, as well as having accurate data on cancer mortality number. In Japan, mortality data can be obtained from the National Vital Statistics, which are summa- rized from death certificates. On the other hand, cancer incidence data are derived only from several prefecture-wide, voluntary-based cancer registries in Japan. The Research Group for Population-Based Cancer Registration has reported national estimates of cancer incidence since 1975 using selected population-based cancer registries [1, 2]. However, the estimation should be subject substantially to underestimation, because the estimation is based on incidence data from registries in which the registration completeness is not adequate level compared with that in cancer registries of U.S. or European countries [3], thought the Group selects that fulfill criteria for completeness.
From the public health and political point of view, accurate estimation on cancer incidence numbers, which include currently undetected cases, need to be presented.
In this paper, we introduced a new method to estimate the cancer in- cidence number using data from several population-based cancer registries with various completeness levels and illustrate an example of the estimate for cancer incidence number of Japan in 1997.
Methods
Cancer incidence in population-based cancer registries is mainly determined by cancer cases reported from hospitals. However, some newly diagnosed cancer cases are not reported from hospitals. Such cases can be detected by their death certificates if the cancer is fatal. On the other hand, if the cancer is not fatal, such cases can not be detected without reporting from hospitals.
Therefore, correction of such undetectable cases is critical to estimate the national cancer incidence number in a country having several population- based cancer registries with various reporting rates from hospital.
In order to simply our methodology explanation, we devided newly diag- nosed cancer cases into four groups according to registration and vital status;
1) those who are already registered and who have died of cancer (a1);
2) those who are already registered and do not belong to a1, namely, individuals who survived or died of other causes (a2);
3) those who are not registered and died of cancer (a3);
4) those who are not registered and do not belong to a3 (a4).
Herein, we defended the cases of a3 as death certificate notification (DCN) cases including follow-back cases, which are triggered by the death certifi- cate and registered cases by tracing back to the hospital regarding cancer diagnoses.
Since thea4 cases are not detectable by the population-based cancer reg- istries and they are not included in the cancer incidence report, the reported number of incidence cases by cancer registries can be expressed asa1+a2+a3. The DCN rate is calculated witha3 as numerator anda1+a2+a3 as denomi- nator, and cancer mortality cases is expressed asa1+a3. Usinga1, a2, a3 and a4, indicators needed for our estimation, i.e., registration rate (r), DCN rate
(x), incidence/mortality (IM) ratio (y), and true IM ratio (K), are expressed (Table 1).
The logic for our method to estimate cancer incidence number is as fol- lows. We calculate an IM ratio (y) and a DCN rate (x) for every registry. If there is methematiocal relation between the DCN rate (x) and the IM ratio (y), the true IM ratio (K) is estimated as the value of the IM ratio at the zero point of DCN rate. Using the K and mortality number, incidence number can be estimated as K(a1 +a3). Thus, a critical step in our method is to obtain the mathematical relation between the IM ratio (y) and the DCN rate (x).
Parkinet al introduced an equation to estimate the registration rate ap- plied in a registry with low DCN rates [4];
r= 1
1 + (y−1)x. (1)
Ajiki et al modified this equation to apply to high DCN rates under the assumption that the ratio of a3 toa4 equals that of a1 toa2 [5]:
r = 1−xy
1−x . (2)
The derivation of equation (1) and (2) is described in Appendix 1 and 2, respectively. Using equation (2) and the indicators in Table 1, the IM ratio
(y) can be expressed as a dependent variable with only one independent variable, the DCN rate (x) as following equation (3). Using the indicators and equations in Table 1, the unknown number a4 is represented as a4 = (K − 1)(a1 +a3) − a2. Then the registration rate (r) can be expressed without a4 as
r= a1+a2+a3
a1+a2+a3+a4 = a1+a2+a3
a1+a2+a3+ (K−1)(a1 +a3)−a2 = y K.
Substituting this relation into equiation (2), we obtain
y= K
1 + (K −1)x. (3)
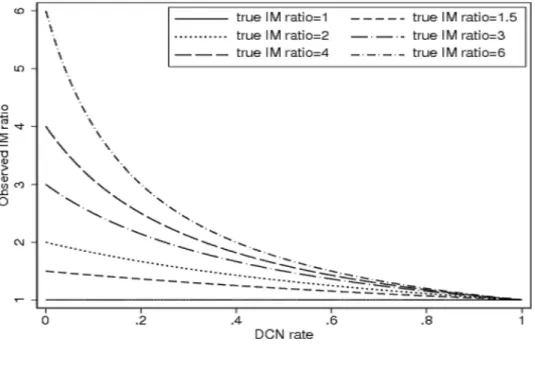
This equation means that the IM ratio (y) is explained by the DCN rate (x) and a constant value, the true IM ratio (K). In other words, the true IM ratio (K) can be detected from nonlinear regression model defined with the observed IM ratios (y) and DCN rates (x) from various population-based cancer registries. The relationships between DCN rates and IM ratios in equation (3) are shown in Figure 1 with various true IM ratios (K).
Under the assumption that the true IM ratio (K) is uniform for every registry within a strata of sex and cancer sites, the observed IM ratio y and the DCN ratexat registryihave the probabilistic relationship from equation
(3) as follow.
E(yi|xi) = K
1 + (K −1)xi, (4)
where E(yi|xi) denotes the conditional expectation of yi under givenxi. We estimate the true IM ratioK using the weighted maximum likelihood method.
The validity of equation (3) and the detail to estimate the true IM ratio are shown in Appendix 3 and 4, respectively.
Results
As an example, we applied our method for estimating cancer incidence number of all sites in Japan in 1997, using mortality, observed incidence, DCN and population numbers from 11 population-based cancer registries in Japan. These registries participate in the Research Group for Population- Based Cancer Registration in Japan. We plotted observed IM ratios and DCN rates of each cancer registry in Figure 2 along with the most suitable regression curve for males and females using the maximum likelihood method, assuming that the random error term is identically independently distributed a normal distribution with mean 0 (see Appendix 4). Using these regression
curves, we estimated the true IM ratios (K) at the zero point of the DCN rate. The true IM ratios were 2.074 for male and 2.587 for female (Table 2). By multiplying the true IM ratios by the cancer mortality numbers of the whole country, we obtained the cancer incidence numbers in Japan in 1997 as about 346,000 for males and 280,000 for females, which numbers were 26% and 37% larger than those of currently reported incidence cases by the Research group for population-based cancer registration, which are used broadly for cancer research and cancer-related policy making [1, 2, 6, 7].
Discussion
With regard to cancer incidence estimation using data from population- based cancer registries with various DCN rates (registration completeness), our method gives us more accurate estimation on cancer incidence in Japan compared with the current estimation method [5, 6, 7]. The current method calculates national cancer incidence using an arithmetic mean of observed incidence rate from selected cancer registries that fulfill the criteria for com- pleteness. The selection criteria is; a death certificate only (DCO) rate of
less than 0.25 or a DCN rate of less than 0.3, along with an observed IM ratio equal to or more than 1.5 for all cancer sites of both sexes. Thus, the selection criteria is not so rigid, that the estimated numbers of cancer inci- dence must be underestimated [8, 9, 10]. Estimation using Poisson regression is used in EU counties [11, 12], but this method can not correct incompletes of registration, either.
On the other hand, our method enables us to estimate cancer incidence compensating imcompleteness of registration. The example results of our method showed 1.26 and 1.37 times larger than currently reported incidences for males and females in 1997 in Japan. The additional new diagnosed cases were about 71,000 males and 76,000 females from the currently published cases of 275,276 males and 203,879 females [6].
Furthermore, characteristic of our method is usage of information from cancer registries with various completeness of registration. As shown Figure 1, registry information are considered together as a whole for a regression model along with regional population weight, which influenced the estimate of national cancer incidence. This can lessen influences of unstability on incidence data from a region with small population. The largest region had about 15 times more residents than a region with the smallest population
size in 11 regions used for our estimate.
Although our method has several demerits for cancer incidence estima- tion, it depends on following assumptions. First assumption is that the true IM ratios be uniform in any regions where a registry exists. It is naturally expected that sex, age and site distribution are not similar for every region.
Additionally there must exists a regional difference of the IM ratio caused by disparities in cancer care quality and early detection rates. Therefore, our model is not appropriate to investigate the regional differences.
Second assumption is that cancer mortality rates among already regis- tered groups be equal to ones not registered; i.e., the ratio a3 to a4 be equal to that of a1 toa2 in Table 1. This assumption is needed to estimate the un- known number a4 from known numbers (a1, a2 and a3) in equation (2). This assumption is not valid when the cancer mortality rate differs between the registered and unregistered groups. If cancer mortality rates of a registered group were higher than those of an unregisterd group, an unknown number a4, or national incidence number would be underestimated.
Thirdly, we implicitly assume that the cancer mortality, incidence and follow-back status in the registries have not changed throughout periods from past to present. This assumption is needed because our method is based on
IM ratios. Mortality cases are the past incident cases, therefore, changing incidence and mortality rates have influence on the IM ratios. Furthermore, since the currently reported incidence consists of regularly reported cases, follow-back cases, and DCO cases which are equally dealt as same incidence cases in a registry, changes in follow-back status has influense on the count of incidence number. As a result, the IM ratios are also affected. Taking this assumption into account, the figures we presented in this paper might still be underestimated because cancer incidence might have been increasing and prognosis of cancer cases might have been improved.
Furthermore, we do not stratify the estimation by age group. Since it is reasonable to expect that the DCN rates and IM ratios differ among age groups, we need to develop a method to estimate cancer incidence stratified by age group.
In conclusion, we presented a new method to compute nation-wide cancer incidence number using the true IM ratio. This method gives us more accu- rate estimation regarding the National cancer incidence in a country having several cancer registries with various qualities; however, from the viewpoint of cancer control, every registry should establish a system to collect cancer incidence data completely in a region.
Acknowledgements
The authors wish special thank to Prof. Megu Ohtaki, Hiroshima Univer- sity, Dr. Wakiko Ajiki and Dr. Hideaki Tsukuma, Osaka Medical Center for Cancer and Cardiovascular Diseases for their valuable advice and en- couragement. We also thank the staffof all the registries participating in the Research Group for Population-Based Cancer Registration in Japan: Miyagi, Yamagata, Niigata, Fukui, Aichi, Shiga, Osaka, Tottori, Saga, Nagasaki and Okinawa prefectures, whose contribution to the collection and processing of data made this publication possible. This work was supported in part by a Grant-in-Aid for Cancer Research for the Ministry of Health, Labor and Wel- fare, Japan (8-2), and the Foundation for the Promotion of Cancer Research for the Third-Term Comprehensive 10-Year Strategy for Cancer Control.
References
1. Research Group for Population-based Cancer Registration in Japan.
Cancer incidence in Japan, 1975 - cancer registry statistics. GANN Monogr Cancer Res 1981; 26: 92-116.
2. Research Group for Population-based Cancer Registration in Japan.
Cancer incidence in Japan, 1985-89: re-estimation based on data from eight population-based cancer registries. Jpn J Clin Oncol 1998; 28: 54- 67.
3. IARC Press, Lyon. Cancer Incidence in Five Continents, Vol. VIII. IARC Scientific Publication 2002; 155.
4. Parkin D, Chen V, Ferlay J, et al. Comparability and quality control in cancer registration. Lyon: IARC Press 1994.
5. Ajiki W, Tsukuma H, Oshima A. Index for evaluating completeness of registration in population-based cancer registries and estimation of reg- istration rate at the Osaka Cancer Registry between 1966 and 1992 using this index. Nippon Koshu Eisei Zasshi 1998; 45: 1011-7 (in Japanese).
6. Research Group for Population-based Cancer Registration in Japan.
Cancer incidence and incidence rates in Japan in 1997: estimates based on data from 12 population-based cancer registries. Jpn J Clin Oncol 2002; 32: 318-22.
7. Research Group for Population-based Cancer Registration in Japan.
Cancer incidence and incidence rates in Japan in 1999: estimates based on data from 11 population-based cancer registries. Jpn J Clin Oncol 2004; 34: 352-6.
8. Kato I, Tominaga S, Ikari A. Estimation of trends in cancer incidence in a population-based cancer registry. Nippon Koshu Eisei Zasshi 1990; 37:
861-6 (in Japanese).
9. Inoue M, Tajima K, Inuzuka K, et al. The estimation of cancer incidence in Aichi Prefecture, Japan: use of degree of completeness of registration.
J Epidemiol 1998; 8: 60-4.
10. Brenner H. Limitations of the death certificate only index as a measure of incompleteness of cancer registration. Br J Cancer 1995; 72: 506-10.
11. Black RJ, Bray F, Ferlay J, et al. Cancer incidence and mortality in the European Union: cancer registry data and estimates of national incidence for 1990. Eur J Cancer 1997; 33: 1075-107.
12. Jensen OM, Esteve J, Moller H, et al. Cancer in the European Commu- nity and its member states. Eur J Cancer 1990; 26: 1167-256.
13. Seber GAF, Wild CJ. Nonlinear regression. Wiley series in probability and statistics 1998.
Appendix 1: The derivation of Parkin’s equation (1)
We assume that the ratio of a3 to a4 equals to that of a1 toa2, i.e.,
a4 = a2a3 a1
.
Then the registration rate r can be denoted using the DCN rate x and IM ratio y by
r = a1+a2+a3 a1+a2+a3+a4
= a1+a2+a3 a1+a2+a3+ (a2a3)/a1
= 1
1 + (a2/a1){a3/(a1+a2+a3)} = 1 1 + (a2/a1)x
= 1
1−x+{(a1 +a2)/a1}x. (5)
If the DCN rate x is quite low, then we can approximate (a1+a2)/a1 by IM ratio y= (a1+a2+a3)/(a1+a3). Hence we obtain equation (1).
Appendix 2: The derivation of Ajiki’s equation (2)
Parkin’s equation (1) needs the assumption that the DCN rate is quite low.
On the other hand, Ajikiet altried to express the resistration raterby DCN ratexand IM ratioywithout this assumption. They noted that the IM ratio which does not include DCN case, that is (a1+a2)/a1, can be written as
a1+a2
a1 = a1+a2+a3−a3 a1+a3−a3
= 1−a3/(a1+a2+a3)
(a1 +a3)/(a1+a2+a3)−a3/(a1+a2+a3) = 1−x (1/y)−x. Substituting this relationship into (5), we immediately obtain equation (2).
Appendix 3: The validity of equation (3)
First, we note the fact that if all the incidence cases are detected as DCN cases, then the incidence number is equivalent to the mortality number, i.e., the IM ratio is equal to 1. Hence, the regression curve must pass through the
note that for all K >1 equation (3) satisfies this (Figure 1).
Next, we consider the situation when the undetected cases occur one after another in a complete registry. Suppose the registration in a given region is complete; that is, the DCN (or DCO) rate (x) is equal to zero, the relationship between incidence number (I) and IM ratio (K), a1, a2, a3 and a4can be expressed asa1 =I/K,a2 =I(K−1)/Kanda3 =a4 = 0. If newly diagnosed cancer cases numbering A are not reported to the registry, these relationships would become as follows: a1 = (I −A)/K, a2 = (I −K)(K− 1)/K,a3 =A/Kanda4 =A(K−1)/K. Then the observed incidence number isa1+a2+a3 = [(I−A)(K−1) +I]/K. Since the observed mortality, which is I/K, is invariable, the expected values of the IM ratio (y) and DCN rate (x) are
y= KI −A(K−1)
I and x= A
KI−A(K−1),
respectively. After a simple calculation, we see that these satisfy equation (3). This implies that whether undetected cases increase or not, the IM ratio - DCN rate plots lie on the line of equation (3).
Appendix 4: The estimate of the true IM ratio and its confidence
interval
For areai, letxiandyi be the observed DCN rate and IM ratio, respectively.
Since yi ∈(1,∞), we consider the next model that is equivalent to (4):
˜ yi = log
µ K
1 + (K−1)xi −1
¶ +εi,
where ˜yi = log(yi −1), and the random error term εi is assumed identically independently distributed according to a normal distribution with mean 0 and variance σ2. Noting that K > 1, we transform K to 1 + exp(θ), where θ is a real number. Substituting this into above equation yields
˜ yi = log
µ1−xi eθ +xi
¶ +εi.
Let the population weight bewi (satisfying PN
i=1wi = 1, where N is the number of area), wi proportional to the population size of area i, and the expected value of ˜yi be µi. Then the logarithmic likelihood function ` with population weight is
`(K,σ2) =−1 2
"
log(2πσ2) + 1 σ2
XN
i=1
wi(˜yi −µi)2
# .
We will estimate ˆK = 1 + exp(ˆθ) and ˆσ2, the estimators of K and σ2, a
The confidence interval of parameter K is obtained from the assumption that √
N(ˆθ−θ) is asymptotically distributed according to a normal distri- bution with mean 0 and variance τ σ2 [13], where
τ =τ(θ) = NPN i=1
w2i (1+xiexp(θ))2
hPN i=1
wi (1+xiexp(θ))2
i2.
HenceK−1 is asymptotically distributed to a log-normal distribution. Let ˆτ be a plug-in estimator of τ which is ˆτ =τ(ˆθ). We obtain the asymptotically 1−α confidence interval of K as
1 + exp
"
θˆ−zα/2σˆ rτˆ
N −τˆσˆ2 2N
#
≤K ≤1 + exp
"
θˆ+zα/2σˆ rτˆ
N −τˆσˆ2 2N
# ,
where zα is an upper α×100 percentage point of the standard normal dis- tribution.
Table 1.
Indicators needed for estimation of the true Incidence/Mortality (IM) ratios from the various cancer registry data
Registration rate (r) (a1+a2+a3)/(a1+a2+a3+a4) DCN rate (x) a3/(a1+a2+a3)
IM ratio (y) (a1+a2+a3)/(a1+a3) True IM ratio (K) (a1+a2+a3+a4)/(a1+a3) a1 : already registered and died of cancer,
a2 : registered and not a1,
a3 : not registered and died of cancer, a4 : not registered and not a3 (unknown),
Registration rate : proportion of observed incidence to true incidence, DCN rate : proportion of DCN cases to observed incidence,
IM ratio : a ratio of observed incidence to mortality, True IM ratio : IM ratio under complete registration.
Table 2.
Estimated true incidence/mortality (IM) ratio and incidence number for all cancer sites in Japan, 1997
True 95% Estimated 95% Currently
IM confidence incidence confidence reported (a)/(b)
ratio interval (a) interval incidence (b)
Male 2.074 (1.96, 2.20) 346516 (327469, 367568) 275276 1.26 Female 2.587 (2.28, 2.94) 280268 (247008, 318511) 203879 1.37 Currently reported incidence is estimated by Reserch Group for
Population-Based Cancer Registration.
Figure legends
Figure 1. Examples of the relationship between DCN rates and inci- dence/mortality (IM) ratios with different true IM ratios (1, 1.2, 1.6, 2, 3, 4 and 6).
Figure 2. Regression curves for the estimate of the true incidence/mortality (IM) ratios for all cancer sites. The size of the plot is proportional to the population size covered by the registries. The line denotes the regression curve.
Figure 1
Figure 2