A Study on Evoked Potential by Inaudible Auditory
Stimulation toward Continuous Biometric
Authentication
Takehiro Maruoka, Kenta Kambe, Hideki Harada, and Isao Nakanishi
Graduate School of Engineering, Tottori University4-101 Koyama-Minami, Tottori 680-8552, Japan Email: [email protected]
Abstract—Biometrics have been used in person authentication.
However, conventional biometrics have a vulnerability to the identity theft, especially in user management systems. In order to prevent the identity theft, the effective way is to authenticate continuously. However, the continuous authentication requires unconscious biometrics. The authors have been studied to use brain waves as the unconscious biometrics. In conventional studies, the authors had used spontaneous brain waves; however, their verification performance was not so high. Thus, the authors propose to use evoked potentials by supersonic sounds, which cannot be perceived by human beings. In this paper, the authors examine the characteristics of evoked potentials by supersonic sounds and confirm that the spectrum in the α band is increased at the electrodes on the back of the head. This phenomenon could be used as an individual feature in person verification.
I. INTRODUCTION
Biometrics have been studied as a means of person au-thentication [1] and conventional biometrics assume to be used in one-time-only authentication. However, especially in the user management of systems, the conventional biometrics have a vulnerability that even unregistered users can use the systems after logging in the systems by registered users using the biometrics. In order to prevent such an identity theft (spoofing), the effective way is to introduce the continuous authentication into the user management. However, in the continuous authentication, biometrics should be presented un-consciously. The authors are trying to use brain waves for the continuous authentication [2]. Brain waves are spontaneously generated from the brain; therefore, it is possible to provide biometric data unconsciously.
Furthermore, biometric data which are surfaced on the body can be easily stolen by others; therefore, imitations produced by using the stolen biometric data could be used in authentication. Brain waves are detectable only when users wear a brain-wave sensor; therefore, it is not possible to steal the data unknowingly by others. Brain waves have a tolerability to the theft of biometric data. In addition, brain waves as biometrics have the highest acceptability since all human beings have the brain waves.
However, in our conventional studies, the verification per-formance only using spontaneous brain waves was not so high enough [2]. It is expected to use evoked potentials by some stimulation in order to improve the verification
performance. However, the conscious presentation of stimuli to users disturbs their use of systems. Thus, the authors propose to use evoked potentials by inaudible auditory stimuli, that is, supersonic sounds, which cannot be perceived by human beings. In the following sections, the characteristics of evoked potentials by supersonic sounds are examined.
II. EVOKEDPOTENTIALS BYINAUDIBLEAUDITORY STIMULATION
The audible frequency range of human beings is generally from 20 Hz to 20 kHz and the sounds beyond 20 kHz are inaudible and called supersonic. There is a phenomenon that the brains of human beings are activated when audible sounds including supersonic sounds are presented to them [3]. This phenomenon is called ”hypersonic effect”. The obtained knowledge are as follows;
• the spectrum in the α band is increased after 20-30 seconds from the beginning of stimulus presentation, • this phenomenon continues for approximately 60 seconds
after the end of stimulus presentation,
• this phenomenon is yielded by presenting sounds to human beings’ body surfaces by speakers; therefore, it is not yielded when using headphones or earphones, • more complicated sound sources make it easy to cause
this phenomenon,
• this phenomenon is yielded when both audible and in-audible sounds are presented.
On the other hand, there is an opposite knowledge that the hypersonic effect is yielded only by the supersonic sound in Ref. [4]. Therefore, it is important to examine whether the hypersonic effect is yielded or not only by supersonic sounds. If the supersonic sounds do not affect the brain and/or nervous activities, it becomes impossible to authenticate individuals using evoked brain-waves by inaudible auditory stimulation.
III. MEASUREMENT OFBRAIN WAVES
The purpose of this paper is to examine whether the hyper-sonic effect is yielded or not only by superhyper-sonic sounds. In this section, brain waves evoked by inaudible auditory sounds are measured in experiments and then their characteristics are examined.
Fig. 1. The cycle of stimulus presentation.
Fig. 2. The experimental environment.
A. Auditory Stimulation
As auditory stimuli, high-resolution sound sources which contain supersonic elements were used. The authors prepared four high-resolution sounds: three were symphony sounds and one was a coastal environmental sound. In particular, it is known that the latter has a relaxing effect. From these sounds, the authors extracted three auditory stimuli for 240 seconds. One was a sound that contains both audible and inaudible elements, which was directly made by truncating a high-resolution sound. This is represented as ”BOT” for convenience in the following. Another one was a supersonic sound, which was made by filtering supersonic elements (over 20 kHz) from a high-resolution sound. This was used as an inaudible auditory stimulation and is represented as ”SUP”. The last one was the audible sound, which was made by filtering the audible elements (less than 20 kHz) from a high-resolution sound. This is represented as ”AUD”.
These sounds were presented to experimental subjects in the manner shown in Fig. 1. One cycle time was twenty minutes. At the begging of each cycle, a silent condition for 120 seconds was set in order to measure brain waves in the resting state. Silent conditions for 120 seconds were inserted between the stimulus presentations. As mentioned in Sect. II, this is to reduce influences by previously presented stimuli.
B. Experimental Conditions
The authors experimented in an ordinary room shown in Fig. 2 and kept it as silent as possible. The level of a background noise was 37.5 dB. The number of experimental subjects was five. All were healthy male adults, have no hearing defect, and slept regular hours. During the measurement of brain waves, they sit on a chair and required to close their eyes and to be relaxed without moving their bodies. The distance between a speaker and the subjects was two meter, and height of a super-tweeter of the speaker was adjusted to that of subjects’ ears. The sound level was adjusted to approximately 70 dB in the case of BOT.
The authors used a brain-wave sensor by Emotive Cop. shown in Fig. 3, which has fourteen electrodes as shown in Fig. 4. Brain waves (EEGs) were measured from the subjects for the duration of stimulus presentation and digitized to sampled data at 124 kHz.
Fig. 3. The brain-wave sensor.
Fig. 4. Electrode position of the brain-wave sensor.
IV. PROCESSING OFBRAINWAVES
Our measuring system was not dedicated; therefore, the brain-wave measurement was not synchronized with the stim-ulus presentation. Therefore, quasi-synchronization of the brain-wave measurement with the stimulus presentation was achieved as follows. The stimulus (sound) presentation was controlled by a music-player software and playing time was displayed in a window of the software. On the other hand, the brain-wave measurement was controlled by a software for the brain-wave sensor, which is produced by Emotive Cop. and acquisition time was displayed in a window of the control software. Since both softwares were installed in the same computer, the playing time and the acquisition time were simultaneously watched in the same display. Considering the difference of these times, the authors could roughly achieve the synchronization of the brain-wave measurement with the stimulus presentation.
In each EEG synchronized to the stimulus presentation, the mean value was calculated and then subtracted from each element of the EEG data. By using this processing, a DC element was removed from each EEG.
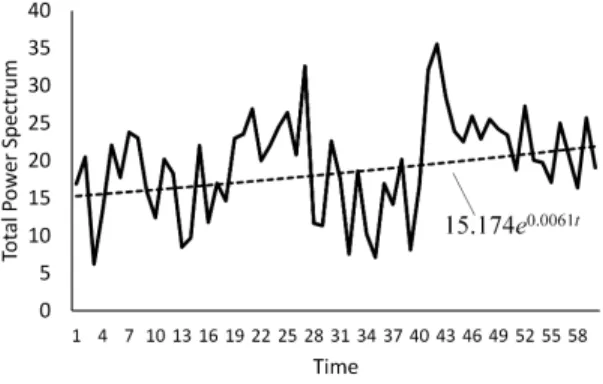
Fig. 5. The variation of EEG power-spectra obtained from a subject.
The sampled data for two seconds in each EEG was processed by the FFT with the Hamming window to obtain the power-spectrum. This process was repeated with a time shift of one second. As a result, a power-spectrum for two seconds was obtained after every one second.
V. ANALYSIS OFBRAINWAVES
In this paper, the authors analyze brain waves measured at electrodes: o1 and o2 in Fig. 4. In order to examine the effect of auditory stimulation on brain waves, the authors plotted the variation of EEG power-spectra obtained from each subject. An example of the variation of power-spectra is shown in Fig. 5. In this experiment, the subjects were required to close their eyes but their eye movements were never blocked. Noises by the eye movements might be included in EEG spectra. Thus, the authors propose to approximate the variation by an exponential function: A expBt, where A and B are constant. The approximated function (a curve) is shown as a dashed line in Fig. 5. Next, the absolute value of the exponential term: B is compared with a threshold. If the value is larger than the threshold, the power-spectrum is regarded as increasing or decreasing. In addition, when the sign of B was positive, the power-spectrum is regarded as increasing. The negative sign means that the power-spectrum is decreasing. If the absolute value is smaller than the threshold, the power-spectrum is regarded as unchanged. In this experiment, the authors empirically set the threshold value.
Dividing the frequency band into α1 (8-10 Hz), α2 (11-13 Hz), β1 (14-22 Hz) and β2 (23-30 Hz), the above ap-proximation was performed in each EEG, and the number of ”Increasing”, ”Decreasing” or ”Unchanged” was counted. The total numbers of three cases are illustrated in Figs. 6 for BOT, 7 for AUD, and 8 for SUP. Comparing these results, there is a tendency that the power spectrum was increased when only the supersonic sound was presented to the subjects.
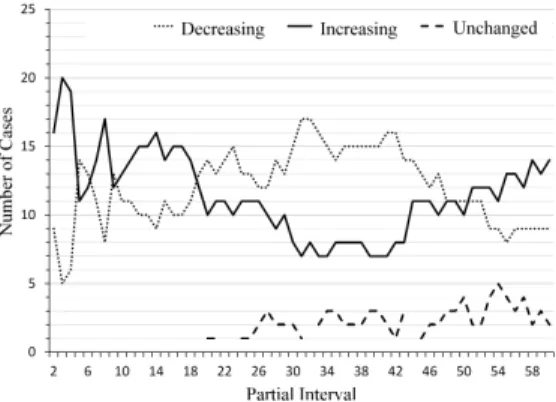
Next, in order to investigate when such a tendency is yielded, the authors examined the variation of increase or decrease of the power spectrum in the α band at the electrode position: o1. By applying the above exponential curve fitting to partial intervals, the authors obtained the ”Increasing”, ”Decreasing” and ”Unchanged” in the partial intervals. At the
Fig. 6. Increase and decrease of the power-spectrum in the case of BOT.
Fig. 7. Increase and decrease of the power-spectrum in the case of AUD.
Fig. 8. Increase and decrease of the power-spectrum in the case of SUP.
beginning, the fitting was applied to the data for the first one second. After that, the interval was gradually increased by one second and then analyzed up to sixty seconds.
Figures 9-11 show the variations in the case of BOT, AUD, and SUP, respectively. It is clear that in the case of SUP, the number of ”Increasing” cases is greatly increased at approximately 20 seconds after stimulus presentation while there is no difference between the numbers of ”Increasing” and ”Decreasing” for 20 seconds after stimulus presentation. This phenomenon is agreed with the knowledge of ”hypersonic effect” [3].
On the other hand, such a phenomenon is not yielded in the cases of BOT. In our experiment, the sound pressure level of the audible sounds was bigger by approximately 20 dB than the supersonic sounds. Therefore, the effect of the supersonic sounds might be buried by the audible sounds in the case of BOT.
At any hand, it is confirmed that the hypersonic effect could be caused only by supersonic sounds (inaudible auditory stimuli). It can be expected to realize continuous authentication using evoked potential by inaudible auditory stimulation.
VI. CONCLUSIONS
In this paper, the characteristics of evoked potentials by su-personic sounds was examined. In particular, it was important to examine whether the hypersonic effect was yielded or not only by presenting supersonic sounds to human beings. For
Fig. 9. The variation of increase and decrease of the ponr-spectrum in the case of BOT.
Fig. 10. The variation of increase and decrease of the power-spectrum in the case of AUD.
Fig. 11. The variation of increase and decrease of the power-spectrum in the case of SUP.
doing that, audible and inaudible sounds were prepared using high-resolution sounds and presented to experimental subjects. By measuring their brain waves during stimulus presentation and analyzing the spectra, it was found that the hypersonic effect could be caused only by presenting supersonic sounds. In the future, the phenomenon obtained in this paper could be apply to individual features in person verification.
Furthermore, the addition of individualities to inaudible
au-ditory stimulation should be examined. There is no knowledge that the brain waves evoked by supersonic sounds are superior for person verification to spontaneous brain waves. On the other hand, there is knowledge that the spectrum in the β band was increased when sounds with favorite tempos were presented [5]. Moreover, there is another knowledge that when human beings were called by familiar people, their spectra in the α band were increased and their increased amounts were larger than those when human beings are called by unfamiliar people [6]. From this knowledge, the use of stimuli that link to individuals is expected to give rise to different phenomena in brain waves and might improve the verification performance. The authors are now considering favorite or memoried songs as stimuli linked to individuals and planning to present supersonic sounds in those songs as inaudible auditory stimuli to experimental subjects and measure their brain waves.
ACKNOWLEDGMENT
This work was supported by KAKENHI (15K00184) in Japan.
REFERENCES
[1] A. Jain, R. Bolle and S. Pankanti, BIOMETRICS Personal Identification in Networked Society, Kluwer Academic Publishers, Massachusetts, USA, 1999.
[2] I. Nakanishi and T. Yoshikawa, ”Brain Waves as Unconscious Biometrics towards Continuous Authentication - The Effects of Introducing PCA into Feature Extraction -,” Proc. of 2015 IEEE International Symposium on In-telligent Signal Processing and Communication Systems (ISPACS2015), pp. 422-425, Nov. 2015.
[3] T. Oohashi, E. Nishina, M. Honda, Y. Yonekura, Y. Fuwamoto, N. Kawai, T. Maekawa, S. Nakamura, H. Hukuyama, and H. Shibasaki, ”Inaudible High-Frequency Sounds Affect Brain Activity: Hypersonic Effect”, Journal of Neurophysiology, Vol. 83, No. 6, 2000.
[4] Y. Suo, K. Ishibashi, and S. Watanuki, ”Effects of Inaudible High-Frequency Sounds on Spontaneous Electroencephalogram (in Japanese)”, Japanese Journal of Physiological Anthropology, Vol. 9, No. 4, pp. 27-31, 2004.
[5] A. K. R. Bauer, Kreutz and C. S. Herrmann, ”Individual Musical Tempo Preference Correlates with EEG Beta Rhythm”, Psychophysiology, Vol. 52, No. 4, pp. 600-604, 2015.
[6] R. D. Giudice, J. Lechinger, M. Wislowska, D. P. J. Heib, K. Hoedlmoser, and M. Schabus, ”Oscillatory Brain Responses to Own Names Uttered by Unfamiliar and Familiar Voices”, Brain Research, Vol. 1591, pp. 63-73, 2014.