J. Operations Research Soc. of Japan Vol. 15. No. 1. March 1972.
A DETERMINISTIC INPUT-OUTPUT MODEL
TO FACILITATE MANAGEMENT OF
A HOSPITAL SYSTEM*
MANOHAR D. NAST A, JOHN KEITH BEDDOW University of Iowa. Iowa City, Iowa
and ROBERT A. SHAPIRO University of Oklahoma, Norman
(Received July 12, 1971)
Abstract
In a period of inflation, the cost of hospital services is rising more rapidly than costs in other areas of the economy. It has been estimated that by 1975, hospital costs will consume almost 7 1/2-8% of the American gross national product. In this situation it is imperative that hospital administrations are able to function with maximum effective-ness. In order to be able to do this, administrations need all the help and assistance which they can get. And in this regard, the techniques of operations research are of primary importance. Prior to this time input-output analysis has been restricted to dealing with national economic problems. This paper deals with a new application of the technique of input-output analysis to the operation of
a
hospital-health services system.In this paper a general mathematical model for a hospital system is • This research was supported by the National Center for Health Services Research and Development Grant CH-00273 and Junior Faculty Seed Grant J -594 from the Biomedical Engineering Program supported by PHS.
19
20 Manohar D. Nasta, John Keith Beddow and Robert A. Shapiro
developed and its use is illustrated with the help of a numerical example. This paper is organized into five sections; Section 2 gives the assumptions and the nomenclature used in the development of the model; Section 3 gives the derivation of the general mathematical model; Section 4 presents numerical examples to illustrate the use of the model; Section 5 gives the conclusions and the summary of this paper.
1. Introduction
In a period of inflation. the cost of hospital services is rising more rapidly than costs in other areas of the economy. It has been estimated that by 1975, hospital costs will consume almost 7 1/2--8% of the American gross national product [5]. In this situation it is imperative that hospital administrations are able to function with maximum effectiveness. In order to be able to do this, administra-tions need all the help and assistanGe which they can get. And in this regard, the techniques of operations research are of primary importance. Prior to this time input-output analysis has been restricted to dealing with national economic problems. This paper deals with a new applica-tion of the technique of input-output analysis to the operaapplica-tion of a hospital-health services system.
The technique of input-output analysis has some special features which make it of the utmost utility in its application to a hospital-health services system.
In this paper a general mathematical model for a hospital system is developed and its use is illustrated with the help of a numerical example.
This paper is organized into five sections; Section 2 gives the assumptions and the nomenclature used in the development of the model; Section 3 gives the derivation of the general mathematical model; Section 4 presents numerical examples to illustrate the use of the model; Section 5 gives the conclusions and the summary of this paper.
A Determini8tic I/O Model of a H08pital Sy8tem
2. Assumptions and Nomenclature
The basic assumptions of the model are the following:
21
1. The elements of the flow matrix are known and constant. This means that they do not vary over the period of analysis.
2. The unit of measurement o:f the various inputs and the sectional outputs can be different.
3. Interdependence of various activities is allowed.
4. The input proportions within an activity need not be fixed for (a) intersectional flows (b) basic inputs.
5. New innovations and ideas are allowed. 6. Production functions can be nonlinear.
The symbols used in this paper including those referred to in the tables are defined as follows:
N =the number of sections into which the services offered by the hospital-health services system are classified.
X =the (N X 1) vector which represents the outputs of the different sections of the system.
Y =the (N X 1) vector which represents the outputs delivered outside the system in order to satisfy the demand upon the system by the community which it serves.
X;=total output of section j.
Y,=output delivered outside the system by the ith section. x'j=amount of output of section i absorbed by section j.
B=the (h X 1) vector which represents the total basic inputs to the system.
b
'm
= amount of basic input of type 1 used by section m. B,=total amount of basic input of type 1.3. Formulation and Application of the General Model
The formulation of the general deterministic model is organized in the following manner:
22 Manohar D. Nasta, John Keith Beddow and Bobert A. Shapiro
2. Construct the equations for the flow of activities in the different sections and present them in the form of an input-output table. 3. Construct the equations involving the interdependence coefficients.
4. Express the total output vector in terms of the final demand vector.
5. Express the total basic input vector in terms of the total output vector.
6. Illustrate the use of the model. These steps are discussed in turn below:
1. Choosing measures of effectiveness for the model to be constructed consists essentially of choosing the units of measurement for the inputs and the outputs of the different sections of the hospital system.
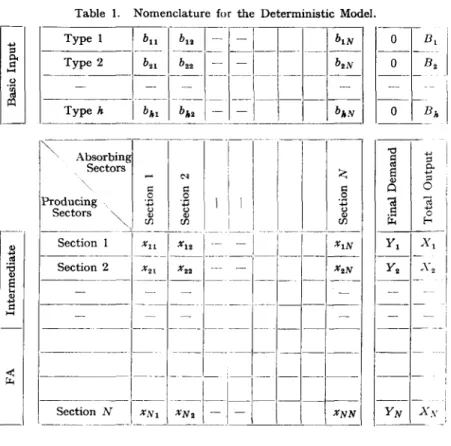
2. An input-output flow table (shown in Table 1) summarizes the observed relationships between the inputs and outputs associated with the set of activities comprising the hypothetical hospital-health services system. These activities are divided into two classes. One class consists of intermediate activities which are produced and used within the hospital but are not directly demanded by the community; rather they are used as inputs by other intermediate activities and by final activities. The other class consists of final activities or services which are those directly demanded and used by the community.
The sections of the system are listed in two ways in the table; in a row of sections (numbered 1 to N) which produce services and in a column of sections (numbered 1 to N) which absorb services.
By referring to the input-output flow table and making use of the property
N
:E
x.;+
Y,=
X, for i=
1, ... , Nj - l
we can develop the following equation
....
::s p.. I:l ...'"
.~ >Q where, whereA Determini.tic I/O Model of a Ho.pital Sy.tem
Table I. Nomenclature for the Deterministic Model.
Type 1
'n
I-'"rl--~- ~~~~-- ~- -Type 2 b. t boo ----=::-r-=-I-=-
--~I--~--~-~
----
~
--
-1---Type h I blot b". - -" Producing Sectors --- ~-Xi;aii=-X-:
for all i'*
jJ
=
1- xiL Xi for all i=
j btN b.N ~-b"N 0 El - - ---0 B. ~ -0 Eh ~~--23 I I I I24 Manohar D. Na.ta, John Keith Beddow and Robert A. Shapiro
Similarly it can be shown that the equation for basic inputs is
(3.2) CX = B
where the matrix
where
I
C~l C12 C= . C'll C"2b,,,.
c,,,.=--X". and the matrix
B"
l= 1, ... ,h; m= 1, ... ,N
The use of the equations (3.1) and (3.2) is illustrated by applying them to the data collected from Shoitz Memorial Hospital, Waterloo, Iowa.
4. Numerical Example
The appropriate starting point in the application of input-output analysis is to quantify the elements of flow Table 2. This table, which represents Shoitz Memorial Hospital, contains the sum total of all activities which comprise the system. The main components of Table 2 consist of:
a. Basic inputs: The whole system, consisting of 17 sections described above, uses the basic inputs which can include the following:
Supplies Labor
A Deterministic 1/0 Model of a Hospital System 25
Table 2. Given Flow Matrix.
Basic Inputs 1 2 3 4 5
--~--
~---1 Supplies 47,048 38,137 105,956 14,059 17,155
2 Labor 221,887 167,796 18,274 18,356 0 3 Plant & Equipment 14,123 19,037 844 767 0
-
---~ Intermediate Activities - ---~ 1 Laboratory 0 0 0 0 0 2 X-ray 0 0 0 0 0 3 Pharmacy 0 0 0 10,512 0 4 Inhalation Therapy 0 0 0 0 0 5 Anesthesiology 0 6 Physical Therapy 0 I 7 Administration 17,191 8 Plant 10,701 I 9 Laundry & Linen 102 I 10 Housekeeping 3,594 I 11 Dietary ~3,528I
- ---~ Final Demands 0 0 0 0 0 0 0 0 10,525 I 2,807 3,859 0 5,707 1,239 1,051 0 1,026 0 112 0 2,763 271I
271 0 2,193 572 763 0 - - -----I
- - -~---12 Medical Records 0 0 0 0 0 13 Surgery 0 0 0 0 0 14 Medical 0 0 0 0 0 15 Pediatrics 0 0 0 0 0 16 Obstetrics 0 17 Extended Therapy 0 -~---0 I 0 0 0 0 0 0 I 0These basic inputs are used by the intennediate and final activities in the manner shown in Table 2.
b. Intermediate activities: Sections 1 through 11 shown in Table 2 are activities produced and used within the hospital, which are not directly demanded by the community. These activities are:
Laboratory Physical Therapy
X-ray Administration
Phannacy Plant
Inhalation Therapy Laundry & Linen
Anesthesiology Housekeeping
26 M anohar D. Nasta, John Keith Beddow and Robert A. Shapiro Table 2. Continued.
-I
- 6 --- 7 -~-! ~8-·-1-- ~l--I--I0----1J 12 11" ';,.~~ ··-52,62;-1 87,-;-7;-r-;,7; i-21,3~ 1175,159 3,354 2 ! 68,961 238,411 1 62,807 I 59,518 i 133,278 1 204,008 36,521 __ 4, 645 23, ""-!_11'
456 I 8, 390 1 __ ' : 167 , 26, 061 ',004 _o
o· ---;;-
I .----~1--;;--
-~o~---;-I
lJ
~j L~11JI~J ~J ~J
10 2,686 0 0 i 0 0 11,691 444;;
~"ft_~n;_~I'81~ I_~~
!-
7'~_ll'~l'81;
15 0 0 0 I 0 0 0 0 16 0 0 0 0 0 0 0 17 0 0 0 0 0 0 0 -- -."----~--.-c. Final activities: Sections 12 through 17 in Table 2 are activities demanded directly by the community and they are therefore defined as final activities.
These are: Medical Records Surgery Medical Pediatrics Obstetrics Extended Therapy
A Deterministic I/O Model o( a Hospital System Table 2. Continued.
-r
13 1 49,968 2 457,383 3 19,262 - -- -- -I 147,789 2 122,999 3 108,270 4 0 5 43,396 6 151,310 7 62,155 8 38,055 9 34,892 10 58,883 11 131,098 12 15,900 13 0 14 0 15 0 16 0 17 0 14 17,486 308,423 17,852 .. _ _ _ _ -159,448 132,699 116,718 75,899 5,221 0 57,638 26,696 23,657 45,711 116,841 17,146 oo
o
o o 15 3,909 41,263 3,697 --~-0 0 0 0 0 0 11,744 8,651 11,418 10,810 24,692 3,240o
o
o o o 16 2,755 135,304 7,831 -350,662 29,679 22:,217 0 0 0 13,913 16,203 14,358 27,744 70,465 3,838 o o oo
o
17I
Demand* FinalI
9,167 89,768 8,016 0 0 65,713 0 0 0 35,233 31,896 6,858 28,366 85,536 9,720 0 27,490 0 25,493 0 6,148 0 5,264 0 15,461 - - - _ . 27 Total Output 391,795 353,624 226,013 75,899 48,607 151,310 304,654 159,520 86,202 147,785 473,958 49,844 27,490 25,493 6,148 5,264 15,461 * All figures in the table are dollar values except the final demand. Theseare patient day figures. They are easily converted to dollar values by multiplying by the daily hospital room rate.
the final demand by the community upon the hospital system. These final demands constitute the total outflow of work from the hospital to the community. The numbers in the final demand column are the patient days. They can be easily converted to dollar values by multiplying by the daily hospital room rate. e. Total outputs: The last column of the table lists the total flows
or outputs of each section of the hospital. These are called the total outputs.
28 Manohar D. NaBta, John Keith Beddow and Robert A. Shapiro
Explanation of Table 2: The figure:> in this table represent the interactions between the various sections of the hospital. The table should be interpreted in the following way: Consider for example, the Administration which has a total output of 304,654, dollars per year. The Administration does not supply a service which is directly used by the community and therefore the final demand for this section is zero cost units. However, many sections of the hospital require the services of the Administration, for example; as shown in Table 2, Dietary takes 8,773 dollars of these services per year. These services plus all those being used by the other sections add up to 304,654 dollars per year which figure constitutes the total output of the Administration. Examination of Table 2 shows the total outputs, final demands and interdepartmental flows of all the o,ther sections of the hospital system. Similar reasoning may be applied to the basic inputs. For example, 167,796 dollars per year is spent on the labor force by X-ray. It should be noted that there is no final demand for labor.
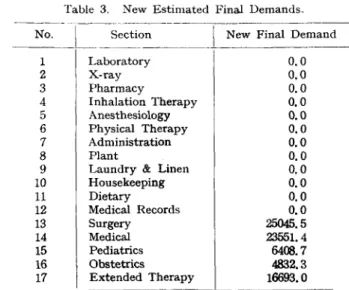
Table 3. New Estimated Final Demands.
-N~~J-
__
~e~ti~n --~
___LFe~lDe~~nd_
1 Laboratory 0.0 2 X-ray 0.0 3 Pharmacy 0.0 4 Inhalation Therapy 0.0 5 Anesthesiology 0.0 6 Physical Therapy 0.0 7 Administration 0.0 8 Plant 0.09 Laundry & Linen 0.0
10 Housekeeping 0.0 11 Dietary 0.0 12 ~edical Ftecords 0.0 13 Surgery 25045.5 14 ~edical 23551. 4 15 Pediatrics 6400.7 16 Obstetrics 4832.3 17 Extended Therapy 16693.0
A Deterministic I/O Model of a Hospital System 29
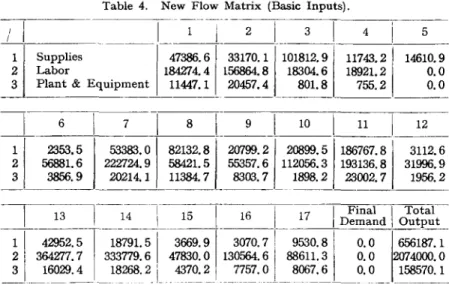
Table 4. New Flow Matrix (Basic Inputs).
!
I _ _ _ _~
_ _ _ _ _ _ 1_ 2 1 _____ 3_-c ___ 4_-'. ___ 5 _ _llJ
SUPPlies 47386.6 33170.1 101812.9 2 Labor 184274.4 156864.8 18304.6 11743.2 18921.2 755.2 14610.9 0.0 0.0 3 Plant & Equip~ent_11447. 1 . 20457~ 801. 8~ _ _ _ _ _ L _ _ _ ~' _ _ _ _ _
_ 1-
6 7 8 9 10 11 12 1 2353,5 53383.0 2 56881.6 222724.9 3 3856.9 20214.1 82132.8 58421. 5 11384.7 20799.2 20899.5 186767.8 55357.6 112056.3 193136.8 8303. 7 1898. 2 23002. 7 3112.6 31996.9 1956.2 '-Statement of the problem and of the method to solve it: Because the problem is to respond to the increased (or changed) final demand of the community for the services of the hospital system, it is necessary to estimate quantitatively these new final demands and in turn, use the input~output model developed earlier, to compute: (1) The new in~ terdepartmental flows (2) The new basic inputs and {3} The new total outputs. A set of new estimated :final demands for all the sections is shown in Table 3. Having estimated the
x.;'s
andY/s
(Table 2) and new final demands, we can determine the new levels of basic inputs, total outputs and intersectional flows. The new flow matrix is shown in Tables 4 and 5.A computer program has been developed which incorporates the following basic steps:
a. Quantify the elements of the matrices, A, Y and X.
b. Estimate the changed final demand (Y).
c. Use the model Y =AX as follows to find the new basic inputs, intersectional flows and total outputs.
30 Manohar D. Nasta, John Keith Beddow and Robert A. Shapiro
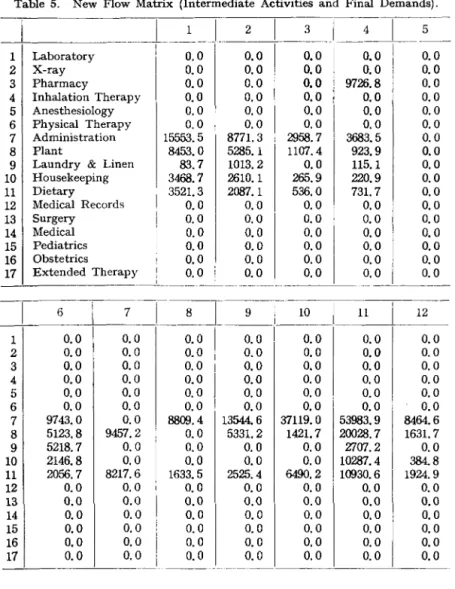
Table 5. New Flow Matrix (Intermediate Activities and Final Demands) .
..
_~1_1
__
J
...
_~_I
__
3 _ _ _4_1 ___
5 _ 1 Laboratory 2 X-ray 3 Pharmacy 4 Inhalation Therapy 5 Anesthesiology 6 Physical Therapy 7 Administration 8 Plant9 Laundry & Linen 10 Housekeeping 11 Dietary 12 Medical Records 13 Surgery 14 Medical 15 Pediatrics 16 Obstetrics 17 Extended Therapy 1 2 3 4 5 6 7 8 9 10 11 12 13 14 15 16 17 6 7 0.0 O. 0.0 O. 0.0 O. 0.0 O. 0.0 O. 0.0 O. 9743.0 O. 5123.8 9457. 5218.7 O. 2146.8 O. 2056. 7 8217. 0.0 O. 0.0 O. 0.0 O. 0.0 O. 0.0 O. 0.0 O.
o
o
o
o
oo
o
2o
o
6o
o
o
o
o
o
0.0 0.0 0.0 0.0 0.0 0.0 15553.5 8453.0 83.7 3468. 7 3521. 3 0.0 0.0 0.0 0.0 0.0 0.0 0.0 0.0 0.0 0.0 0.0 0.0 8771. 3 5285.1 1013.2 2610.1 2087.1 0.0 0.0 0.0 0.0 0.0 0.0 0.0 0.0 0.0 0.0 0.0 0.0 2958.7 1107.4 0.0 265.9 536.0 0.0 0.0 0.0 0.0 0.0 0.0 0.0 0.0 9726.8 0.0 0.0 0.0 3683.5 923.9 115.1 220.9 731. 7 0.0 0.0 0.0 0.0 0.0 0.0 0.0 0.0 0.0 0.0 0.0 0.0 0.0 0.0 0.0 0.0 0.0 0.0 0.0 0.0 0.0 0.0 0.0 1 _ _ _ _ _ _ _ _ _ _ _ _ _ _ _ _ _ _ _ _ _ _ ' - -_ _ • _ _ _ ~ _ _ _ 8 9 10 11 12 0.0 0.0 0.0 0.0 0.0 0.0 0.0 0.0 0.0 0.0 0.0 0.0 0.0 0.0 0.0 0.0 0.0 0.0 0.0 0.0 0.0 0.0 0.0 0.0 0.0 0.0 0.0 0.0 0.0 0.0 8809.4 13544.6 37119.0 53983.9 8464.6 0.0 5331. 2 1421. 7 20028.7 1631. 7 0.0 0.0 0.0 2707.2 0.0 0.0 0.0 0.0 10287.4 384.8 1633.5 2525.4 6490.2 10930.6 1924.9 0.0 0.0 0.0 0.0 0.0 0.0 0.0 0.0 0.0 0.0 0.0 0.0 0.0 0.0 0.0 0.0 0.0 0.0 0.0 0.0 0.0 0.0 0.0 0.0 0.0 0.0 0.0 0.0 0.0 0.0A Determini8tic I/O Model of a H08pital SY8tem Table 5. Continued. 13 14 1 128968.7 148430.9 O. 2 99142.1 117512.3 O. 3 85558.3 109247.4 O. 4 0.0 71933.4 O. 5 31892.7 4823.5 O. 6 130588.9 0.0 O. 7 47208.6 58955.7 13937. 8 32736.4 26419.9 8326. 9 32783.8 20157.0 11915. 10 47095.7 46297.5 10316. 11 98950.5 128307.3 29885. 12 13910.7 16001. 3 3196. 13 0.0 0.0 O. 14 0.0 0.0 O. 15 0.0 0.0 O. 16 0.0 0.0 O. 17 0.0 0.0 O. -(i) (ii) (iii) (iv) x new = A -1 ynew x':l~w ., = a<.>!d ., x new J Bnew
=
cold xnewo
o o oo
o
9 7 5 6 3 o o o oo
o 16 36057.5 32230.8 21431.9 0.0 0.0 0.0 14561.1 15452.3 11958.8 32796.8 75549.9 3817.5 0.0 0.0 0.0 0.0 0.0 17 0.0 0.0 72549.9 0.0 0.0 0.0 37122.7 31380.9 6901. 5 26715.8 79465.4 10333.4 0.0 0.0 0.0 0.0 0.05. Conclusions and Summary
I
FinalI
Demand 0.0 0.0 0.0 0.0 0.0 0.0 0.0 0.0 0.0 0.0 0.0 0.0 25045.5 23551. 4 6408.7 4832.3 16693.0 31 Total Output 313457.4 248885.7 298514.4 71933.4 36716.1 130588.9 334417.8 173080.0 92854.4 182607.4 452813.6 47258.9 25045.5 23551. 3 6408.7 4832.3 16693.01. Because the demands upon the hospital facilities have changed, the values of the elements of the matrix Y are changed. In order to meet this new level of demand both the basic inputs and total outputs of each of the effected sections will require readjustment. Furthermore the changed total output of each section will alter the intersectional flows between each section. The model gives quantitative values for the new levels of basic inputs, total outputs and intersectional flows. These new values are shown in Tables 4 and 5. The figures shown in Tables 4 and 5 help management to formulate policies, which involve problems of
32 Manohar D. Nal/ta, John Keith Beddow and Robert A. Shapiro
resource allocation, in a quantitative manner.
2. Because input-output analysis replaces qualitative planning and decision making with quantitative planning and decision making, cost effectiveness is increased throughout the whole system. This factor also applies when management is considering new innovations in
the system.
3. The input-output technique can be usefully applied to subsec-tions, secsubsec-tions, departments, whole institutions or even to groupings of institutions with corresponding benefits.
4. Because most of the raw data required for input-output analysis is usually already available within current accounting procedures, the extra cost of using the model program should be well within the budget of the system being considered.
5. In this paper, one specific hospital problem has been dealt with, namely the effect of the changing of the final demand on the hospital upon the basic inputs to and the intersectional flows in the hospital. The mathematical model which has been discussed here can also be used to deal with a variety of other problems. For example (a) Sensitivity analysis of each cell of matrix A with respect to a specific output (b) Design and reallocation of resources to minimize total cost per unit output.
6. The deterministic input-output technique is not a panacea. For example, the model present in this paper has two disadvantages. Firstly, it is a static model. This means that it ignores variations of ails with time. Secondly, it is a deterministic model. This means that the Xi/S are constant and do not fluctuate over the period of
analy-SIS. Most if not all real systems are dynamic and probabilistic.
7. More work is in progress in the following areas: (a) Probabil-istic input-output model (b) Dynamic input-output model (c) Sensitivity analysis of input-output model.
A Deterministic I/O Model of a Hospital System 33
References
[ 1] Alterman, J., "The Use of Input-output Models in Economic Projections and Manpower Analysis by the Federal Interagency Growth Project in the United
States," Bureau of Labor Statistics, Washington, D.e., U.S.A.
[ 2] Bruno, M., M. Fraenkel, and C. Dougherty, "Dynamic Input-Output, Trade and Development," the Hebrew University, Israel and Harvard University, U.S.A.
[3] Hirsch, Werner Z., "Adaptation of Regional Input-output Analysis to Urban Government Decision-Making," University of California, Los Angeles, U.S.A. [ 4] Leontief, Wassily W., "The Dynamic Inverse," Harvard University, U.S.A. [ 5] Leontief, Wassily W., Input-output Economics, Oxford University Press, New
York, N.Y., 1966.
[6] Leontief, vVassily W., et aI., Studies in the Structure of the American Economy: Theoretical and Empirical Explomtions in Input-output Analysis, Oxford University Press, New York, N.Y., 1953.
[7] Levine, Jack B. and W. Judy Richard, "The Integration of Simulation Models and Program Budgeting in University Planning and Administration," Paper presented at the Joint TIMS/ORSA Meeting, San Francisco, May, 1968.
[8] Littauer, David, "Industrial Engineering in the Hospital," Hospitals, JAHA,
34 (1960), 4, 44-46, 5, 40-42, 93.
[9] Manne, Allan S. and T. Weisskopf, "A Dynamic Input-output Model for India's Fourth and Fifth Plans," Stanford University, U.S.A., and Indian Statistical Institute, New Delhi, India.
[10] U.S. Public Health Service, Design and Construction of General Hospitals,
F.W. Dodge Corporation in collaboration with Modern Hospital Publishing Co., Chicago, 1953.
[11] U.S .. Public Health Service, Procedures for Areawide Health Facility Planning,
U.S. Department of Health, Education, and Welfare, Washington, D.C.,
1963-a.
[12] Vaccara, B., "Changes over Time in Input-output Coefficients," United States Department of Commerce, Washington, D.C., U.S.A.