学位論文
Formation and growth of massive black holes
in the early universe
(宇宙初期での大質量ブラックホールの形成と成長)
平成
29
年
12
月 博士(理学)申請
東京大学大学院 理学系研究科
物理学専攻
ABSTRACT
Observations of high-redshift quasars have revealed the existence of supermassive black holes (SMBHs) in the early universe. Importantly, the SMBHs are believed to have grown within 1 Gyr to as massive as ≳ 109 solar masses (M⊙), suggesting a big problem in the context of structure formation in the early universe that ”how does a SMBH grow so fast?”.
As origins of the high-redshift SMBHs, theoretical astrophysicists often consider that a small ‘seed’ BH, left as a remnant of a massive star, grows via gas accretion and mergers to become a SMBH. As a comparative model for formation of such a seed, a BH of mass ∼ 100 M⊙, which is left after death of a first star or a Population III (Pop III) star, is thought to grow via a nearly Eddington accretion rate. This means that a SMBH of mass ∼ 109M⊙ is marginally formed within the age of the universe at z ∼ 6. Unfortunately, this model has a problem that the BH growth is delayed due to effects of radiation, which is emitted when gravitational energy is released from accreting gas and is converted to radiation energy. This radiation feedback significantly suppresses the accretion rate well below the Eddington accretion rate and makes the SMBH formation impossible by the Pop III BH model.
As alternative models to facilitate the formation of the high-redshift SMBHs, there are three models: the direct collapse model, the super-Eddington accretion model and the runaway stellar collision model. These models have been intensively studied by many authors, but there still remain many things to be examined. Specifically, previous works often consider idealized situations, whereby the validity of the models cannot be correctly discussed.
In this thesis, we study the BH formation models by considering more realistic situations in order to examine the validity of the models.
First, we work on the direct collapse model, where a supermassive star (SMS) of mass ∼ 105M
⊙
almost entirely collapses at the end of stellar lifetime, directly leaving a ∼ 105M⊙ BH. A SMS can form under peculiar conditions, e.g., inside an atomic-cooling halo strongly irradiated by Lyman-Werner radiation emitted from external sources, whereby a rapid gas accretion of ∼ 0.1 − 1 M⊙yr−1 on to a growing protostar is realized. However, there is a problem that, during the formation of a SMS via rapid gas accretion, strong stellar radiation is expected to stop the accretion by UV radiation feedback. To clarify if the expectation is true or not, Hosokawa et al. (2013) compute stellar evolution of the accreting SMS, by assuming a constant accretion rate. They find that a growing SMS is actually largely inflated with a low surface temperature of∼ 5000 K and emit a small amount of UV photons to cause the UV feedback. The SMS evolution is contrasted to a relatively slowly accreting Pop III star which contracts and emit a significant amount of UV radiation. In a more realistic case, the accretion history will be highly variable with time, since the accretion occurs through a gravitationally unstable disk where fragments form and migrate to fall on to the central protostar, causing accretion bursts. In this case, the evolution of the growing SMS can be affected if there are long, quiescent accretion phases during which the star can contract.
We examine stellar evolution of an accreting SMS with a highly variable, episodic accretion history, where burst accretion followed by quiescent accretion is repeated. We construct an analytic model of
episodic accretion histories with parameters characterizing the burst and quiescent phases, and then calculate the evolution. It is found that the SMS significantly contracts during the quiescent phases and emits a copious amount of UV photons, likely resulting in the efficient radiation feedback, if the length of the quiescent phases is longer than a thousand years. We also investigate the effect of a more realistic episodic accretion history, which is obtained from 2D hydrodynamics simulations of a gravitationally unstable disk, on the SMS evolution. In this case, the duration of the quiescent phases is typically shorter than 103yr and the accreting protostar does not contract. Then, the protostar is able to grow to become as massive as ∼ 105M
⊙ without UV feedback and the direct
collapse BH formation is viable.
Next, we study the super-Eddington model, in which a BH grows with very rapid super-Eddington gas accretion and becomes a SMBH in a short time. How can such super-Eddington accretion be realized? It is naively expected that such a rapid gas accretion flow near the BH causes strong radiation force with emitting nearly Eddington luminosity, which halts the accretion and stops the BH growth. Photon trapping, however, is thought to reduce the emerging luminosity. In fact, several studies including numerical simulations and (semi-)analytical studies show that the super-Eddington accretion is not prevented by the radiation force within the BH accretion flow near the BH. On the other hand, radiation heating can suppress gas accretion at larger scales where gas pressure and BH gravity is comparable. Thus, the small and large scale regions need to be self-consistently investigated. To this end, Inayoshi, Haiman & Ostriker (2016) perform a 1D radiation hydrodynamical simulation of a spherical accretion flow at the large scales, assuming a functional form of luminosity emerging from the central region, which is at most the Eddington luminosity for this spherical case. They find that transition occurs from the usual Eddington accretion to a ‘hyper-Eddington’ accretion, which is essentially a Bondi accretion. The transition occurs because an ionized region is initially smaller than the Bondi radius at which BH gravity balances gas pressure. More realistically, however, the emerging luminosity can exceed the Eddington luminosity due to the deviation from the spherical morphology, i.e., due to formation of an accretion disk where emitting radiation can preferentially escape through polar directions.
We examine the large-scale BH accretion flow with a suEddington luminosity source by per-forming 1D radiation hydrodynamics simulations, in order to see whether the transition to the steady hyper-Eddington accretion occurs in this high-luminosity case. We construct an analytical model of the central source which exceeds the Eddington luminosity. It is shown that the transition occurs even when the luminosity reaches at most 100 times the Eddington luminosity. We argue, using an-alytic models and numerical results, that the transition is realized because ram pressure of accreting gas in addition to gas gravity overcomes the radiation force from the super-Eddington luminosity source. Thus, the BH growth would continue not to be halted by the strong radiation.
Finally, we study the runaway stellar collision model, in which stars in a dense star cluster succes-sively collide and merge with a specific star residing near the center. The star eventually becomes as massive as∼ 1000 M⊙ and collapses to leave an intermediate-mass BH (IMBH), possibly serving as a seed for forming a SMBH at high redshift. Although several studies have shown that star cluster formation is likely to occur within metal-enriched atomic-cooling halos in the early universe, it is still uncertain whether such a runaway collision process is prevalent. Katz, Sijacki & Haehnelt (2015) perform direct N-body simulations of star clusters formed in a mini-halo system, which is identified in cosmological simulations. They show that the runaway collision and IMBH formation are very likely outcomes in mini-halos.
This work encourages us to statistically examine the star cluster dynamics and evolution for clusters forming in atomic-cooling halos. We first perform cosmological simulations to find star
cluster forming sites. We then generate star cluster initial conditions for direct N-body simulations assuming star formation efficiency and an initial mass function. For the star clusters, direct N-body simulations are conducted, to follow stellar collisions and mergers. It is found that in all the clusters except one the runaway stellar collisions occur and massive stars of mass 400−1900 M⊙ form, which would leave IMBHs at the end of their lives. The diversity of the final stellar masses is attributed to the diversity of the parent atomic-cooling halo properties as virial mass, central gas density and central gas velocity dispersion. We also derive an IMBH mass-cluster mass relation for our simulated clusters and compare it with a SMBH mass-bulge mass relation in the local universe.
We conclude that the three models are viable until the seed BH formation. However, it is still unclear whether the seed BHs grow to the SMBHs. In future works, we will study the subsequent evolution in the context of the three models considered in this thesis. Specifically, we will follow the evolution and growth of the IMBHs left inside the star clusters (Chapter 5). We will focus on tidal disruption of stars and BH merger which would occur during the IMBH growth and estimate the event rates to compare to the future X-ray/gravitational-wave observations. The comparison would greatly help us to further understand the origin of the SMBHs in the early universe.
ACKNOWLEDGEMENT
I express my heartfelt thanks to my supervisor, Naoki Yoshida, who introduces to me the interesting and worthwhile topic and always guides me to correct way during my Ph.D. course. His teachings and advises not only encourage me to achieve my studies but also importantly affect my way of thinking about things which must be essential to my later life. I am really thankful to my collaborators Takashi Hosokawa and Harold W. Yorke, who teach me how to use the sophisticated stellar evolution code STELLAR and enthusiastically support me to complete my first two studies. I am very grateful to my collaborators Eduard I. Vorobyov and Kazuyuki Omukai, who help me to accomplish my second study where their supports are indispensable. I express my gratitude to my collaborators, Kohei Inayoshi and Zolt´an Haiman for their hospitality during my three-month stay at Columbia University from January 2nd to March 30th, 2016. Their insightful knowledges and advises are essential to obtain very interesting and meaningful results when writing the third paper. I express my appreciation to my collaborators Michiko S. Fujii, who teach me to use the direct N-body code BRIDGE, and Shingo Hirano, who give me very valuable knowledges about early structure formation. Their supports are essential when I finish my fourth study.
I spend my 5 year Ph.D. course at Hongo Campus of the University of Tokyo and I express my heartfelt gratitude to the group members. Seminars and meetings that I have shared time with them are always fruitful, increasing and polishing my knowledge and broadening my perspectives through questions and discussions. I also show appreciation to SOCs and LOCs who organize fruitful meetings, workshops and symposiums I have attended. They give me opportunities to present my works through talks or posters, as well as to exchange opinions with astronomers and astrophysicists in the world. In some meetings and workshops, they also kindly financially support me.
I am very thankful to the examiners, Noriko Yamasaki (chief), Akito Kusaka, Fujihiro Hamba, Masahiro Kawasaki and Kipp Cannon, who have taken time to read this thesis and have greatly helped me to improve this thesis through fruitful discussions and comments.
I am very thankful to my family who always support me in my daily life. Their ongoing support is also indispensable when I complete my works during this 5 year Ph.D. course.
In this thesis, numerical calculations and simulations are partly performed on PC cluster and Cray XC30 at Center for Computational Astrophysics, National Astronomical Observatory of Japan. The figures in this thesis are in part generated using Gnuplot*1, Matplotlib*2, yt*3 and Inkscape*4. The
works in this thesis are partly supported by Advanced Leading Graduate Course for Photon Science (ALPS) and Grant-in-Aid for Japan Society for the Promotion of Science (JSPS) Research Fellow.
*1http://www.gnuplot.info *2https://matplotlib.org *3http://yt-project.org *4https://inkscape.org
Contents
Chapter 1 Introduction 1
1.1 Observations of supermassive black holes lurking in the distant universe . . . . 1
1.1.1 Eddington ratios . . . 1
1.2 Theoretical models of SMBH formation in the early universe . . . 1
1.2.1 Supermassive stars and direct collapse massive seed BHs . . . 5
1.2.2 Super-Eddington mass accretion on to seed BHs . . . 8
1.2.3 Formation of massive stars and intermediate-mass BHs via runaway col-lision of stars in dense star clusters . . . 9
1.3 Aim of this thesis . . . 10
Chapter 2 SMS formation via parametrized episodic accretion 12 2.1 Overview . . . 12
2.2 Numerical method and modeling of episodic accretion . . . 12
2.2.1 Stellar evolution code for accreting stars . . . 12
2.2.2 Modeling of episodic accretion . . . 14
2.3 Results . . . 14
2.3.1 Evolution by constant accretion rates . . . 14
2.3.1.1 Normal Pop III star formation case with 10−3 M⊙yr−1 . . . . 14
2.3.1.2 Direct collapse case with 0.1 M⊙yr−1 . . . 15
2.3.2 Stellar evolution via episodic accretion . . . 18
2.3.2.1 The fiducial case: Model C . . . 18
2.3.2.2 Variations with different episodic accretion histories . . . 21
2.4 Discussions . . . 23
2.4.1 UV feedback from SMSs evolving via episodic accretion . . . 23
2.4.2 Stellar evolution for M∗ ≳ 104 M⊙ . . . 25
2.4.3 Accretion histories in atomic-cooling halos . . . 25
2.4.4 Metallicity effects on SMS growth . . . 26
2.5 Conclusions . . . 27
Chapter 3 SMS formation via realistic episodic accretion 29 3.1 Overview . . . 29
3.2 Numerical model . . . 29
3.2.1 2D hydrodynamical simulations . . . 29
3.2.2 Stellar evolution calculations . . . 32
3.3 Results . . . 33
3.3.1 Episodic accretion with self-gravitating disks . . . 33
3.3.2 Stellar evolution via episodic mass accretion . . . 39
3.4 Conclusion and Discussion . . . 39
3.4.2 Analytical estimation of the length of quiescent phases . . . 41
3.4.3 Stellar evolution of fragments and UV feedback . . . 43
Chapter 4 Black hole growth via hyper-Eddington accretion under super-Eddington luminosity 45 4.1 Overview . . . 45
4.2 Simulation method . . . 45
4.2.1 Setup of the simulations . . . 45
4.2.2 Basic equations and numerical schemes . . . 47
4.3 Results of the simulations . . . 50
4.4 Analytical arguments . . . 53
4.4.1 Conditions for hyper-Eddington accretion . . . 54
4.4.2 1D momentum-driven shell model . . . 55
4.5 Summary and discussions . . . 58
Chapter 5 Black hole formation via runaway collision in primordial star clusters 61 5.1 Overview . . . 61
5.2 Numerical methods . . . 61
5.2.1 Cosmological simulations . . . 62
5.2.2 Generation of star cluster plus DM distributions . . . 63
5.2.3 Direct-tree hybrid N-body simulations . . . 64
5.3 Results . . . 65
5.3.1 Fiducial models . . . 65
5.3.2 Model parameter dependence . . . 67
5.4 Summary and discussions . . . 69
5.4.1 Correlation between the final mass and halo properties . . . 69
5.4.2 Cluster mass-IMBH mass relation . . . 71
5.4.3 Model uncertainties . . . 72
5.4.4 Fate of IMBHs in star clusters . . . 74
Chapter 6 Conclusion 75
Chapter 1
Introduction
1.1
Observations of supermassive black holes lurking in the distant
universe
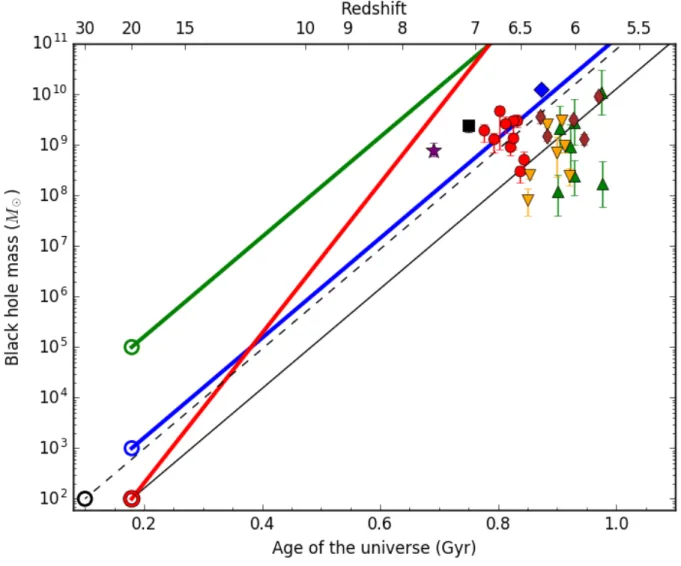
In the past decade, observations of the distant universe have revealed the existence of supermassive black holes (SMBHs) with mass ∼ 109 M⊙ at high redshift z ≳ 6 or the age of the universe ≲ 1 Gyr (e.g., Fan et al. 2001, Jiang et al. 2007, Kurk et al. 2007, Willott et al. 2010, Mortlock et al. 2011, Venemans et al. 2013, De Rosa et al. 2014, Wu et al. 2015, Mazzucchelli et al. 2017, Ba˜nados et al. 2017). The origin of these high redshift SMBHs remain to be elucidated.
In Figure 1.1, we show the BH mass MBH of observed quasars at z ≳ 6 whose masses have been
estimated. The observed quasars are summarized in Table 1.1.
1.1.1
Eddington ratios
A large fraction of the high-redshift quasars emits luminosity of nearly the Eddington limit, i.e., accreting at nearly the Eddington accretion rate. In Figure 1.2, we plot bolometric luminosity versus BH mass of the high-redshift quasars (Table 1.1). The Eddington ratios for the high-redshift quasars range ∼ 0.1 − 1, which is comparable to the ratios for the quasars at z < 4 (Kollmeier et al. 2006).
For comparison, the bolometric luminosity versus mass of compact objects for the local ultra-luminous X-ray sources (ULXs; Table 1.2) are also shown in Figure 1.2. For the ULXs, the luminosity can significantly exceed the Eddington limit with a range of ∼ 1 − 100× the Eddington luminosity, indicating that the super-Eddington accretion on to the compact objects occurs.
1.2
Theoretical models of SMBH formation in the early universe
In many theoretical works which attempt to elucidate the origin of the SMBHs at z ≳ 6, small ‘seed’ BHs of mass 100− 105 M⊙ are often deemed as the initial states and then grow to the SMBHs via mass accretion and mergers with other BHs. The evolution of the seed BH mass is estimated by the following equation: dMBH dt = (1− ϵ) ˙m = ( 1− ϵ ϵ ) ( L LEdd ) MBH tEdd , (1.1)
where ϵ is radiative efficiency of accreting gas, ˙m = L/ϵc2 is a total mass accretion rate, L is an accretion luminosity, LEdd is the Eddington luminosity and tEdd ≡ MBHc2/LEdd is the Eddington
Chapter 1 Introduction 2
Table 1.1 High-z quasars observed at z≳ 6 whose masses are estimated.
Name Redshift MBH Lbol Lbol/LEdd References
(109M⊙) (1047erg s−1) VIK J0109-3047 6.7909± 0.0004 1.33+0.38−0.62 0.51+0.05−0.06 0.29+0.88−2.59 [1] PSO J036.5078+03.0498 6.541± 0.002 3.00+0.92−0.77 2.0+0.22−0.64 0.51+0.17−0.21 [1] VIK J0305-3150 6.6145± 0.0001 0.90+0.29−0.27 0.75+0.10−0.34 0.64+2.20−3.42 [1] PSO J167.6415-13.4960 6.5148± 0.0005 0.30+0.08−0.12 0.47+0.16−0.22 1.22+0.51−0.75 [1] ULAS J1120+0641 7.0842± 0.0004 2.47+0.62−0.67 1.83+0.19−0.072 0.57+0.16−0.27 [1, 2] HSC J1205-0000 6.73± 0.02 4.7+1.2−3.9 0.36+0.18−0.20 0.06+0.32−0.58 [1] PSO J231.6576-20.8335 6.5864± 0.0005 3.05+0.44−2.24 1.89+0.34−0.45 0.48+0.11−0.39 [1] PSO J247.2970+24.1277 6.476± 0.004 0.52+0.22−0.25 1.77+0.06−0.76 2.60+0.08−0.15 [1] PSO J323.1382+12.2986 6.5881± 0.0003 1.39+0.32−0.51 0.81+0.07−0.50 0.44+1.09−3.19 [1] PSO J338.2298+29.5089 6.666± 0.004 2.70+0.85−0.97 0.4+0.2−0.1 0.11+0.71−0.49 [1] VIK J2348-3054 6.9018± 0.0007 1.98+0.57−0.84 0.43+0.20−0.13 0.17+0.92−0.88 [1] SDSS J010013.02+280225.8 6.30± 0.01 12.4+1.9−1.9 16.2 1.0a [3] J2229+1457 6.1517± 0.0005 0.12+0.14−0.08 0.36 2.4 [4, 5] J1319+0950 6.1330± 0.0007 2.1+3.8−1.4 2.7 1.0b [4, 8] J2054-0005 6.0391± 0.0001 0.9+1.6−0.6 1.1 1.0b [4, 8] J0055+0146 6.0060± 0.0008 0.24+0.26−0.14 0.38 1.2 [4, 5] J2310+1855 6.0031± 0.0002 2.8+5.1−1.8 3.6 1.0b [4, 8] J1044-0125 5.7847± 0.0007 11+19−7 4.5 0.35a [4, 8] J0129-0035 5.7787± 0.0001 0.17+0.31−0.11 0.22 1.0b [4, 8] J0210-0456 6.438± 0.004 0.08+0.055−0.04 0.25 2.4 [5] J2329-0301 6.417± 0.002 0.25+0.04−0.04 0.43 1.3 [5] J0050+3445 6.253± 0.003 2.6+0.5−0.4 2.1 0.62 [5] J0221-0802 6.161± 0.014 0.70+0.75−0.47 0.30 0.33 [5] J1509-1749 6.121± 0.002 3.0+0.3−0.3 2.6 0.68 [5] J2100-1715 6.087± 0.005 0.94+0.29−0.25 0.59 0.49 [5] J1641+3755 6.047± 0.003 0.24+0.10−0.08 0.72 2.3 [5] J0836+0054 5.810± 0.003 9.3+1.6−1.6 5.25 0.44 [6] J1030+0524 6.309± 0.009 3.6+0.9−0.9 2.34 0.50 [6] J1306+0356 6.016± 0.005 3.2+0.6−0.6 2.51 0.61 [6] J1411+1217 5.927± 0.004 1.3+0.3−0.3 1.58 0.94 [6] J1623+3112 6.247± 0.005 1.5+0.3−0.3 2.14 1.11 [6] J1342+0928 7.5413± 0.0007 0.78+0.33−0.19 1.5 1.5+0.5−0.4 [7]
aWe use the values of bolometric luminosity and black hole mass for the calculation of L
bol/LEdd. b The
Eddington accretion is assumed for the derivation of the BH masses. [1] Mazzucchelli et al. (2017) (their tables 5 and 8). For the quasar PSO J338+29, we recalculate the bolometric luminosity Lbol using their
equation (13). [2] Mortlock et al. (2011). [3] Wu et al. (2015). [4] Gallerani et al. (2017) (their table 1). [5] Willott et al. (2010) (their table 2). [6] Jiang et al. (2007) (their tables 2 and 5). [7] Ba˜nados et al. (2017). [8] Wang et al. (2013) (their table 3 for Lbol).
3 1.2 Theoretical models of SMBH formation in the early universe
Fig. 1.1 Redshift versus mass of high-z quasars observed at ≳ 6. We use the estimates of redshift and BH mass from Mazzucchelli et al. (2017) (red circles and black square), Wu et al. (2015) (blue diamond), Gallerani et al. (2017) (green triangles), Willott et al. (2010) (orange down-pointing triangles), Jiang et al. (2007) (brown diamonds) and Ba˜nados et al. (2017) (purple star). The black square represents the quasar discovered by (Mortlock et al. 2011). Evolutions of BH mass are also shown as lines from the initial seed BH mass depicted as open circles (see Section 1.2). The black solid and dashed lines depict evolutions of BH mass from z = 20 and 30 respectively, assuming the initial seed BH mass Mseed = 100 M⊙ and the
Eddington accretion rate, i.e., L = LEdd in equation (1.4). The green and blue solid lines
represent the mass growth from z = 20 with the larger seed BH mass Mseed = 105 M⊙ and
1000 M⊙ respectively, assuming the Eddington accretion rate. The red solid line shows the mass growth from z = 20 with a super-Eddington accretion rate with L = 1.5LEdd in equation
(1.4) from Mseed = 100 M⊙.
time scale. The Eddington luminostiy is
LEdd =
4πGM µempc
σT
, (1.2)
where µe is mean molecular mass per an electron, mp is the proton mass and σT is the Thompson
scattering cross section. We can solve the equation (1.1) as
MBH= Mseedexp ( t tgrow ) , (1.3)
Chapter 1 Introduction 4
Fig. 1.2 Bolometric luminosity versus BH mass for the quasars in the early universe (Table 1.1, the colors and markers are the same as in Figure 1.1). The corresponding quantities for some ULXs are also shown by black open circles (Table 1.2). The lines denote the relation of mass-f LEdd, where LEdd is the Eddington luminosity (equation 1.2) and f = 0.1, 1, 10 and 100.
Table 1.2 Some examples of ULXs.
Name M L L/LEdd References
(M⊙) (1040erg s−1) Holmberg II X-1 > 25 1.34a < 4.3 [1] M 82 X-1 428± 105 5b 0.8± 0.2 [2] M 82 X-2 ∼ 1.4 1.8b ∼ 100 [3] NGC 7793 P13 ∼ 1.4 0.2− 0.5b ∼ 30 [4] M 101 ULX-1 20− 40 0.3a ∼ 1 [5] NGC 1313 X-1/X-2 > 100 2.0/0.66b < 1.6/ < 0.52 [6] M74 X-1 ∼ 140 < 1.2b < 0.7 [7] ESO 243-49 > 500 < 110b < 20 [8]
aBolometric luminosity. bX-ray luminosity. [1] Cseh et al. (2014). [2] Pasham, Strohmayer & Mushotzky
(2014). [3] Bachetti et al. (2014). [4] Israel et al. (2017). [5] Liu et al. (2013). [6] Miller et al. (2003). [7] Krauss et al. (2005). [8] Farrell et al. (2009).
5 1.2 Theoretical models of SMBH formation in the early universe
Fig. 1.3 Pop III BH model for the formation of the high-redshift SMBHs. Table 1.3 A mini-halo versus an atomic-cooling halo.
Nomenclature Redshift Mvir(M⊙) Components Coolants T (K) M (M˙ ⊙yr−1)
Mini-halo ≳ 20 ∼ 105−6 primordial species including H
2 H2 ∼ 200 ∼ 10−4− 10−3
Atomic-cooling (AC) halo ≳ 10 ∼ 107−8 primordial species without H
2 H ∼ 104 ∼ 0.1 − 1
Column 2: typical redshift when the halo forms or becomes unstable and commences gas collapse due to Jeans instability with gas density ≲ 1 cm−3; column 3: virial mass of the halo at the halo formation; column 4: components of the halo at the halo formation; column 5: main coolants during the gas collapse; column 6: typical gas temperature during the gas collapse; column 7: accretion rates which would be realized after protostellar formation at density∼ 1021cm−3.
where Mseed is the initial seed BH mass and tgrow is the growth time scale. The latter quantity is
tgrow = ( ϵ 1− ϵ ) ( LEdd L ) tEdd = 4.4× 10⁷ yr ( LEdd L ) , (1.4)
where we use radiative efficiency ϵ = 0.1, typical for local quasars (Soltan 1982, Yu & Tremaine 2002), and µe = 1.14, expected in fully ionized primordial gas with the hydrogen and helium mass
fractions of X = 0.75 and Y = 0.25.
As in Figure 1.3, possible seed BHs are remnant BHs of Population III (Pop III) stars (Madau & Rees 2001), which have typical stellar mass of ∼ 100 M⊙ (Hirano et al. 2014, Susa, Hasegawa & Tominaga 2014) and can leave the BHs with mass ∼ 100 M⊙ after their lifetimes (see figure 2 of Heger & Woosley 2002). The seed BH of ∼ 100 M⊙ can just barely attain mass of ∼ 109 M⊙ by
z ≃ 6 if we assume the Eddington accretion rate, as is depicted by the black solid line of Figure 1.1.
Recent studies, however, suggest difficulties in this model. For example, radiation feedback from a BH accretion disk readily suppresses a gas supply from an intergalactic medium, resulting in decrease of the accretion rate far below the Eddington values (Alvarez, Wise & Abel 2009, Jeon et al. 2012). The growth time of the BH then becomes much longer than the age of the universe at z ∼ 6.
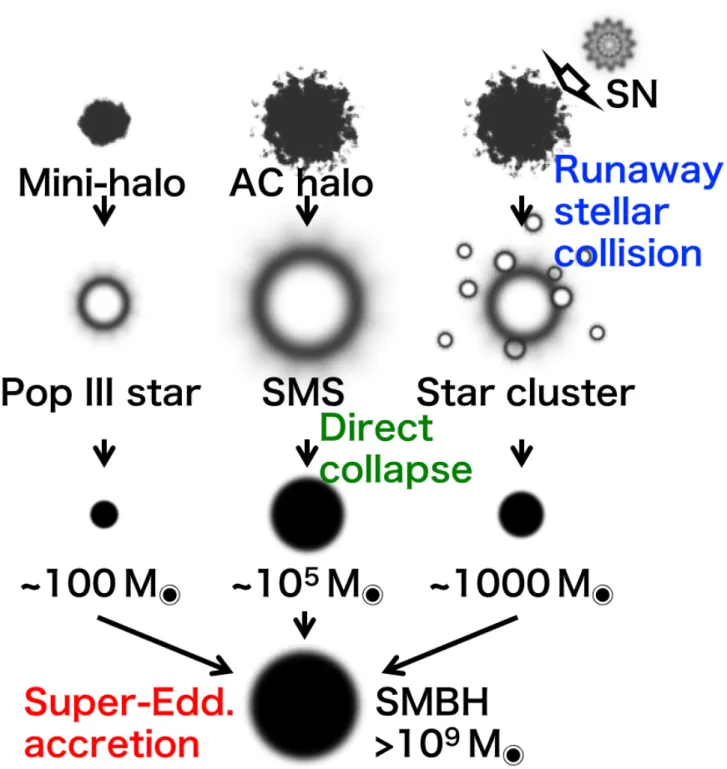
To circumvent the difficulties in the Pop III BH model, three models which accelerate the formation of the high-redshift SMBHs have been suggested: the direct collapse model, the super-Eddington model and the runaway stellar collision model. In Figure 1.4, we show a schematic picture which depicts these three models.
In Tables 1.3 and 1.4, we briefly summarize the nomenclatures used in this thesis.
1.2.1
Supermassive stars and direct collapse massive seed BHs
One alternative model to ease the growth delay problem is so-called direct collapse model. In the model, SMBHs are assumed to be built from larger seed BHs of MBH∼ 105M⊙ which are remnants
Chapter 1 Introduction 6
Fig. 1.4 Three SMBH formation models which accelerate the formation of SMBHs in the early universe: the direct collapse model, the super-Eddington model and the runaway stellar collision model.
Table 1.4 A Pop III star versus a supermassive star.
Nomenclature Formation site M∗ (M⊙) (Normal) Pop III star Mini-halo ∼ 100 Supermassive star (SMS) AC halo ∼ 105
7 1.2 Theoretical models of SMBH formation in the early universe
after gravitational collapse of supermassive stars (SMSs) with similar masses (Shibata & Shapiro 2002, Bromm & Loeb 2003, Reisswig et al. 2013). The growth time of the BH is significantly shortened in this case. For instance, a ∼ 105M⊙ seed BH will easily increase its mass and becomes a ≳ 109M⊙ SMBH via accretion at the Eddington rate (see the solid green line of Figure 1.1). With reduced accretion rates due to, e.g., radiation feedback from a BH-disk system, an SMBH of
∼ 109M
⊙ can still form at ≃ 6 if the average accretion rate is higher than ∼ 50 per cent of the
Eddington accretion rate. Indeed, cosmological simulations show that efficient cold accretion flows allow such high accretion rates in the epoch of the first galaxy formation (Di Matteo et al. 2012).
In the direct collapse model, a critical assumption is that sufficiently massive stars form in a gas cloud. Specifically, SMSs are considered to form in the so-called atomic-cooling halos of virial temperature Tvir ∼ 104K (Inayoshi & Omukai 2012, Agarwal et al. 2014, Visbal, Haiman & Bryan
2014). When molecular hydrogen cooling is suppressed in these massive primordial halos due to strong ultraviolet radiation, gas clouds gravitationally collapses mainly with atomic hydrogen cool-ing, almost isothermally at T ≃ 8000 K (Omukai 2001). An embryonic protostar eventually forms and starts to grow by gas accretion from a surrounding envelope (Inayoshi & Haiman 2014, Van Borm et al. 2014), in analogy with normal Pop III star formation (Yoshida, Omukai & Hernquist 2008). The accretion rate at the accretion phase has the well-known temperature dependence of
˙ M∗ ∼ c 3 s G ∼ 0.2 ( Tvir 104K )3/2 M⊙yr−1, (1.5)
wherein cs is a sound speed of gas and G is the gravitational constant. Due to the higher gas
temperature during the collapse stage, the accretion rate is significantly higher than that in normal Pop III cases. If such a high mass accretion rate is maintained for ∼ 1 Myr, which is the lifetime of massive stars, SMSs of 105 − 106M⊙ will form and finally provide massive BH seeds after their deaths.
A possible hurdle for the growth of SMSs by rapid gas accretion is radiative feedback from the central massive protostar. Even for a normal Pop III star of ∼ 100 M⊙ forming by accretion, stellar UV radiation becomes sufficiently strong to create an H ii region which dynamically expands through the accretion envelope (McKee & Tan 2008). The H ii expansion eventually leads to halting the gas accretion; final stellar mass is determined by this mechanism (Hosokawa et al. 2011). It is expected that, for the case of SMS formation, similar or even stronger UV radiation feedback might largely reduce or even halt the gas accretion. The feedback could occur since an SMS would emit significant amounts of photons with stellar luminosity being nearly at the Eddington value, which is proportional to stellar mass.
Strength of the stellar radiation feedback is dependent critically on the ionizing photon emissivity from primordial protostars, which is derived considering their evolution during accretion. For normal Pop III cases of average accretion rates ∼ 10−3M⊙yr−1, a radius of an accreting protostar is large during the early evolution but eventually becomes small with contraction to the zero-age main sequence (ZAMS) for M∗ ∼ 100 M⊙ (Omukai & Palla 2003). During the contraction of the star, its ionizing photon emissivity rises and UV radiative feedback becomes effective.
By contrast, protostellar evolution with very rapid accretion rates ˙M∗ ≳ ˙M∗,cr= 4×10⁻²M⊙yr−1 expected in the direct collapse model is qualitatively different from that in the Pop III cases. At the high accretion rates, a protostar continues to expand and does not contract even after the star becomes as massive as ∼ 100 M⊙ (Hosokawa, Omukai & Yorke 2012). The radius of the star reaches
∼ 104R
⊙ for M∗ ≳ 103M⊙ (Hosokawa et al. 2013, Schleicher et al. 2013). Effective temperature
Chapter 1 Introduction 8
M∗ ≲ 104M⊙ remains only ≲ 1045s−1, which is several orders of magnitude smaller than for main-sequence SMSs. The resulting UV feedback would be too weak to stop the mass accretion. For giant stars, mass loss can be induced due to a pulsational instability, but expected mass-loss rates are much lower than the rapid mass growth rates via accretion (Inayoshi, Hosokawa & Omukai 2013). Thus, the high mass accretion rate is expected to be maintained and SMSs of mass ≳ 105M⊙ will ultimately form.
In the previous studies, only constant accretion rates are considered. In more realistic situations, however, the gas accretion on to a growing SMS would be dynamic with highly time-variable accretion histories. For normal Pop III cases, for example, a circumstellar accretion disk becomes gravitation-ally unstable and fragments (Stacy, Greif & Bromm 2010, Greif et al. 2011). Such fragments migrate inward within the disk and accrete on to the star (Greif et al. 2012), resulting in a drastic increase of the accretion rate which is so-called burst accretion (Vorobyov, DeSouza & Basu 2013). In this case, the accretion history has two phases: one is the burst phase with ˙M∗ ∼ 0.1 M⊙yr−1 and the other is a quiescent phase with ˙M∗ ∼ 10−4M⊙yr−1, whose time spans are≲ 102 and∼ 103− 104yr
respectively. This episodic accretion is also expected to occur during the SMS formation via disk gas accretion (Inayoshi & Haiman 2014). In fact, recent high-resolution simulations report signatures of the disk fragmentation within atomic-cooling halos (Regan, Johansson & Wise 2014, Becerra et al. 2015).
1.2.2
Super-Eddington mass accretion on to seed BHs
One of the other models to avoid the growth delay in the Pop III BH model is the super-Eddington accretion model, in which seed BHs grow via very rapid super-Eddington accretion flows. How are such super-Eddington accretion flows achieved? Usually, when the BH is fed by sufficiently strong gas flows and the emitting luminosity increases, radiative feedback is likely to disturb gas dynamics. Such radiation feedback is caused by radiation pressure force and radiation heating.
Radiation force is crucially important in the vicinity of the BH horizon since the gas is highly opaque to electron scattering. Specifically, if the luminosity approaches the Eddington luminosity (equation 1.2), the radiation force becomes comparable to the BH gravity, limiting the accretion rate to the Eddington rate. To overcome the limit of the Eddington accretion, ‘photon trapping’ (Katz 1977, Begelman 1978) during BH growth would be helpful. The photon trapping becomes effective when radiation within an optically thick flow is advected inwards via efficient electron scattering faster than the radiation can escape by radiative diffusion. The emergent luminosity is then limited, and it is prevented from exceeding the Eddington luminosity for a spherical symmetric flow case (Begelman 1979). We can estimate the characteristic ‘trapping radius’ as
Rtr ≡
κesM˙
4πc , (1.6)
outside which photons escape and contribute to the emergent luminosity. Using the radius, we can see that the maximum luminosity released by gravitational energy is limited to the Eddington luminosity as ≃ GMBHM /R˙ tr ∼ LEdd.
Considering the photon trapping effect which reduces radiation force, previous studies have shown that the super-Eddington accretion is realized with very rapid gas flows. Numerical simulations have examined rapid accretion with ˙M ≫ LEdd/c2 and showed that the high accretion rates are possible
in a disk-like configuration, with which radiation escapes vertically (Ohsuga et al. 2005, Fragile, Olejar & Anninos 2014, Jiang, Stone & Davis 2014, McKinney et al. 2014, S¸adowski et al. 2014,
9 1.2 Theoretical models of SMBH formation in the early universe
S¸adowski & Narayan 2016). In semi-analytical models, the possibility of such rapid growth of BHs in the early universe is also suggested (Volonteri & Rees 2005, Alexander & Natarajan 2014, Madau, Haardt & Dotti 2014, Volonteri, Silk & Dubus 2015). Analytical studies also support rapid growth by gas accretion at a super-Eddington rate (Pacucci, Volonteri & Ferrara 2015). A recent work of Pezzulli, Valiante & Schneider (2016) shows that a very high accretion rate of ≳ 103LEdd/c2 is
maintained at z > 10, even if BH feedback effect is included.
Radiation heating, on the other hand, can suppresses gas inflows from larger scales wherein gas is not bounded by BH gravity. By the radiation heating effect, the accretion behavior can be-come episodic and the mean accretion rate is limited to ≲ 10 LEdd/c2 (Ciotti & Ostriker 2001,
Milosavljevi´c, Couch & Bromm 2009, Park & Ricotti 2011, 2012, Park et al. 2016).
In order to address the issue of BH accretion flows more correctly, we need to consider a self-consistent solution of the flows from large scales, wherein the mass accretion begins, to small scales, wherein photon trapping diminishes the emergent luminosity. Recently, Inayoshi, Haiman & Ostriker (2016: hereafter IHO16) found a self-consistent spherically symmetric steady solution of BH accretion flows at a rate of ≳ 5000LEdd/c2 (‘hyper-Eddington accretion’) when the condition is satisfied as
( n∞ 105cm−3 ) ≳ ( MBH 104M ⊙ )−1( T∞ 104K )3/2 , (1.7)
in which n∞ and T∞ are density and temperature of ambient gas. They showed that this condition corresponds to a H ii region, generated by ionizing radiation emanating from a photosphere, being smaller than the Bondi radius. In this case, the solution consists of a radiation-dominated core, whereby photon trapping due to electron scattering is effective, and an accreting envelope that follows an isothermal Bondi profile with T ≃ 8000 K. When the photon trapping suppresses luminosity emanating from the photosphere to ≲ LEdd, radiation from the central region does not halt the
gas accretion from larger scales. In fact, the H ii region size remains much smaller than the Bondi radius, resulting in a high inflow rate which is unimpeded by radiation feedback.
In IHO16, they adopted a model which assumed that photon trapping is effective, and that luminosity is limited to LEdd. This assumption is, however, not valid if a compact nuclear disk is
produced by the accretion flow with non-zero angular momentum. From the disk, outflows or jets are potentially launched into polar regions (Ohsuga et al. 2005, McKinney et al. 2014, S¸adowski et al. 2014). Also, in the polar regions, photon trapping is found less efficient than in spherically symmetric flows, with the vertical escape of radiation being facilitated by magnetic buoyancy (Jiang, Stone & Davis 2014). As a result, luminosity away from the disk place can largely exceed the Eddington luminosity.
1.2.3
Formation of massive stars and intermediate-mass BHs via runaway collision of
stars in dense star clusters
There is still another mechanism to facilitate formation of massive BHs in the early universe. In some star clusters in the present-day Universe, it has been suggested that intermediate-mass BHs (IMBHs) lurk at the central regions. Such IMBHs, if they exist, can be remnants of very massive stars which could have formed via runaway stellar collisions in the clusters (Ebisuzaki et al. 2001, Vanbeveren et al. 2009, Devecchi et al. 2010, Katz, Sijacki & Haehnelt 2015). Omukai, Schneider & Haiman (2008) have discussed that dense star clusters, within which runaway collision can occur, are formed in atomic-cooling halos with a virial temperature of ≳ 104K, which are enriched by metals (elements heavier than helium) through a supernova ejection of matter fused inside a star. They
Chapter 1 Introduction 10
argue that a gas cloud with metallicity larger than Zcr ∼ 5 × 10⁻⁶Z⊙ can undergo dust-induced
cooling and fragmentation, resulting in production of a star cluster. Devecchi et al. (2010) have investigated formation of very massive stars and BH seeds in star clusters considering a hierarchical galaxy formation model. They predict in their semi-analytic model that a BH mass density is as large as ρseed ∼ 2000 − 4000 M⊙Mpc−3 at z ≳ 6.
Formation of star clusters at high redshift has been also examined by numerical simulations (Boley et al. 2009, Trenti, Padoan & Jimenez 2015). Bromm & Clarke (2002) have performed Smoothed Particle Hydrodynamics (SPH) simulations of dwarf galaxy formation in the early universe and show that globular clusters with mass ∼ 105M⊙ form in small-mass halos. Kimm et al. (2016) have stud-ied formation of globular clusters at z > 10 by performing cosmological radiation-hydrodynamical simulations. They find that metal-cooling induced gas fragmentation drives formation of dense star clusters with mass 6× 10⁵M⊙ and a half-light radius ≲ 1 pc within about 10 Myr.
Overall, the dense star cluster formation in the early universe is plausible. There are, however, few simulations to date which follow primordial star cluster evolution until the runaway stellar collisions occur and IMBHs form. Katz, Sijacki & Haehnelt (2015) have performed a cosmological simulation to examine the dynamical evolution of a star cluster which is formed in a metal-enriched mini-halo. Identifying the star cluster from the cosmological simulation and then performing direct N-body simulations, they show that the runaway stellar collisions occur in the cluster, where a very massive star of ∼ 300 − 1000 M⊙ is yielded. The massive stars would leave IMBHs after their lifetimes. The cluster model of Katz, Sijacki & Haehnelt (2015) provides promising IMBH formation channel in the early universe, but unfortunately their cluster model is based on only one specific mini-halo. Thus, it is still unclear how rare such IMBH formation at high redshift is.
1.3
Aim of this thesis
This thesis aims to study the three BH seed formation models which circumvent the BH growth delay (Section 1.2), namely, the direct collapse model, the super-Eddington accretion model and the runaway stellar collision model. Specifically, we adopt more realistic situations for each model than those in previous works in order to examine the validity of the models.
In Chapter 2, in the context of the direct collapse model, we work on the formation of SMSs via rapid gas accretion, in order to see whether UV feedback can be effective to halt the growth of the accreting SMS. In Hosokawa et al. (2013), they consider SMS evolution with constant high accretion rates ≳ 0.1 M⊙ and show that the protostar becomes supergiant with a bloating, low temperature surface of Teff ∼ 5000 K and that UV feedback is ineffective. By contrast, we study
the SMS evolution with a highly time-variable accretion history, expected for accretion through a gravitationally unstable disk, where fragments form by fragmentation and fall on to the central protostar causing accretion bursts. We use a stellar evolution code STELLAR which can solve basic equations of stellar evolution, treating nuclear reactions and convection within the star (Yorke & Bodenheimer 2008). The evolutions of the accreting SMSs are computed, assuming episodic accretion histories for which we use parameters to mimic the variable features of the accretion. We compare our results with those for the constant accretion case to examine the impact of the episodic accretion histories on the evolution of the SMSs. We also vary episodic accretion histories by changing values of the parameters and see the variation of the SMS evolution. Finally, the efficiency of UV feedback is discussed.
In Chapter 2, we assume rather idealized, parameterized episodic accretion histories with ana-lytical functions. In Chapter 3, as the next step, we examine stellar evolution with more realistic
11 1.3 Aim of this thesis
accretion histories. We first perform a 2D hydrodynamical simulation using a grid-based code ZEUS-2D (Stone & Norman 1992) to follow the protostellar accretion, adopting a central sink cell to monitor the accretion history for the central protostar. A gravitationally unstable disk around a rapidly accreting SMS is analyzed, focusing on the properties of fragments and the difference from a disk forming around a Pop III star, as studied in Vorobyov, DeSouza & Basu (2013). We then compute stellar evolution using the obtained accretion history in a post-process manner. The UV feedback efficiency is again discussed.
In Chapter 4, we examine the impact of a high-luminosity central source of L > LEdd on a
very rapid, spherical accretion flow at large radii, using 1D radiation hydrodynamical simulations with a code ZEUS (Stone & Norman 1992), to see whether or not hyper-Eddington accretion can also occur as in IHO16. Because of the computational difficulty to follow the entire accretion regions, we only focus on the large scale regions where BH gravity is comparable to accreting gas pressure and do not resolve smaller scales where photon trapping is effective and photosphere is formed. In the ZEUS code, as well as the basic hydrodynamical equations, non-equilibrium chemical reactions of primordial gas and radiation transfer are solved. We model the analytical functions of luminosity coming from a central source, or, a nuclear accretion disk, which can emit a super-Eddington luminosity of L≳ LEdd, with a parameter of the maximum luminosity. From the
simulations, BH accretion histories are derived to see whether the transition to the hyper-Eddington accretion occurs. We also see the variation of the histories when adopting different values of the maximum luminosity. We then discuss the results to explain the behavior of the histories using analytical arguments and a simple numerical model.
In Chapter 5, we perform direct-tree hybrid N-body simulations to follow evolution of several dense star clusters, which are assumed to form in atomic-cooling halos identified in cosmological SPH simulations. In contrast to the work by Katz, Sijacki & Haehnelt (2015) who consider a cluster formed in a mini-halo and focus on one realization, we consider clusters formed in an atomic-cooling halo and focus on several realizations. In this work, we will examine if runaway stellar collisions and IMBH formation are prevalent in primordial star clusters forming in atomic-cooling halos. First, we perform the cosmological simulations using a code Gadget-2 (Springel 2005) which is updated by Hirano et al. (2014) to get several atomic-cooling halo data. Then, star cluster initial conditions for the N-body simulations are generated, assuming parameters relating to star formation efficiency, an initial mass function (IMF) and a virial ratio which is the ratio of kinetic energy to gravitational energy of the clusters. From the initial conditions, we perform the N-body simulations using a code BRIDGE (Fujii et al. 2007). We also investigate the dependence of the parameters for the star cluster generation on the results.
Chapter 2
Primordial supermassive star formation via
episodic accretion: I. Controlled cases with
model accretion histories
2.1
Overview
We study stellar evolution of supermassive stars (SMSs) growing by rapid mass accretion in atomic-cooling halos. We show the assumed physical conditions of the atomic-atomic-cooling halo in Table 1.3 where SMSs are supposed to be formed in contrast to normal Pop III star formation in mini-halos (see Table 1.4). Although constant accretion rates are often assumed in previous works, which is a rather idealized assumption, we here examine the impact of time-dependent mass accretion of repeating burst and quiescent phases which is expected to occur with a self-gravitating circumstellar disk. Our calculations show that protostars growing via episodic accretion can substantially contract in the quiescent phases, in contrast to the constant mass accretion case, whereby the star expands roughly monotonically. Accordingly, the stellar effective temperature and ionizing photon emissivity increase, which can trigger strong ionizing feedback and suppress the mass accretion. With a fixed duration of the quiescent phase ∆tq, the contraction occurs in early evolutionary phases, i.e., when
M∗ ≲ 103 M⊙ with ∆tq ≃ 103 yr. For later epochs and larger masses with the same ∆tq, stellar
contraction is negligible even during quiescent phases. In the case with larger ∆tq, however, the star
continues to contract in quiescent phases even for the higher stellar masses. We find that this stellar behavior is well understood by comparing the interval time between bursts ∆tq and the thermal
time for a bloated surface layer. We conclude that the stellar radiation feedback becomes effective if ∆tq ≳ 103 yr. Such a long interval time is possible in an accretion disk forming in the direct collapse
model.
2.2
Numerical method and modeling of episodic accretion
2.2.1
Stellar evolution code for accreting stars
We use the stellar evolution code STELLAR developed by Yorke & Bodenheimer (2008) to calculate evolution of accreting massive protostars. The basic equations are
∂r ∂m =
1
13 2.2 Numerical method and modeling of episodic accretion
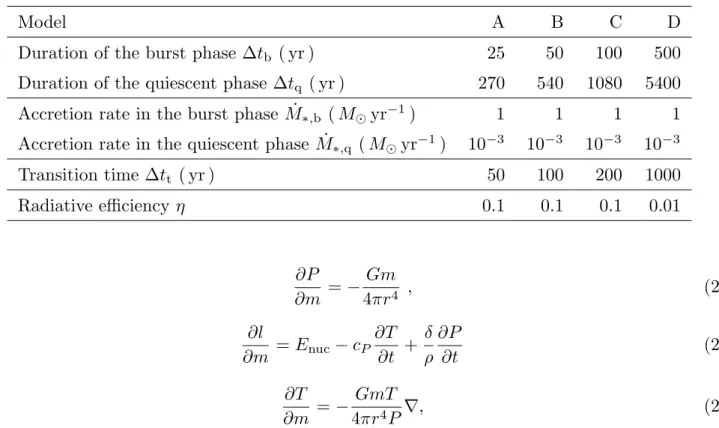
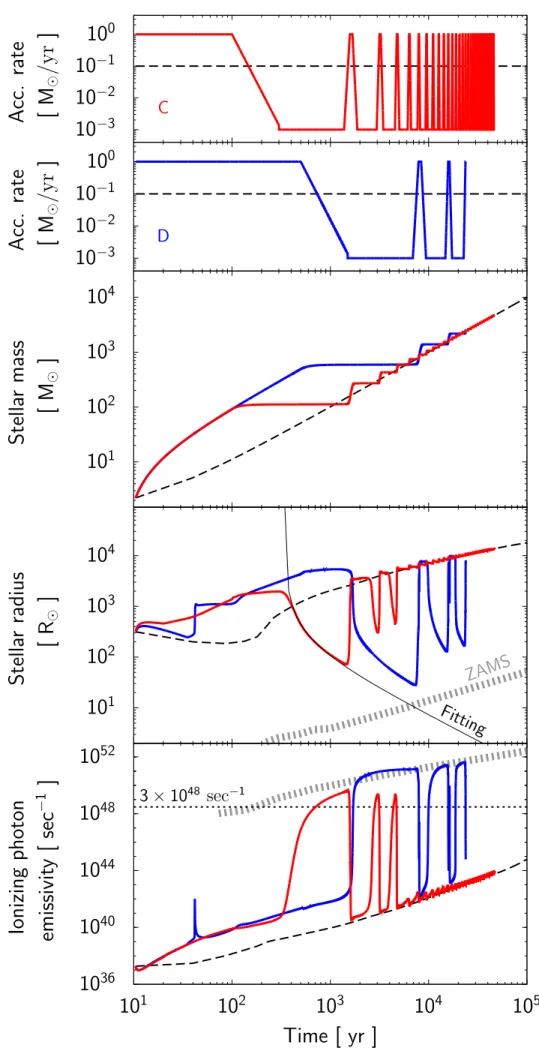
Table 2.1 Models of episodic accretion. The average accretion rates are 0.1 M⊙yr−1. The table is taken from Sakurai et al. (2015).
Model A B C D
Duration of the burst phase ∆tb ( yr ) 25 50 100 500
Duration of the quiescent phase ∆tq ( yr ) 270 540 1080 5400
Accretion rate in the burst phase ˙M∗,b ( M⊙yr−1) 1 1 1 1 Accretion rate in the quiescent phase ˙M∗,q ( M⊙yr−1) 10−3 10−3 10−3 10−3
Transition time ∆tt ( yr ) 50 100 200 1000 Radiative efficiency η 0.1 0.1 0.1 0.01 ∂P ∂m =− Gm 4πr4 , (2.2) ∂l ∂m = Enuc− cP ∂T ∂t + δ ρ ∂P ∂t (2.3) ∂T ∂m =− GmT 4πr4P∇, (2.4)
where m is the enclosed mass, r is the radial distance from the center, ρ is the density, P is the total pressure, l is the net energy flux, Enuc is the net energy generation rate by nuclear fusion, cP is the
specific heat at constant pressure, T is the temperature, δ≡ (∂ ln ρ/∂ ln T )P and ∇ ≡ ∂ ln T/∂ ln P
is the temperature gradient. The temperature gradient ∇ is computed using the mixing-length theory for convective regions (see e.g., Kippenhahn, Weigert & Weiss 2012). The nuclear reactions of hydrogen and helium burning are included in the rate Enuc.
We assume hydrostatic equilibrium in equation (2.2) and omit the inertial term. The assumption is valid since the dynamical time in the stellar interior is much shorter than the duration of temporal change in accretion rates ∼ 10 yr (see ∆tt in Table 2.1). We retain the time derivatives in equation
(2.3) and allow deviation from thermal equilibrium.
Mass accretion onto a stellar surface is included in the code by adding mass ˙M ∆t to the outermost
grid in each time step. We assume that the accreting gas is thermally adjusted to the atmosphere before accretion, e.g., when slowly orbiting in a circumstellar disk. In this case the physical quantities of newly accreting gas are the same as in the stellar atmosphere. Note that the gas can actually bring additional energy which comes from released gravitational energy into the stellar surface region. We treat the effect by adding the advected energy to the stellar luminosity. The advected energy L∗,acc is expressed using a parameter η as the fraction of released gravitational energy,
L∗,acc= ηGM∗ ˙
M∗
R∗ . (2.5)
The adopted values of η are summarized in Table 2.1. As explained in Hosokawa et al. (2013) the stellar evolution is not changed by varying η for M∗ ≳ 100 M⊙.
The initial stellar structure is constructed by solving the Lane-Emden equation with a polytropic index of n = 1.5 which means that the star is initially fully convective. The initial model has mass 2 M⊙ and a radius 25 R⊙. The choice of the initial model is rather arbitrary, but the subsequent stellar evolution is insensitive to the initial condition for M∗ ≳ 100 M⊙. We assume that the composition of the initial star and the accreting material is X = 0.72 and Y = 0.28.
Chapter 2 SMS formation via parametrized episodic accretion 14
2.2.2
Modeling of episodic accretion
Hydrodynamical simulations of a gravitationally unstable disk show that the accretion rate becomes episodic repeating alternately bursty and quiescent phases. For example, a burst occurs when a fragment emerging by gravitational instability migrates toward the central protostar to be accreted (Vorobyov, DeSouza & Basu 2013). Such a burst is usually followed by a quiescent phase at which the accretion rate becomes moderate. Another burst is triggered when another fragment forming in the gravitationally unstable disk again falls on to the star. The tendency of the burst accretion will continue while the disk self-gravity is effective by mass growth of the disk from a surrounding envelope.
We model episodic accretion histories using parameters. The burst and quiescent modes of the accretion are characterized by constant accretion rates ˙M∗,b and ˙M∗,q, respectively. The durations of these phases are set by ∆tb and ∆tq. We also assume that the transition time between bursty
and quiescent phases ∆tt is finite. The accretion rate during the transition phase is determined by
linear interpolation.
We examine four different episodic accretion models with different sets of the parameters as listed in Table 2.1. The values are chosen so that the average accretion rates become 0.1 M⊙yr−1 which is an expected value for the direct collapse model. For the other parameters, typical values are inferred in the analytical and numerical studies. Hydrodynamical simulations suggest that the durations of burst and quiescent phases are 10 yr ≲ ∆tb ≲ 200 yr and ∆tq ≲ 104 yr respectively, though these
values are for normal Pop III star formation cases (e.g., DeSouza & Basu 2015, Vorobyov, DeSouza & Basu 2013). An analytical arguments of Inayoshi & Haiman (2014) also suggests ∆tq≲ 104 yr for
SMS formation cases (see their figure 2). As to values of ˙M∗,b and ˙M∗,q, the numerical simulations usually show that the ratio of the two accretion rates ˙M∗,b/ ˙M∗,q ∼ 103 − 104. Thus we choose the values ˙M∗,b = 1 M⊙yr−1 and ˙M∗,q = 10−3 M⊙yr−1 so that the average rate becomes 0.1 M⊙yr−1. Note that the latter value is below the critical accretion rate ˙M∗,cr∼ 0.04 M⊙yr−1. The transition time ∆tt is expected to be comparable to ∆tb as is seen in the numerical simulations. We assume
finite transition times with ∆tb = 2∆tt < ∆tq, where the specific value is chosen to achieve numerical
stability. We have checked that the effect of varying ∆tt by a factor of a few on the results is small.
We compare the results of the four models with the same mean accretion rate 0.1 M⊙yr−1. We regard the Model C in Table 2.1 as a fiducial case (Section 2.3.2.1). The evolutionary calculations are commenced at burst phases.
2.3
Results
2.3.1
Evolution by constant accretion rates
We briefly describe the cases with constant accretion rates to compare to episodic accretion cases. 2.3.1.1 Normal Pop III star formation case with 10−3 M⊙yr−1
In the typical case of an accretion rate 10−3 M⊙yr−1, a protostar grow with several distinct evo-lutionary stages. To understand the behavior of the stellar evolution the two time scales are useful (Stahler, Palla & Salpeter 1986, Omukai & Palla 2003, Hosokawa & Omukai 2009a): the Kelvin-Helmholtz (KH) time scale
tKH =
GM2
∗
15 2.3 Results
which is the thermal time over which the gravitational energy is released by radiation, and the accretion time scale
tacc =
M∗
˙
M∗, (2.7)
which is the characteristic stellar growth time. In the early evolutionary phases of M∗ ≲ 5 M⊙, the star evolves adiabatically with tacc < tKH. As the star grows by mass accretion and the stellar
luminosity L∗ becomes larger, the KH time scale shortens. The luminosity increases because the opacity deep in the star decreases as the temperature increases according to Kramers’ law (κ ∝
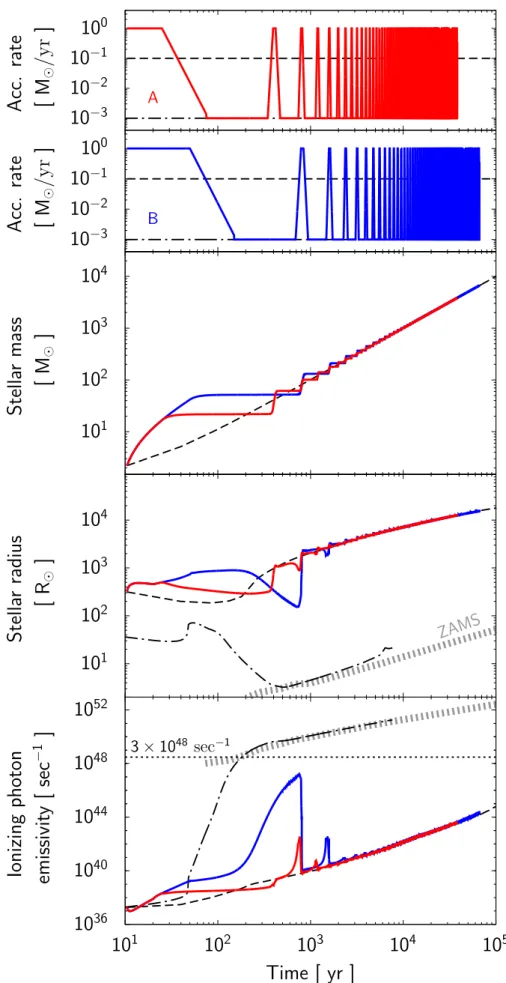
ρT−3.5). With the decrease of the opacity, the heat accumulated in the inner region gradually escapes outward by radiation energy transport. The KH time finally becomes shorter than the accretion time and the protostar begins to contract losing more energy away from the surface by radiation. The KH contraction phase starts when M∗ ≳ 8 M⊙ for the case of ˙M∗ = 10−3 M⊙yr−1, which can be seen in Figure 2.1. The stellar internal temperature rises during the KH contraction phase, and eventually hydrogen burning commences at the center when M∗ ≃ 40 M⊙. After this time, the evolution of the stellar radius traces the mass-radius relation of a ZAMS star.
Figure 2.1 shows that the ionizing photon emissivity rapidly rises during the KH contraction. Before the contraction, the emissivity is only ∼ 1037 s−1. As the star contracts and the surface temperature increases, the emissivity quickly rises to≳ 1049 s−1. With the large amount of emitting UV photons, radiation hydrodynamic simulations show that the radiation feedback is effective in the late KH contraction stage and finally suppresses the mass accretion (e.g., Hosokawa et al. 2011). 2.3.1.2 Direct collapse case with 0.1 M⊙yr−1
We consider evolution of a protostar with the high constant accretion rate of 0.1 M⊙yr−1. Unlike the normal Pop III star formation case of 10−3 M⊙yr−1, the protostar does not experience KH contraction (see the black dashed lines in Figure 2.1). Instead, the overall evolution is that the star continues to expand nearly monotonically as the mass increases.
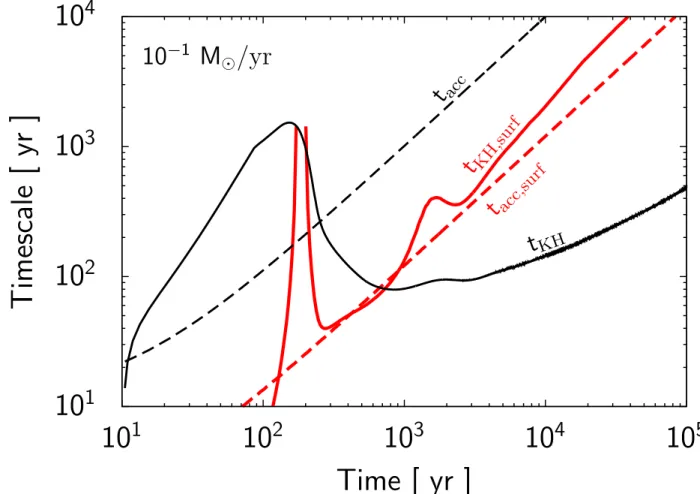
The Figure 2.2 shows that the time scale inversion explained in Section 2.3.1.1 occurs at M∗ ≃ 22 M⊙ (t ≃ 200 yr) in this case. The star evolves adiabatically before this point. In the adiabatic epoch, the stellar radius at a given mass is larger than for 10−3 M⊙yr−1 since the rapid accretion of 0.1 M⊙yr−1 enhances average entropy in the inner region of the star. Unlike the normal Pop III case, the protostar continues to expand even when tKH< tacc, which at a glance is counterintuitive:
with the time scale imbalance, a star normally radiates internal energy through the surface and contracts. Actually, for this bloating phase most of the stellar interior contracts, while only the surface layer with newly accreting gas inflates due to absorption of the heat flux coming from the contracting inner region (Hosokawa, Omukai & Yorke 2012). Specifically, though the bloating surface layer contains a small fraction of the total stellar mass, the opacity at the layer is large due to H− bound-free absorption. The opacity of H− has a very strong temperature dependence which makes the stellar effective temperature locked at a constant value of≃ 5000 K as in the case of red giants. Using Teff ≃ 5000 K and L∗ = 4πR2∗σSBTeff4 ≃ LEdd where σSB is the Stefan-Boltzmann constant
and LEdd is the Eddington luminosity, we get the mass-radius relation during the bloating phase
R∗ ≃ 2.4 × 10³ R⊙ ( M∗ 100 M⊙ )1/2 , (2.8)
which is consistent with the numerical results (Hosokawa et al. 2013).
The evolution of ionizing photon emissivity is also different to the case of 10−3 M⊙yr−1. Even when M∗ ≳ 100 M⊙, the emissivity is very small because of the low surface temperature of the
Chapter 2 SMS formation via parametrized episodic accretion 16
10
−310
−210
−110
0Acc.
rate
[
M
⊙/
yr
]
A10
−310
−210
−110
0Acc.
rate
[
M
⊙/
yr
]
B10
110
210
310
4Stella
r
mass
[
M
⊙]
10
110
210
310
4Stella
r
radius
[
R
⊙]
ZAMS10
3610
4010
4410
4810
5210
110
210
310
410
5Ionizing
photon
emissivit
y
[
sec
− 1]
Time [ yr ]
3× 1048 sec−1Fig. 2.1 Evolution of the accretion rates (top two panels), stellar mass (third panel), stel-lar radius (fourth panel), and ionizing photon emissivity (bottom panel). The red and blue lines in each panel represent Model A and B (Table 2.1). Evolution for constant accretion rates of 0.1 M⊙yr−1 and 10−3 M⊙yr−1 are also shown by the black dashed and dot-dashed lines respectively. The black dot-dashed lines for 10−3 M⊙yr−1 in the bottom two panels are horizontally shifted so that the line of the mass increase matches that for 0.1 M⊙yr−1, e.g., M∗= 100 M⊙ at the time of 103 yr. The radii and ionizing photon emissivity for ZAMS stars are also shown by the thick gray dashed lines, where ZAMS mass is translated to time by the relation of t = MZAMS/0.1 M⊙yr−1. In the bottom panel, the horizontal dotted line
repre-sents the critical value of ionizing photon emissivity above which UV feedback would become significant for the accretion rate 0.1 M⊙yr−1 (see Section 2.4.1). This figure is reproduced from Sakurai et al. (2015).
17 2.3 Results
10
1
10
2
10
3
10
4
10
1
10
2
10
3
10
4
10
5
Timescale
[
yr
]
Time [ yr ]
t
KH ,surft
acc ,surft
KHt
acc10
−1M
⊙/yr
Fig. 2.2 Evolution of the time scales for the constant accretion case of 0.1 M⊙yr−1. The KH time tKH (black solid) and accretion time tacc (black dashed) as in equations (2.6) and (2.7)
are plotted respectively. The local KH time tKH,surf (red solid) and accretion time tacc,surf
(red dashed) as in equations (2.9) and (2.10) are also plotted. This figure is reproduced from Sakurai et al. (2015).
protostar. UV feedback is then too weak to stop the rapid accretion (see Section 2.4.1).
We have found that despite the time scale imbalance tKH < tacc, the protostar continues to inflate.
We can explain the apparent discrepancy by noticing the fact that the usual KH time scale tKH in
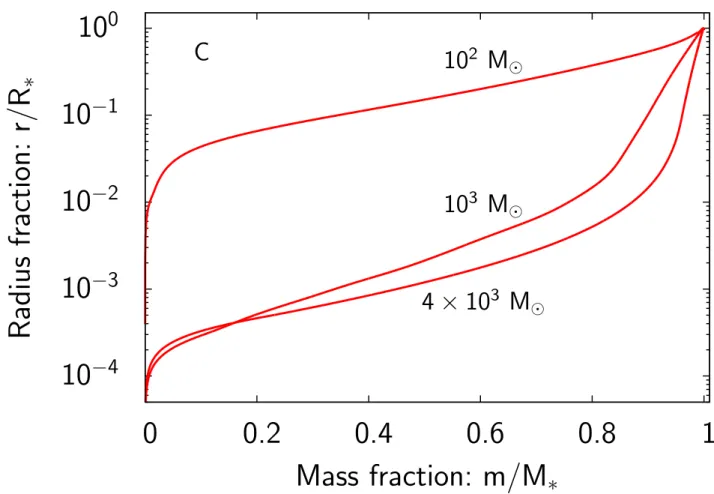
equation (2.6) is a global quantity which does not takes into account the internal structure of the star. In the stellar interior, most of the mass is concentrated in the central region and the bloating surface region has a small fraction of the stellar mass (see fig. 2 in Hosokawa et al. (2013)). We thus define the local KH time scale for the surface layer which is evaluated considering the actual mass distribution in the star,
tKH,surf = f
∫
srad∫ T dm
dl , (2.9)
where sradis entropy of radiation and f is a dimensionless constant ofO(1). The time scale is deemed
as a surface KH time scale since the numerator corresponds to the thermal energy in the surface region and the denominator corresponds to the energy flux in the same region, which is in analogy with the usual definition tKH in equation (2.6). The factor f is introduced assuming that only a
fraction of the surface energy is radiated away over the time scale. Note that the surface KH time scale tKH,surf does not match tKH even if we integrate over whole star because of the inhomogeneous
Chapter 2 SMS formation via parametrized episodic accretion 18
time scale for the surface region
tacc,surf = f
∫ dm
˙
M∗ . (2.10)
For consistency, the same factor f is also included in equation (2.10). We set f = 0.4 as a fit to our numerical results and the range of integration 0.7 M∗ ≤ m ≤ M∗ in equations (2.9) and (2.10) to cover the surface layer. We have checked that the choice of the lower limit of the integration does not significantly affect the main results. In Figure 2.2 we show that the local accretion time scale
tacc,surf continues to be shorter than the local KH time scale tKH,surf even when the global time
scales satisfies tKH < tacc. The star keeps expanding because, with the rapid mass accretion, gas
accumulates faster than heat escapes by radiation in the surface layer. We will show that the two local time scales tKH,surf and tacc,surf can be used for understanding stellar evolution via episodic
accretion.
2.3.2
Stellar evolution via episodic accretion
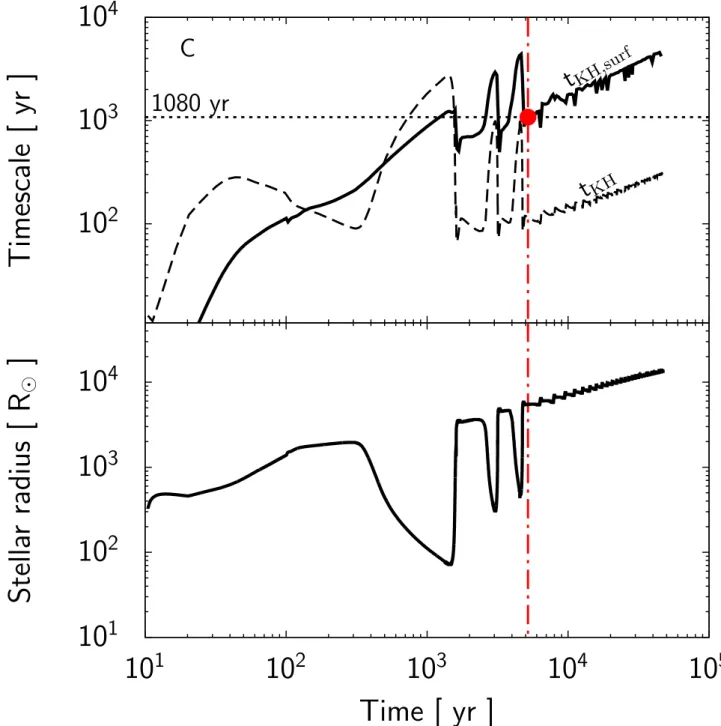
2.3.2.1 The fiducial case: Model C
We first focus on the Model C as a fiducial case of stellar evolution via episodic accretion. In this model, the accretion rates in the burst and quiescent phases are M˙∗,b = 1 M⊙yr−1 and M˙∗,q = 10−3 M⊙yr−1 with time durations of ∆tb = 100 yr and ∆tq = 1080 yr (Table 2.1). The accretion
history is plotted in the top panel of Figure 2.3. The protostellar evolution is also shown in Figure 2.3, where there are differences from the case with the constant accretion rate 0.1 M⊙yr−1. Firstly, the star shrinks during the quiescent phases. For instance, when 300 yr ≲ t ≲ 1500 yr the stellar radius decreases to 100 R⊙ which is about 10 times smaller than the supergiant protostar with the constant accretion of M˙∗ = 0.1 M⊙. In addition, the stellar contraction leads to the increase of ionizing photon emissivity which eventually reaches the level for ZAMS stars.
Because the accretion rate during the quiescent phases is smaller than the critical rate for main-taining the star inflating ˙M∗,cr ≃ 0.04 M⊙yr−1, the star shrinks as in the normal KH contraction stage. To demonstrate this, we analytically derive an equation for the time evolution of the stellar radius assuming that the contraction continues over the usual KH time scale *1,
R∗ R⊙ = ( 1 R∗,0/R⊙ + C t− t0 1 yr 1 M∗/M⊙ )−1 , (2.11)
where C is a fitting parameter, and the quantities at the beginning of the contraction have the subscript 0. In the fourth panel of Figure 2.3, the fitting curve from equation (2.11) is plotted (black solid line) together with out numerical result.
The protostar again expands when the next burst accretion occurs and accordingly the ionizing photon emissivity decreases. The cycle of contraction and expansion is repeated for the following two cycles of quiescent and burst phases when 2000 yr≲ t ≲ 5000 yr. As the star gets more mass,
*1Using equation (2.6), the time derivative of the stellar radius is
dR∗ dt ∼ − R∗ tKH =−L∗R 2 ∗ GM2 ∗ .
The stellar luminosity is well approximated by the Eddington luminosity LEdd∝ M∗and the equation becomes
dR∗
dt =−const. ×
R2
∗
M∗.
Regarding the stellar mass almost constant during quiescent phases, integration of the equation gives equation (2.11).