A03
Seismic damage identification of a full-scale shaking table test structure
〇 Xiaodong Ji, Gregory L. Fenves, Kouichi Kajiwara, Masayoshi Nakashima 1. Introduction
A series of tests were implemented for a high-rise building structure by using E-Defense shaking table facilities. The test specimen had a realistic scale (8 m × 12 m × 21.9 m) and was heavily instrumented with more than 600 channel sensors. Various levels of damages were generated by the increasing levels of ground motions. The well-recorded data were expected to provide a promising benchmark platform to calibrate the effectiveness of vibration-based damage diagnosis approaches.
2. Shaking table test and seismic damage
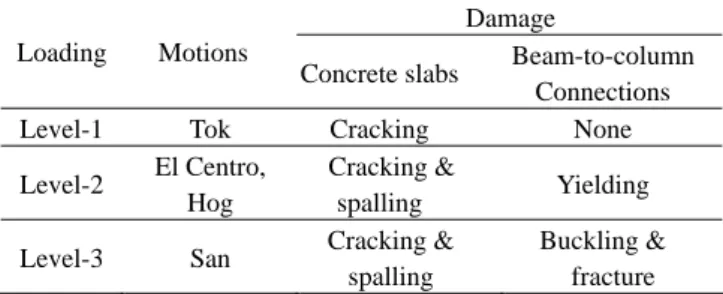
As shown in Figure 1, the test specimen consisted of a four-story steel moment frame that represents the lower portion of a prototype tall building and an equivalent rubber-damper-mass system that mimics the upper portion. The test sequence is given in Table 1. Four bi-directional ground motions were selected as the table input, which were classified with three levels. Table 1 also summaries the damage of the structure when subjected to these motions, existing in concrete slabs and beam-to-column connections. It is notable that the damage spread to all floors.
Figure 1. Overview of test specimen. Table 1. Summary of loading program and damage.
Damage Loading Motions
Concrete slabs Beam-to-column Connections
Level-1 Tok Cracking None
Level-2 El Centro, Hog
Cracking &
spalling Yielding Level-3 San Cracking &
spalling
Buckling & fracture
3. Changes in dynamic properties
Before and after each ground motion, a bi-directional
low-magnitude Gaussian white noise was applied to the table to excite the specimen. Using both the frequency response function (FRF) curve fitting method and the autoregressive with exogenous term (ARX) method, dynamic properties of the specimen were extracted from the recorded floor accelerations. Given the undamaged state as the reference, the changes in dynamic properties were quantified after various levels of damage. As shown in Figure 2, the damage induced obvious frequency decreases, which reached 4.1%, 5.4% and 11.9% on the average after Level-1, -2 and -3, respectively. The identified mode shapes were plotted in Figure 3, which indicates that neither low- nor high-order mode shapes altered significantly. After Level-1, -2 and -3, the modal assurance criterion (MAC) for the seven modes were estimated as 0.999, 0.997 and 0.993 on the average.
Mode 1 Mode 2 Mode 3 Mode 4 Mode 5 Mode 6 Mode 7
Figure 2. Decrease of natural frequencies compared with the undamaged state in longitudinal direction.
Figure 3. Mode shapes for different states in longitudinal direction.
4. Conclusions
(1) The test specimen sustained significant seismic damage that spread to the entire structure.
(2) The seismic damage resulted in severe stiffness loss, which induced significant frequency decreases. But the distributed damage altered mode shapes very slightly, which is difficult to distinguish.