C11
Prediction of Flood/Debris Flow Hydrograph Due to Landslide Dam Failure by Overtopping and
Sliding
〇Ripendra Awal, Hajime Nakagawa, Kenji Kawaike, Yasuyuki Baba and Hao Zhang
In the event of catastrophic failure of landslide dam, we have to predict resulting outflow hydrograph. It will serve as an upstream boundary condition for subsequent flood routing to predict flood hazard in the downstream. Most of the existing models are applicable to overtopping failure of landslide dam. In this context, an attempt has been made to incorporate integration of three separate models to predict the outflow hydrograph resulted from failure of landslide dam by overtopping and sudden sliding. The main advantage of an integrated model is that it can detect failure mode due to either overtopping or sliding based on initial and boundary conditions.
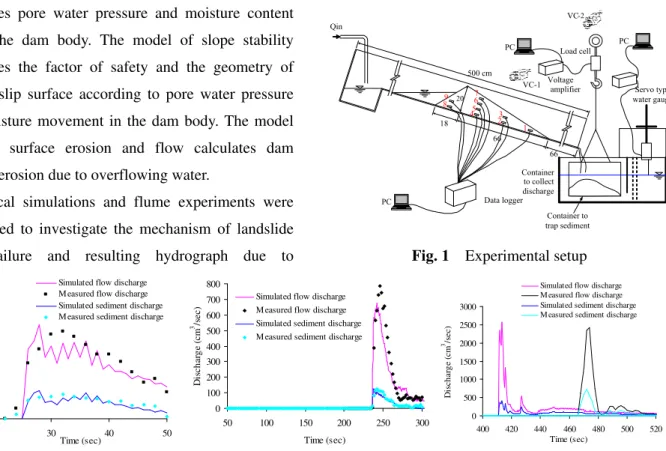
The integrated model to predict outflow hydrograph consists of three models. The seepage flow model calculates pore water pressure and moisture content inside the dam body. The model of slope stability calculates the factor of safety and the geometry of critical slip surface according to pore water pressure and moisture movement in the dam body. The model of dam surface erosion and flow calculates dam surface erosion due to overflowing water.
Numerical simulations and flume experiments were performed to investigate the mechanism of landslide dam failure and resulting hydrograph due to
overtopping and sudden sliding. Following three cases are considered: (I) Overtopping (from full channel width) (II) Overtopping and channel breach (from partial channel width) and (III) Sudden sliding. The schematic diagram of the flume is shown in Fig. 1. The proposed model is tested for three different experimental cases of landslide dam failure due to overtopping and sliding and reasonably reproduced the resulting hydrograph as shown in Fig. 2, Fig. 3 and Fig.4. The numerical simulation and experimental results of movement of moisture in the dam body, predicted critical slip surface and time to failure of the dam body are also in good agreement. The model can be further extended to three-dimensions for the better representation of failure process of landslide dam.
amplifier 500 cm 18 66 20 PC Data logger VC-1 Qin Voltage Load cell PC Container to collect discharge VC-2 PC Servo type water gauge Container to trap sediment 89 45 6 7 1 23 66
Fig. 1 Experimental setup
0 500 1000 1500 2000 2500 20 30 40 50 Time (sec) D is c h a rg e ( c m 3 /s e c )
Simulated flow discharge M easured flow discharge Simulated sediment discharge M easured sediment discharge
0 100 200 300 400 500 600 700 800 50 100 150 200 250 300 Time (sec) D is c h a rg e ( c m 3 /s e c )
Simulated flow discharge M easured flow discharge Simulated sediment discharge M easured sediment discharge
0 500 1000 1500 2000 2500 3000 400 420 440 460 480 500 520 Time (sec) D is c h a rg e ( c m 3/s e c )
Simulated flow discharge M easured flow discharge Simulated sediment discharge M easured sediment discharge