Competitiveness of the knitwear industry in Bangladesh : a study of industrial development amid global competition
著者 Bakht Zaid, Salimullah Md., Yamagata Tatsufumi, Yunus Mohammad
権利 Copyrights 日本貿易振興機構(ジェトロ)アジア
経済研究所 / Institute of Developing
Economies, Japan External Trade Organization (IDE‑JETRO) http://www.ide.go.jp
journal or
publication title
IDE Discussion Paper
volume 169
year 2008‑10‑01
URL http://hdl.handle.net/2344/788
INSTITUTE OF DEVELOPING ECONOMIES
IDE Discussion Papers are preliminary materials circulated to stimulate discussions and critical comments
IDE DISCUSSION PAPER No. 169
Competitiveness of the Knitwear Industry in
Bangladesh: A Study of Industrial Development amid Global Competition
Zaid Bakht, Md. Salimullah, Tatsufumi Yamagata, and Mohammad Yunus
October 2008
Abstract: This paper assesses the technical efficiency and profitability of the knitwear industry in Bangladesh taking into account the sector’s role in poverty reduction. While stochastic frontier analysis was invoked to assess technical efficiency, three alternative measures, namely the rate of return, total factor productivity and the Solow residual, were used to gauge the extent and determinants of the profitability of the industry based on firm-level data collected in 2001. The estimation results indicate the high profitability of the knitwear firms. In Bangladesh, the dynamic development of the industry has entailed great diversity in efficiency in comparison with the garment industries of other developing countries. While there is a significant scale effect in profitability and productivity, no supporting evidence was found for the positive impact on competitiveness of industrial upgrading in terms of usage of expensive machinery and vertical integration and industrial agglomeration.
Keywords: Bangladesh, knitwear, poverty reduction, productivity, profitability, stochastic frontier analysis
JEL classification: D24, J31, L67, O14, O53
The Institute of Developing Economies (IDE) is a semigovernmental, nonpartisan, nonprofit research institute, founded in 1958. The Institute merged with the Japan External Trade Organization (JETRO) on July 1, 1998.
The Institute conducts basic and comprehensive studies on economic and related affairs in all developing countries and regions, including Asia, the Middle East, Africa, Latin America, Oceania, and Eastern Europe.
The views expressed in this publication are those of the author(s). Publication does not imply endorsement by the Institute of Developing Economies of any of the views expressed within.
INSTITUTE OF DEVELOPING ECONOMIES (IDE), JETRO 3-2-2, WAKABA,MIHAMA-KU,CHIBA-SHI
CHIBA 261-8545, JAPAN
©2008 by Institute of Developing Economies, JETRO
No part of this publication may be reproduced without the prior permission of the IDE-JETRO.
Competitiveness of the Knitwear Industry in Bangladesh:
A Study of Industrial Development amid Global Competition
*Zaid Bakhta, Md. Salimullaha, Tatsufumi Yamagatab, and Mohammad Yunusa
October 2008
Abstract
This paper assesses the technical efficiency and profitability of the knitwear industry in Bangladesh taking into account the sector’s role in poverty reduction. While stochastic frontier analysis was invoked to assess technical efficiency, three alternative measures, namely the rate of return, total factor productivity and the Solow residual, were used to gauge the extent and determinants of the profitability of the industry based on firm-level data collected in 2001. The estimation results indicate the high profitability of the knitwear firms. In Bangladesh, the dynamic development of the industry has entailed great diversity in efficiency in comparison with the garment industries of other developing countries. While there is a significant scale effect in profitability and productivity, no supporting evidence was found for the positive impact on competitiveness of industrial upgrading in terms of usage of expensive machinery and vertical integration and industrial agglomeration.
Key words: Bangladesh, knitwear, poverty reduction, productivity, profitability, stochastic frontier analysis
JEL classifications: D24, J31, L67, O14, O53
* The authors are grateful to the officials of the Bangladesh Knitwear Manufacturers and Exporters Association for providing generous cooperation and to the field survey team for the onerous task of collecting data for this study. Comments given by Jagdish Bhagwati, Masahisa Fujita and Anders Isaksson, among others, were extremely useful. The authors acknowledge the assistance of the Japan Keirin Association which funded part of this research. One of the authors, Tatsufumi Yamagata, is highly grateful to Kazuhiko Ito for continuous guidance on the knitwear industry in Bangladesh.
a Bangladesh Institute of Development Studies, Dhaka, Bangladesh.
b Institute of Developing Economies, Chiba, Japan. E-mail: [email protected].
1. Introduction
For some low-income countries, exports of labor-intensive manufactured goods have held out the promise of economic growth and poverty reduction (World Bank, 1990; Sachs, 2005). During the last two and a half decades, Bangladesh has succeeded in developing an export-oriented garment industry, facilitated by the Multi-Fiber Arrangement (MFA) that came into effect in 1973. Because exports of garments account for nearly three quarters of the total export earnings of Bangladesh, there have been serious concerns over whether the industry would survive the post-MFA onslaught of competition. Further, the sector accounts for the employment of two million unskilled and semi-skilled workers. Most of them are female and have migrated to urban areas from the countryside. Fortunately, the industry seems to have withstood the challenges that have confronted it, and has performed well, with double-digit growth in exports of garments to the United States since the phasing out of the MFA in 2005.
The industry’s contribution to exports and the abundant employment opportunities for female workers without high educational backgrounds have been studied intensively. See, for example, Paul-Majumder (2003), Kabeer and Mahmud (2004), and Siddiqi (2004), and the references cited in these works. On the other hand, only a few studies have analyzed the production side of the industry. Some of these studies used published data, while others were based on data collected by means of tailor-made questionnaires. See for instance, Salim (1999), Hassan (2000), Quddus and Rashid (2000), Zohir (2003), Kee (2005) and Fukunishi et al. (2006). However, most of these studies except Kee (2005) and Fukunishi et al. (2006) used small data samples that were not adequate for statistical analyses capable of taking into account the diverse nature of the knitwear industry.1
Initially, Bangladesh developed woven garments on the basis of an upstream process that involved spinning and weaving. Production of knitwear for exports started much later but then grew rapidly. Besides sweaters and socks, the major output of the knitwear industry involves two processes, namely the knitting of fabric and the making of knitwear using the fabric thus knitted. Production of knit fabric in Bangladesh
1 The World Bank’s Investment Climate Surveys are another important source of information on sector-wise productivity and profitability (see http://rru.worldbank.org/InvestmentClimate).
expanded rapidly following the introduction in 1995 of the European Union’s (EU) stricter Rules of Origin (RoO), that require greater backward linkage to meet the terms of its Generalized System of Preferences (GSP) facility.
What explains the successful performance of the garments industry in Bangladesh? What are the sources of the industry’s competitive strength? How is the structure of the industry linked to productivity differentials within the manufacturing sector? This paper attempts to answer these questions by focusing on Bangladesh’s knitwear industry. To obtain the information needed to carry out the study, in 2001 we collected relevant data from 232 firms and used these data to supplement those provided by Kee (2005) and Fukunishi et al. (2006). Our data contain more information than Kee’s and Fukunishi’s on production processes and on the machinery used in the knitwear industry. The sample firms, by and large, exhibit all the main features that characterize the Bangladeshi knitwear industry. Almost all of the sample firms are located in the principal centers of knitwear production in the districts of Dhaka, Gazipur, and Narayanganj.
The paper is organized as follows. After the Introduction, Section 2 provides an overview of the knitwear industry in Bangladesh. In particular, the section examines data on laborers’ wages, and analyzes the implications of the wage structure from the perspective of poverty reduction. Section 3 introduces an analytical model for examining productivity and profitability in the industry, while Section 4 presents and interprets the empirical results. The final section presents our conclusions.
2. Some Features of the Knitwear Industry in Bangladesh
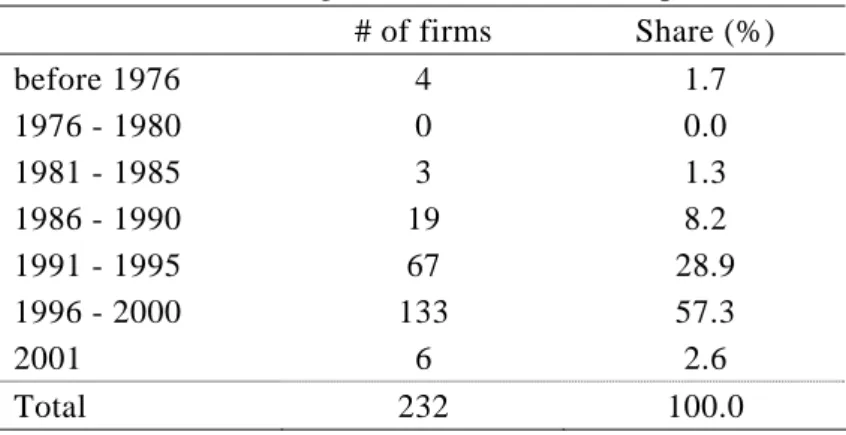
The knitwear industry of Bangladesh is characterized by several distinct features. Most of the manufacturers are located in the principal centers of knitwear production in Chittagong, and in suburban Dhaka, Gazipur, and Narayanganj districts outside the Export Processing Zones (EPZs). Thus, most of these enterprises are outside the “enclave” environments provided for EPZ enterprises in Bangladesh. In the ready-made garments sector, the knitwear firms tend to be of recent origin. The Bangladesh Institute of Development Studies and the Institute of Developing Economies, Japan, jointly undertook a field survey of 232 knitwear producing firms2 in
2 The sample firms are members of the Bangladesh Knitwear Manufacturers and Exporters Association
2001 (see Bakht et al. (2007) for details). The data show that more than a half of the sample firms began knitwear production within five years or less of our survey being carried out. Knitwear manufacturers employ a large number of workers. A typical firm employs 245 workers with the largest company employing as many as 1,772.
The knitwear firms employ female operators and helpers who work under the supervision of male managers.3 Most observers agree that the ready-made garment industry is the first formal industry in Bangladesh to provide abundant employment opportunities for female and young workers (see, for instance, Zohir and Paul-Majumder, 1996; Siddiqi, 2004). In terms of the size of the employment that they provide, the knitwear and the woven garment industry have obviously contributed to poverty reduction in Bangladesh. What is relatively unclear is the level of the wages paid to the least paid workers in the industry. Studies by Khondker, Murayama and Rahman (1995), Zohir and Paul-Majumder (1996), and Kabeer and Mahmud (2004) report that the lowest paid workers, such as helpers, receive low wages, but ones that provide a substantially higher income than the alternative employment opportunities that are available to them.
Table 1 shows that in 2001, the average monthly earnings4 of helpers with a work experience of a year or less in the industry amounted to around Tk.1,000 (US$ 17.2). This is far below the international poverty line of US$ 1 per day. However, both the food and overall poverty lines in Dhaka, Bangladesh, for 2000 were Tk. 649 and Tk. 893 respectively (BBS, 2003) and thus the average earnings of the least experienced helpers are higher than the local poverty lines. Further, in 1999/2000, the average earnings of the least experienced helpers in the knitwear industry were still higher than those of both casual wage laborers and the self-employed in the farm sector of Bangladesh (Table 2). Viewed from this perspective, the knitwear industry has undoubtedly contributed to poverty reduction among people living in rural areas of
(BKMEA) which is an industrial association of knitwear producing firms.
3 The knitwear industry seems to employ more male workers than the woven garment industry, probably because firms in the former industry tend to incorporate a fabric-knitting section that is often operated overnight.
4 The earnings of an operator in the garment industry are usually based not only on the length of time the worker attends but also on how many pieces s/he processes. The interviewees were asked to estimate their average earnings taking into account both time rates and piece rates.
Bangladesh.
3. Frameworks for Estimation of Productivity and Profitability
In the context of the industry’s contribution to poverty reduction, it is essential to assess whether or not the knitwear industry of Bangladesh is internationally competitive. To that end, we analyzed productivity and profitability of the industry using (1) the stochastic production frontier, (2) the rate of return, and (3) total factor productivity.
Typical knitwear products such as T-shirts, polo shirts, knit underwear, and knit trousers are made in two processes, namely knitting fabrics from yarn, and making garments from knit fabrics. The standard method for knitting fabrics is to run a circular knitting machine loaded with yarn to produce fabrics, while the standard method for making garments from fabrics is to use an assembly line of sewing machines and operators. In addition, other types of knitwear, such as sweaters and socks, are made with different machines and different methods of production. As the share of the former category of knitwear production is dominant in terms of the number of factories involved, the following analyses focus on typical knitwear establishments that combine the two processes of knitting fabrics and making garments.
3.1.1 Production Frontier and Technical Efficiency
Let f denote the “fabrics knitting process” and g the “garments making process”.
In a typical firm, the gross output from the two processes
(
Xs :s= f,g)
is the sum of values of material(
Ms)
, and energy( )
Es , and value added( )
Vs :s s s
s M E V
X = + + . (1)
If the firm undertakes the two processes in-house, and if the fabrics produced in the upstream process are exclusively used in the garments making process, the gross output from the fabrics section is equal to the material inputs into the garment section: . For a composite firm which has the two processes in the same establishment,
(
, the value added for the firm is the sum of the value added in each of the two sectors.g
f M
X =
)
g f s= +
g f g
f V V
V + = + . (2)
It is thus obvious that
g f g f f g f g f f g g f g g g
g M E V X E V M E E V V M E V
X = + + ≡ + + ≡ + + + + ≡ + + + + (3)
As there are different opinions as to whether gross output or value added should be used as an indicator of output (Burnside, Eichenbaum and Rebelo, 1995), both variables are alternatively used to confirm the robustness of the results. Further, services of labor and capital are focused on, as the only factors of production. The following equations incorporate these assumptions:
( )
[
f g f g f g f g f g]
g
f F N h K h A
V + =min + + , + ,α + + , (4)
( ) ( )
[
f g f g f f M f g f g E]
g V M p E p
X =minβ + + ,γ ,δ + + , (5)
Here K, N, h, and A, denote respectively capital stock, the number of workers, the operation rate and the real estate on which the operation takes place. αf+g, βf+g,γf , andδf+gare parameters for the Leontief production function (see Bils and Cho, 1994).
For the empirical analyses developed in the next section, the following functions were used:
(
N h K h)
F
Vf+g = f+g f+g , f+g , (6)
(
N h K h)
F
Xg =βf+g f+g f+g , f+g , (7) with their log-linear approximations as:
(
f g)
k(
f g)
vl v g
f C N h K h u
V + = + ln + + ln + +
ln λ λ , (8)
(
f g)
k(
f g)
xl x g
f C N h K h u
X + = + ln + + ln + +
ln λ λ , (9)
where lnβf+g +Cv+uv =Cx+ux.
In order to estimate the stochastic production frontier, standard assumptions about the disturbances are made as follows: and are composite error terms containing the symmetric and two-sided disturbances,
uv ux
εF , and the firm-specific inefficiency,εE(see Kumbhakar and Lovell, 2000):
Eq Fq
uq =ε −ε ,
(
q=v,x)
(10)εFq~ iidN
(
0,σFq2)
, (11)εEq~ iidN+
(
0,σEq2)
, (12)where N+ denotes the non-negative half of normal distribution5. The statistical independence amongεFq,εEq, and the covariates is assumed. A conventional measure of technical efficiency for a firm i
(
TEi)
is as follows:)
6
(
EiTEi =exp −εˆ , (13)
( ) ( ( ) )
⎥⎦
⎢ ⎤
⎣
⎡ ⎟
⎠
⎜ ⎞
⎝
−⎛ Φ
= −
≡ σ
μ σ
μ σ μ φ σ
σ ε σ
ε i
i i E
F i Ei Ei
u u
u u
E 1
ˆ 2
2 2
, (14)
whereσ ≡ σF2 +σE2 andμ≡σE σF. The sample average of is a focal measure of technical efficiency for each firm of the industry, and can be used for comparison with respect to variation in efficiency with that of the same industry in other countries.
TEi
3.2.1 Rate of Return
Profits are a primary concern for owners of firms. High profits reflect more revenue and less costs, both of which may incorporate either a large amount of sales, high valuation of the product, or efficient production techniques. All of these are good indicators of the competitiveness of a firm. Thus, profits defined as price-cost margins by processes are used as a proxy for competitiveness (Roberts and Tybout, 1996):
A s K s s s
s =V −W −R −R
π ,
(
s= f,g)
(15)
where and are total wages and salaries, interest payments, and rents for land and buildings.
K s
s R
W , RsA
7 It should be borne in mind that some of the firms have their own land and buildings to accommodate the factory and are able to draw on their own equity capital. In cases such as these, the measure of profits according to equation (15) is a gross approximate with the imputation of rents and interests. In either case, the rate of
5 As an alternative to this, the stochastic frontier was estimated assuming that error terms follow an exponential distribution. However, there was no perceptible change in the results.
6 Subscript q is dropped for simplicity.
7 RsKdoes not include costs of purchasing machines even for firms which did so during the survey.
return is defined as the ratio of profits to the present value of installed machinery by process.8
s s
s K
r = π
.
(
s= f,g,f +g)
(16)For a firm engaged in both knitting fabrics and making garments, profits for the two processes are the sum of those generated in each process:πf+g =πf +πg. Similar treatment is also given to the present value of installed machines
(
Kf+g =Kf +Kg)
.3.2.2 Total Factor Productivity
As alluded to above, it is hard to single out pure profits from the data at hand.
An alternative indicator for the measurement of competitiveness is productivity. Since this study is the first of its kind relating to Bangladesh, time series changes in the productivity of firms can hardly be available. Because of this, “relative total factor productivity (TFP)” following Caves, Christensen and Diewert (1982) is used as an alternative indicator of productivity defined as follows:
⎟⎟⎠
⎞
⎜⎜⎝
⎛ −
⎥⎦
⎢ ⎤
⎣
⎡ +
⎟⎟−
⎠
⎞
⎜⎜⎝
⎛ −
=
∑ ∑ ∑
=
=
=
s s
s n
j
sj s
si n
j Nsj s
Nsi n
j sj s
si
si N
N n V n
V n TFP
1 1
1
1 ln 1 ln
2 ln 1
ln 1 1
ln λ λ
⎟⎟⎠
⎜⎜ ⎞
⎝
⎛ −
⎟⎟−
⎠
⎜⎜ ⎞
⎝
⎛ −
⎥⎦
⎢ ⎤
⎣
⎡ +
−
∑ ∑ ∑
=
=
=
s s
s n
j j s
i n
j
sj s
si n
j Ksj s
Ksi h
h n n K
n 1 K 1 1 1ln
ln 1 ln
1 ln 2
1 λ λ . (17)
HereλNsi is the labor share of total factor income of firm i and process s. It may be noted that the shares of labor and capital add up to one owing to the homogeneity assumption:λKsi =1−λNsi.
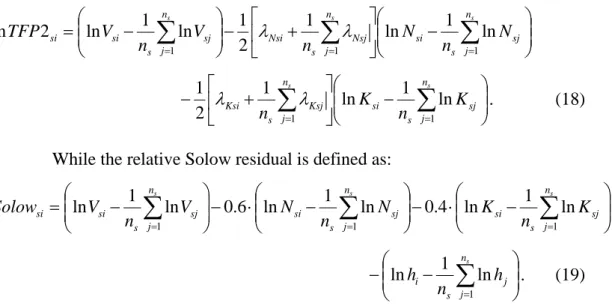
In order to assess the robustness of the pattern of variation in TFP, a more conventional version of relative TFP for which factor utilization is not taken into
8 The present value of machines is estimated following the perpetual inventory method assuming a 5 per cent annual depreciation rate. Insofar as detailed price series by types of machine are not available and since almost all machines used in this industry are produced abroad and imported, the implicit price deflator of “special industry machinery, n.e.c.” constructed by the Bureau of Economic Analysis of the United States is used as the deflator. It should be noted that the above series is available only after 1987.
Thus, the average rate of change in the series for 1987-2001of 2.44 per cent is applied for machines purchased before 1987.
account, and the Solow residual are also worked out. The conventional relative TFP is denoted as TFP2:
⎟⎟⎠
⎞
⎜⎜⎝
⎛ −
⎥⎦
⎢ ⎤
⎣
⎡ +
⎟⎟−
⎠
⎞
⎜⎜⎝
⎛ −
=
∑ ∑ ∑
=
=
=
s s
s n
j
sj s
si n
j Nsj s
Nsi n
j sj s
si
si N
N n V n
V n TFP
1 1
1
1 ln 1 ln
2 ln 1
ln 1 2
ln λ λ
⎟⎟⎠
⎜⎜ ⎞
⎝
⎛ −
⎥⎦
⎢ ⎤
⎣
⎡ +
−
∑ ∑
=
=
s
s n
j
sj s
si n
j Ksj s
Ksi K
K n
n 1 1 1ln
1 ln 2
1 λ λ . (18)
While the relative Solow residual is defined as:
⎟⎟⎠
⎜⎜ ⎞
⎝
⎛ −
⋅
⎟⎟−
⎠
⎜⎜ ⎞
⎝
⎛ −
⋅
⎟⎟−
⎠
⎜⎜ ⎞
⎝
⎛ −
=
∑ ∑ ∑
=
=
=
s s
s n
j
sj s
si n
j
sj s
si n
j sj s
si
si K
K n n N
N n V
V Solow
1 1
1
1 ln ln
4 . 0 1 ln
ln 6 . 0 1 ln
ln
⎟⎟⎠
⎞
⎜⎜⎝
⎛ −
−
∑
= ns
j j s
i h
h n
1
1 ln
ln . (19)
The Solow residual is appended to the conventional measures of TFP due to the possible overestimation of measured labor share. This shows whether or not the extent of upward bias in the share of labor is a cause for concern.
4. Empirical Analyses of Profitability and Productivity
Based on the frameworks and measures described in the previous section, this section presents the empirical results of (1) average profitability of the knitwear firms;
(2) diversity in efficiency in comparison with the garment industry of other developed and developing countries; and (3) the determinants of profitability and productivity.
4.1 Level and Variability of Profitability
Table 3 presents the salient features of the rates of return defined by equation (16) for the whole sample as well as different subsets of it. First, the mean value of the rate of return is likely to be far greater than unity. That is, the value of profits is likely to exceed that of installed machinery. In other words, profits for one year are more than enough for replacing all machinery. Even though for some subsets of sample firms such as “knitting fabrics only” and “dyeing fabrics and making final products only” the mean profits-capital ratios are negative, they do not alter the overall tendency towards high profitability. Second, the median is likely to be smaller than the mean. This implies that the distribution of the profits-capital ratio is skewed to the right. Third, the minimum
tends to be less than zero while the maximum tends to far exceed unity. As a whole, the large variation in the profits-capital ratio implies that not all firms in the rapidly growing knitwear industry are on an even keel.
This observation is consistent with the view of dynamism in entry and exit documented by Aw, Chen and Roberts (2001) for Taiwanese manufacturing. They showed that the Taiwanese manufacturing industry grew amid a high turnover of firms that was driven by differences in performance among firms.
4.2 Variability of Productivity
Stochastic frontier production functions are estimated, based on equations (8) and (9). Both value added and gross outputs were used as dependent variables. Only firms of the most likely combination of production activities (engaged in both knitting fabrics and making garments) are used as sample units for this purpose so that a common production function is applied to all sample firms. Results of both, with and without factor utilization are presented in Table 4.
Owing to the logarithmic transformation of the value added, the sample size for it is smaller than that with gross output. However, the main results are the same whether gross output or value added is used and whether or not factor utilization is taken into account. The estimated elasticity of output with respect to capital ranges between 0.437 and 0.513 and departs significantly from zero, while that with respect to labor tends to show large variations. The sum of the two estimates is not significantly different from zero in any of the four sets of results implying constant returns to scale in the production function.
The estimated variance of disturbance incorporating inefficiency,σE , is significantly greater than zero for all the four estimations, so that the stochastic frontier estimation makes sense. The variance of inefficiency even exceeds the variance of two-sided disturbance,σF, on average. The mean technical efficiency is around 0.50 for all four estimates.
These estimates may be compared with those found in other countries. Fecher and Perelman (1992) report the mean technical efficiency of the textile industries of 10 OECD member countries in the 1970s-80s. Their estimates range between 0.68 and 0.89
except for those relating to Japan.9 It is evident that the mean technical efficiency of the knitwear industry in Bangladesh is far off this range. This comparison between the developed and the developing countries is not misplaced as Tybout (2000, p. 24) concludes that “…average deviations from the efficient frontier are not typically larger than what we observe in the high-income countries….”
Similarly, Tyler and Lee (1979) report mean technical efficiency for the garment industry of Colombia at 0.55, Hill and Kalirajan (1993) report the mean technical efficiency for the garment industry in Indonesia at 0.63, while Mazumdar and Mazaheri (2003) report the mean technical efficiency for the garment industries in five African countries (Ghana, Kenya, Tanzania, Zambia and Zimbabwe) as ranging between 0.69 and 0.56. It should be noted that the range of these estimates is well above 0.50. This is, however, not an accurate comparison as the above list is based on all types of garment industry in which the knitwear industry comprises only one category.
Despite this caveat, the mean technical efficiency of the knitwear industry in Bangladesh is obviously low, which implies high variability of technical efficiency10. 4.3 Determinants of Profitability
Insofar as the knitwear industry in Bangladesh is profitable, it is important to identify the factors that determine its profitability and productivity. If many of these variables are policy related, then a judicious manipulation of them may enhance the competitiveness of the industry. To that end, some candidate variables are selected. First, production and product related issues are captured through output level as an indicator of scale effect, and dummies are used for ‘knitting fabrics only11’, ‘making garments only’, ‘subcontracting in knitting fabrics’, and ‘subcontracting in making garments’, as indicators of the diverse activities undertaken by the knitwear firms. If the two dummy
9 The estimates of the textile industry in Japan for the periods of 1971-79 and 1980-86 are 0.40 and 0.53, respectively. Fecher and Perelman (1992) applied translog function without factor utilization. However, if the functional form used in this paper is used, the mean technical efficiency falls to 0.49. This estimate is not far off the ones found in the present paper.
10 Note that a low average technical efficiency in Bangladesh does not imply that the technical efficiency is lower in the country than in others, because frontiers were estimated country by country.
11 This and all other dummies that follow are dichotomous and assume a value of one when the attribute is present and zero otherwise.
variables for “knitting fabrics only” and “making garments only” are both significantly greater than zero, this will provide strong support for the existence of the “vertical integration effect” in the knitwear industry as warranted by the EU’s stricter Rules of Origin for the GSP facility. Second, besides the age of the firm (measured in years since establishment), a set of dummies were included to address the legal and financial status of the firms. These include dummies for ‘limited company’, BGMEA12 member’, ‘joint venture’ and firms that use their own factory and/or land, or their own equity capital.
Third, four locational dummies differentiating ‘outside Narayanganj’, ‘Savar and Gazipur’, ‘DEPZ (Dhaka Export Processing Zone)’ and ‘BSCIC industrial area13’ are included to assess whether or not there are locational effects. Fourth, management issues were captured by including the age of the top management official (decision maker), her/his length of experience in the same firm (measured in numbers of years), with knitwear, with textile and garments, and three categorical dummies reflecting the educational background of the decision maker. The benchmark for the categorical dummies is the Secondary School Certificate (SSC), which is the lowest qualification for all decision-makers in the sample. Fifth, the price of knitting and sewing machines is used to reflect the overall technology of garment manufacture within the firm. The price variable takes a missing value if machines are not installed. Therefore, the price of circular knitting machines is used as an explanatory variable only for sample firms engaged in knitting fabrics, while the price of sewing machines is used only for sample firms engaged in making garments.
Table 5A presents the results of regression of the profits-capital ratio on explanatory variables explained above for the whole sample of firms. It may be noted that several explanatory variables used for the estimation might be endogenous. Activity, subcontracting, amount of output, status of firm, age of firm, location, and even managers, are all choice variables which are possibly dependent on the performance of sample firms, which is represented by indicators such as rate of return and productivity.
Checking endogeneity of so many variables poses a formidable task. As an experiment,
12 The sample firms may be members of the Bangladesh Garment Manufacturers and Exporters Association (BGMEA), the apex industrial association for both woven and knit garment producers, as well as of BKMEA.
13 These industrial zones are administered by the Bangladesh Small and Cottage Industries Corporation (BSCIC).
a test of endogeneity was conducted on the level of output following Hausman (1978) 14. As the results towards the bottom of the Table show, output level is not endogenous;
hence discussions of results involve only the OLS estimates.
It may be noted that there is a significant difference in the profits-capital ratio between firms engaged in making knitwear only and other firms, with the former exhibiting a higher ratio than the latter. In contrast, the ratio is not significantly different between firms engaged in knitting fabrics and others. Thus, industrial upgrading does not seem to affect vertical integration incorporating backward linkage.
Effects of the dummy for firms subcontracting the knitting of fabrics, the logarithm of output, and the dummy for firms located in the EPZ, are statistically significant. In particular, firms subcontracting the knitting of fabrics are likely to exhibit a high, rather than a low, profits-capital ratio if the other factors are controlled for. In addition, large firms measured in terms of gross output are likely to have a high profits-capital ratio; a 1 percent increase in gross output is associated with 1.755 to 1.977 points increase in the ratio. Note that this impact is quite large given that the mean profits-capital ratio is around 1.5. Finally, firms located in the EPZ tend to exhibit low rates of return.
There is no sensible explanation of the significantly positive impact of subcontracting the knitting of fabrics and the significantly negative impact of location in the EPZ. What is more interesting to note is that (1) scale is positively associated with the rates of return, a relationship that is not generally observed for manufacturing in developing countries15; (2) there is no evidence for advantages of vertically integrated firms in the rate of return after other factors are controlled for; (3) there is no evidence for a positive geographical agglomeration effect; and (4) attributes of decision-makers of the firms do not have any significant impact on the rates of return. The effect of the dummy for firms paying rent for their factories is not significant.
14 See section 4.4 for the instrumental variables. See Bakht et al. (2006) for the relevance of the instrumental variables.
15 A firm-level study of the garment industry in Bangladesh conducted in 2003 did not find any positive association between the rates of return and the scale of production (Fukunishi et al., 2006). Note that Table 4 shows that there is no scale economy in the frontier production function. Thus, the scale economy found in Table 5A, 5B, and 5C appears to be related to inefficiency.
.
A new focal issue that features in this study (Table 5B) is that the logarithm of firm average price of circular knitting machines is introduced as an explanatory variable.
However, the hypothesis that firms using more sophisticated technology (as embodied in expensive machines) exhibit high rates of return was not borne out; even though the sign of estimated coefficient is negative, they are not statistically significant. A similar observation holds for the logarithm of firm average price of sewing machines introduced as an explanatory variable (Table 5C). As before, the sign is negative, but insignificant. Thus, industrial upgrading is not found to be a critical factor in enhancing the rate of return.
4.4 Determinants of Productivity
As mentioned above, there are difficulties in measuring profits accurately. Thus, as an alternative, productivity, under different rubrics such as TFP1, TFP2, and the Solow residual defined in (17)-(19), is examined in order to shed light on the determinants of firm performance. Note that the benchmark productivity indicator is TFP1, and that this incorporates factor utilization and uses actual data of labor share by firm. Factor utilization is dropped from the list of inputs in TFP2, while for the Solow residual, the labor share is assumed to be 0.6 for any firm taking account of the likelihood of upward bias in measured labor share by firm.
Table 6 presents the results of regression of the productivity indicators on the same set of explanatory variables used for the regression of the rate of return. Again the test of endogeneity was conducted for the level of output. As the results towards the bottom of the Table show, the output level in this case is endogenous. Hence, the 2SLS results are preferable. However, finding exogenous instruments is a difficult task and critically hinges on the orthogonal condition between the instruments and the error term.
As instruments for output level, participation in promotion programs and monthly operation rate are used. As there was more than one instrument for the endogenous output level, Hansen’s (1982) J-test of overidentifying restrictions was conducted to check the exogeneity of the instruments. As the results at the bottom of the Table show, the instruments satisfy the exogeneity condition.
None of these variables is a perfect instrument. Participation in any promotion program is a choice variable. The monthly operation rate is also dependent on
performance of a sample firm. Thus, these 2SLS estimations should be regarded as alternative experiments to examine the robustness of the OLS estimation displayed in Table 6. As a check for the relevance of the instruments, Shea’s (1997), and those adjusted with the degree of freedom,
2
Rp 2
Rp, were used. It may be noted that R2p and Rp2 are not high. However, the values of Rp2 and Rp2 found in this paper16 are not far off the ranges suggested by Shea (1997).
It is evident that the patterns of statistical significance of explanatory variables are similar across the three productivity indicators and estimation methods. As found in the case of regression for rates of return, estimates of the logarithm of gross output are significantly positive for five of the six specifications. New features of this series of regression analyses which did not appear in the regression for the rates of return are (a) positive association with joint venture, (b) negative correlation with the age of firms, (c) positive correlation with the age of decision makers, (d) positive correlation with the length of association of the decision maker with the same firm, and (e) negative correlation with the length of association of the decision maker in the textile and garments industry as a whole.
The first feature of positive correlation between gross output and productivity confirms the same positive association between gross output and rate of return. This positive correlation may imply scale economy. By contrast, if a reverse causality such as expansion in production due to high productivity and high profits works, the positive correlation appears without scale economy. If the 2SLS successfully disposes of the reverse causality, only the scale effect remains.
It makes sense that joint venture exhibits high productivity. This result is consistent with the finding by Kee (2005) on productivity of the garment industry in Bangladesh. There are no other estimates of this aspect of the garment industry in Bangladesh. However, Aw, Chen and Roberts (2001) report that in Taiwan manufacturing, new firms have lower productivity than incumbents.
Experience of decision makers, and physical age and tenure in the same firm are positively correlated. This may reflect the positive impacts of these types of
16 Sheas’ test statistics are shown in Bakht et al. (2007).
experience on the productivity of the firm. On the other hand, there is no sensible interpretation of the significantly negative correlation between the length of experience of decision makers of firms in the textile and garment industry and productivity.
In sum, no supportive evidence is found for a positive association of industrial development strategies, such as geographical agglomeration and industrial upgrading.
Some externality caused by agglomeration might enhance the profitability and productivity of a firm located close to other firms (see, Fujita and Thisse, 2002). The impact of vertical integration and of upgrading of machinery are also not evident in the sector. The scale of firm represented by gross output is the most outstanding factor to be positively correlated with profitability and productivity.
5. Some Concluding Remarks
In the past, labor-intensive industries drew attention as they seemed to offer an entry point for low income countries to initiate industrialization. The textile industry played that role in the United Kingdom and Japan during the nineteenth century, while the garments industry and electrical and electronic machinery industries took over the role for export-oriented industrialization in the East and Southeast Asian countries from the 1970s through the 1990s (see, Amjad, 1989). It was expected that this kind of contribution to poverty reduction by the labor-intensive sector would replicated in other labor-abundant countries (World Bank, 1990). During theintervening years, however, the possibility of export-oriented industrialization of low income countries led by labor-intensive industries has not been thoroughly scrutinized and for several reasons has almost been forgotten.
In the context of an elliptical world environment, the labor intensive readymade garments industry in Least Developed Countries (LDCs) has succeeded in penetrating the markets of developed countries. However, most observers have been pessimistic about the competitiveness of the industry in the LDCs because international trade in textiles and garments was not fully liberalized. Complete liberalization was scheduled for the beginning of the year 2005, and it was widely expected that sooner or later the industry in the LDCs would lose out, once trade was liberalized.
As a matter of fact, however, an immediate collapse of the industry did not occur among LDC garment exporters such as Bangladesh and Cambodia, not by the
year 2007 at any rate. This is only to be expected because to a certain extent, even in the era of controlled trade regimes sustained by the MFA and succeeding agreements, there was export competition among exporting countries up to quota ceilings.
This study assesses the mechanisms and features of an internationally competitive manufacturing industry in an LDC, namely Bangladesh. The knitwear industry in Bangladesh is growing rapidly and is one of the country’s typically labor-intensive and export-oriented industries. Thus, examination of prospects of the industry will provide valuable lessons relating to industrialization in other LDCs.
With this possibility in mind, the knitwear industry in Bangladesh has been scrutinized in detail. The main conclusions of the study are fourfold. First, development of the knitwear industry in Bangladesh facilitates the reduction of poverty by providing entry-level workers with a range of employment opportunities and earnings higher than the national poverty line and higher than those offered by alternative types of employment in Bangladesh. Second, the average profitability of the knitwear firms is very high. Within this general environment, however, some firms earn profits several times higher than the amount needed for replacement of all installed machinery, while others are operating at a loss. In other words, substantial diversity in efficiency among firms exists. Third, the stochastic production frontier analysis implies that the variability in technical efficiency indicated by average technical efficiency is higher in Bangladesh than in other developing countries. Fourth, no evidence was found to support significantly positive impacts on profitability and productivity of industrial upgrading in terms of the usage of expensive machinery and vertical integration and industrial agglomeration.
The findings of this paper lend support to the view that the East Asian pattern of export-oriented industrialization still holds great promise as a way of promoting the industrialization of low-income countries, even without active government interventions.
As Roberts and Tybout (1996) and Aw, Chen and Roberts (2001) demonstrated for other developing countries, there is great diversity in profitability and productivity among firms even in a growing industry, and frequent entries and exits may take place. Amidst that high turnover, a competitive industry may grow and contribute to poverty reduction as a whole. The knitwear industry in Bangladesh is a case in point. Since Bangladesh
does not have any physical and institutional advantages in promoting industries over other LDCs, there is no reason why the pattern and mechanism of development of the knitwear industry in Bangladesh cannot be replicated in other LDCs in the near future.
Reference
Amjad, Rashid ed. (1981), The Development of Labour Intensive Industry in ASEAN Countries, Bangkok: International Labour Organisation, Asian Employment Programme.
Aw, Bee Yan, Xiaomin Chen, and Mark J. Roberts (2001), “Firm-level Evidence on Productivity Differentials and Turnover in Taiwanese Manufacturing,” Journal of Development Economics, Vol. 66, No. 1, October, pp. 51-86.
Bakht, Zaid, Md. Salimullah, Tatsufumi Yamagata and Mohammad Yunus (2007),
“Competitiveness of Labor-Intensive Industry in a Least Developed Country: A Case of the Knitwear Industry in Bangladesh,” paper presented at the conference of
“Productivity and Growth in Africa and Asia,” organized by the United Nations Industrial Development Organization (UNIDO) and the Institute of Developing Economies (IDE), Japan, at the International House of Japan, Tokyo, in October 11, 2007.
Bakht, Zaid; Mohammad Yunus; and Md. Salimullah (2002), Machinery Industry in Bangladesh, IDEAS Machinery Industry Study Report No. 4, Chiba, Japan: Institute of Developing Economies Advanced School (IDEAS) (http://www.ide.go.jp/English/Publish/Ideas/machine_04.html).
Bangladesh Bureau of Statistics (BBS) (2003), Report of the Household Income and Expenditure Survey 2000, Dhaka: Bangladesh Bureau of Statistics.
Bangladesh Bureau of Statistics (BBS) (2004), Report on Bangladesh Census of manufacturing Industries (CMI), 1999-2000, Dhaka: BBS.
Bangladesh Garment Manufacturers and Exporters Association (BGMEA) (2001), BGMEA Members Directory 2000-2001, Dhaka: BGMEA.
Bangladesh Garment Manufacturers and Exporters Association (BGMEA) (2003), BGMEA Members Directory 2002-2003, Dhaka: BGMEA.
Bils, Mark and Jang-Ok Cho (1994), “Cyclical Factor Utilization,” Journal of Monetary Economics, Vol. 33, No. 2, April, 319-354.
Burnside, Craig, Martin Eichenbaum, and Sergio Rebelo (1995), “Capital Utilization and Returns to Scale,” in Ben S. Bernanke and Julio J. Rotemberg eds., NBER Macroeconomics Annual 1995, Cambridge: MIT Press, pp. 67-110.
Caves, Douglas W., Laurits R. Christensen, and W. Erwin Diewert (1982), “Multilateral Comparisons of Output, Input, and Productivity Using Superlative Index Numbers,”
Economic Journal, Vol. 92, No. 365, March, pp. 73-86.
Fecher, Fabienne and Sergio Perelman (1992), “Productivity Growth and Technical Efficiency in OECD Industrial Activities,” in Richard E. Caves et al. (eds), Industrial Efficiency in Six Nations, Cambridge, Massachusetts, and London: MIT Press, Chapter 12, pp. 459-488.
Fujita, Masahisa and Jacques-François Thisse (2002), Economics of Agglomeration:
Cities, Industrial Location, and Regional Growth, Cambridge: Cambridge University Press.
Fukunishi, Takahiro, Mayumi Murayama, Tatsufumi Yamagata and Akio Nishiura (2006), Industrialization and Poverty Alleviation: Pro-Poor Industrialization Strategies Revisited, Vienna: United Nations Industrial Development Organization (UNIDO).
Hansen, Lars Peter (1982) “Large Sample Properties of Generalized Method of Moments Estimators”. Econometrica 50, no. 4: 1029-54.
Hassan, M. Kabir (2000), “The Impact of Trade Liberalization on Technical Progress and Efficiency Change on Industry in Bangladesh,” Mimeographed, New Orleans:
Department of Economics and Finance, University of New Orleans.
Hausman, Jerry A. (1978) Specification Tests in Econometrics. Econometrica 46, no. 6:
1251-71.
Hill, Hal and K. P. Kalirajan (1993), “Small Enterprise and Firm-level Technical Efficiency in the Indonesian Garment Industry,” Applied Economics, Vol. 25, No. 9, September, pp. 1137-1144.
Kabeer, Naila and Simeen Mahmud (2004), “Globalization, Gender and Poverty:
Bangladeshi Women Workers in Export and Local Markets,” Journal of International Development, Vol. 16, No. 1, January, pp. 93-109.
Kee, Hiau Looi (2005), “Foreign Ownership and Firm Productivity in Bangladesh Garment Sector,” Mimeographed, Development Research Group, World Bank.
Khondker, Bazlul Hoque, Mayumi Murayama, and S. M. Mahfuzur Rahman (1995), Garment Industry in Bangladesh: Its Socio-Economic Implications, Joint Research Program Series No. 116, Tokyo: Institute of Developing Economies.
Kumbhakar, Subal C. and C. A. Knox Lovell [2000], Stochastic Frontier Analysis, Cambridge, UK: Cambridge University Press.
Little, Ian M. D.; Dipak Mazumdar; and John M. Page, Jr. (1987), Small Manufacturing Enterprises: A Comparative Analysis of India and Other Economies, New York:
Oxford University Press.
Mazumdar, Dipak and Ata Mazaheri (2003), The African Manufacturing Firm: An Analysis Based on Firm Surveys in Seven Countries in Sub-Saharan Africa, London:
Rutledge.
Osmani, S.R., W. Mahmud, B. Sen, H. Dagdeviren, and A. Seth (2003), The Macroeconomics of Poverty Reduction: The Case Study of Bangladesh, Dhaka:
United Nations Development Programme.
Paul-Majumder, Pratima (2003), Health Status of the Garment Workers in Bangladesh, Dhaka: Bangladesh Institute of Development Studies.
Quddus, Munir and Salim Rashid (2000), Entrepreneurs and Economic Development:
The Remarkable Story of Garment Exports from Bangladesh, Dhaka: University Press.
Rhee, Yung Whee (1990), “The Catalyst Model of Development: Lessons from Bangladesh’s Success with Garment Exports,” World Development, Vol. 18, No. 2, February, pp. 333-346.
Roberts, Mark J. and James R. Tybout (1996), “Industrial Evolution in Developing Countries: A Preview,” in Mark J. Roberts and James R. Tybout, eds., Industrial Evolution in Developing Countries: Micro Patterns of Turnover, Productivity, and Market Structure, New York: Oxford University Press, pp. 1-15.
Sachs, Jeffrey D. (2005), The End of Poverty: Economic Possibilities for Our Time, New York: Penguin Press.
Salim, Ruhul A. (1999), Capacity Realization and Productivity Growth in a Developing Country: Has Economic Reform Had Impact?, Aldershot, UK: Ashgate.
Shea, John (1997), “Instrument Relevance in Multivariate Linear Models: A Simple Measure,” Review of Economics and Statistics, Vol. 79, No. 2, May, pp. 348-352.
Siddiqi, Hafiz G. A. (2004), The Readymade Garment Industry of Bangladesh, Dhaka:
University Press.
Tybout, James R. (2000), “Manufacturing Firms in Developing Countries: How Well Do
They Do, and Why?” Journal of Economic Literature, Vol. 38, No. 1, March, pp.
11-44.
Tyler, William G. and Lung-Fei Lee (1979), “On Estimating Stochastic Frontier Production Functions and Average Efficiency: An Empirical Analysis with Columbian Micro Data,” Review of Economics and Statistics, Vol. 61, No. 3, August, pp. 436-438.
World Bank (1990), World Development Report 1990: Poverty, New York: Oxford University Press.
Zohir, Salma Chaudhuri (2003), “Emerging Issues in the RMG Sector of Bangladesh:
Insights from an Enterprise Survey,” Paper presented at the Seminar on “A Value Chain Analysis of the RMG Sector in Bangladesh: Beyond MFA,” jointly organized by the Bangladesh Institute of Development Studies (BIDS) and Oxfam-GB Bangladesh Programme on January 18-19, 2003.
Zohir, Salma Chaudhuri and Pratima Paul-Majumder (1996), Garment Workers in Bangladesh: Economic, Social and Health Condition, Dhaka: Bangladesh Institute of Development Studies.
Table 1
Average Monthly Wage (Rates) of Sample Firms
(Tk./Month) Experience less than 1 year 1-5 years 6 years and
above
All
Sex Male Female Male Female Male Female Male Female Both Managerial/ Executive 4,000 15,000 9,661 7,500 13,695 9,423 12,415 9,210 12293
Administration
Section Other Officer 3,688 - 5,139 5,673 8,669 15,000 7,131 8,005 7142
Engineer - - 6,962 - 8,295 8,000 8,153 8,000 8152 Supervisor - - 4,053 - 4,923 5,000 4,632 5,000 4633 Operator 1,583 - 3,349 - 3,343 4,000 3,334 4,000 3334 Knitting Section
(Knitted Fabrics)
Helper 1,512 1,500 1,518 - 1,919 2,000 1,600 1,625 1600 Engineer 4,000 - - - 9,286 - 8,625 - 8625
Supervisor 4,500 - 4,914 4,000 5,346 4,941 5,151 4,800 5085 Operator 2,500 2,500 4,515 3,271 7,053 3,603 5,269 3,454 4979 Knitting Section
(Knitted Goods)
Helper 1,026 1,015 1,386 1,166 - - 1,311 1,110 1213 Engineer 4,875 - 4,789 5,000 7,764 - 7,203 5,000 7190 Supervisor - 2,000 3,405 4,684 4,270 4,907 3,974 4,738 4015 Operator 1,686 1,600 3,008 3,053 3,394 2,995 3,218 3,015 3153 Sewing Section
Helper 1,051 1,160 1,122 1,178 1,333 1,256 1,136 1,183 1158
Engineer - - 9,538 - 26,222 - 22,985 - 22985 Supervisor 3,000 - 3,691 4,500 4,915 4,250 4,541 4,400 4539
Operator - 1,527 2,911 2,339 3,823 2,500 3,325 2,243 3114 Other Production
Sections
Helper 1,536 1,390 1,443 1,283 1,900 1,450 1,514 1,303 1422
Note: The overall sample size is 232 even though the typical sample firm employs only certain categories of workers classified in the table. The averages are the conditional mean among firms which employ persons of each combination of features such as section, designation, sex, and experience.
Table 2
Average Earnings by Mode and Sector of Employment and Poverty Status in Rural Bangladesh in 1999/2000
(Tk./Month)
Farm Non-Farm
Status Self-
employed
Casual Wage Labor
Casual Wage Labor
Self- employed
Salaried Wage Labor
Extremely Poor 411 754 1,013 962 1,403
Moderately Poor 644 898 1,248 1,640 1,785
Moderately
Non-Poor 902 893 1,429 2,144 2,146
Rich Non-Poor 1,193 935 1,811 5,990 3,133
All Poor 569 833 1,143 1,431 1,594
All Non-Poor 1,013 918 1,528 3,942 2,682
All Households 829 846 1,300 2,902 2,407
Note: The original daily rates, quoted in the Household Income and Expenditure Survey 2000 (BBS, 2003), are multiplied by a factor of 25 to derive monthly earnings.
Source: Osmani et al. (2003, Table IV.2, p. 40).
Table 3
Profits-capital ratio of export-oriented knitwear industry
Sample Min. Max. Median Mean Std Dev. Sample
All -7.098 37.954 0.673 1.570 3.729 229(55)
Positive value added -1.843 37.954 0.744 1.820 3.660 216(42) Positive rent -7.098 16.328 0.668 1.422 3.067 159(40) Positive interest -4.721 37.954 0.746 1.673 4.269 101(21) Knitting fabrics only (a) -1.953 1.385 -0.009 -0.010 0.834 13(7) Making garments only (b) -1.500 15.702 0.099 1.819 3.922 29(12) Dyeing fabrics only (c) 0.271 1.278 0.662 0.737 0.508 3(0) (a) and (b) only -7.098 37.954 0.827 1.758 4.189 142(29) (a) and (c) only -0.147 0.610 0.010 0.158 0.399 3(1) (b) and (c) only -1.843 0.890 0.246 -0.018 1.107 5(2) (a), (b), and (c) -1.344 11.510 0.790 1.648 2.445 35(4)
Note: Figures in parentheses are the number of firms with negative profits.
Table 4
Estimation of stochastic frontier of production function:
Firms engaging in both knitting fabrics and making garments only
Output Gross output Gross output Value added Value added Factor utilization Omitted Included Omitted Included
8.441*** 9.667*** 6.699*** 8.108***
Intercept
(1.606) (1.512) (1.829) (1.737)
0.552*** 0.385** 0.457* 0.246
Labor
(0.204) (0.186) (0.242) (0.221) 0.455*** 0.437*** 0.513*** 0.497***
Capital
(0.120) (0.122) (0.140) (0.142)
Sample size 142 142 134 134
0.000 1.470 0.020 2.250 Constant returns to scale:
-statistic and [p-value]
χ2 [0.971] [0.226] [0.880] [0.133]
Log likelihood -185.678 -186.631 -190.379 -192.167 0.624*** 0.638*** 0.741*** 0.766***
σF
(0.093) (0.091) (0.099) (0.100) 1.092*** 1.082*** 1.143*** 1.127***
σE
(0.177) (0.175) (0.202) (0.209) 1.749*** 1.697*** 1.543*** 1.473***
F
E σ
σ μ≡
(0.251) (0.246) (0.278) (0.286) Mean technical efficiency 0.503 0.506 0.491 0.495
Note: The mean technical efficiency is the average ofexp
[
−E(
εEiui) ]
. Figures in parentheses are standard errors.Estimates with ***, ** and * asterisks are significantly different from zero at 1%, 5% and 10% error probability levels, respectively.