Introduction
Swallowing function is considered to be an important determinant of oral function since dysphagia contributes to aspiration pneumonia among older adults.
1,2According to a 2015 statistical report from the Japanese Ministry of Health, Labour and Welfare, pneumonia is the third leading cause of all-cause mortality. In addition, aspiration is considered a leading cause of pneumonia, which affects approximately 85% of elderly people aged ≥65 years.
2Videofluoroscopic (VF) examination of swallowing has been widely recommended as the gold standard for identifying dysphagia. However, VF examination is not useful for com- munity-dwelling older people because it involves radiation exposure and is costly and time consuming.
3Previous studies revealed that the water swallowing test (WST) is useful as a screening tool for the early detection of dysphagia among older adults in the clinical setting.
4In Japan, either amounts of water, 3 or 30 mL, are used in the WST as part of a bedside dysphagia screening test,
4whereas from 90 to 150 mL
MS#AMN 07239
Performance of Japanese community-dwelling older adults in the 100-mL water swallowing test
Kazumi Y
amabe1, Takahiro N
ishida1,2, Yoshihiko i
de3, sumihisa h
oNda41 Yamabe Dental Clinic
2 Sasebo-Yoshii Community Comprehensive Support Center
3 Department of Dementia clinic, Sasebo- Chuo Hospital
4 Department of Public Health Nursing, Nagasaki University Graduate School of Biomedical Sciences
Background: Although the 100-mL water swallowing test (WST) is used to measure swallowing capacity (SC), volume per swallow (VS), time per swallow (TS), and the presence/absence of choking signs, the performance of each indicator is not clearly understood. The purpose of this study was to identify the relationship between performance in each indicator in the 100-mL WST and risk factors for dysphagia in community-dwelling older adults.
Methods: Participants included 304 Japanese community-dwelling older adults aged ≥65 years. We investigated participant characteristics including age, sex, body mass index (BMI), medical history, number of prescribed medications, laryngeal func- tion (maximum phonation time [MPT]), subjective dysphagia (the 10-item eating assessment tool [EAT-10]), and all indicators of the 100-mL WST. We compared each of the four indicators in the 100-mL WST and investigated their relationship with potential risk factors for dysphagia.
Results: Multivariate analyses showed that age, BMI, MPT, and EAT-10 were independently associated with SC. Age, sex, BMI, and EAT-10 were independently associated with VS. BMI, MPT, and EAT-10 were independently associated with TS.
Men were more likely to have choking signs in the 100-mL WST than women.
Conclusions: These findings indicated that all of three quantitative indicators in the 100-mL WST may predict the risk of sarcopenic dysphagia. Moreover, the presence of choking signs in men suggested the risk of aspiration. We propose that SC and choking signs in the 100-mL WST could be a simple and useful dysphagia assessment tool for community-dwelling older people.
ACTA MEDICA NAGASAKIENSIA 63: 1−10, 2019 Key words: 100-mL water swallowing test, dysphagia, community-dwelling elderly
Address correspondence:
Takahiro NISHIDA, 262-1 Tateishi-Yoshii-cho, Sasebo, Nagasaki 859-6326, Japan E-mail: nishida.takahiro.sun@gmail.comReceived January 21, 2019; Accepted May 7, 2019
amounts are used to detect dysphagia in most other coun- tries.
3-5Relatively higher amounts have been recommended for use in the WST to identify people with dysphagia who are capable of eating and drinking orally. The merits of using relatively high amounts of water are that observation findings for continuous drinking can be obtained, and the results for swallowing at slow speed are highly sensitive for detecting dysphagia.
4Wu et al.
3revealed that the 100-mL WST was a sensitive screening test for older adult outpatients with stroke suspected of having dysphagia. The 100-mL WST has the benefit of being a multidimensional assessment for dysphagia screening. The four components of the 100-mL WST are swallowing capacity (SC),
3volume per swallow (VS),
6time per swallow (TS),
6,7and choking signs.
3Aspiration is defined as the entry of a bolus below the level of the true vocal fold, while laryngeal penetration is defined as the bolus entering the laryngeal inlet but remaining above the level of the vocal folds, which can result in coughing, throat clearing, or wet voice quality.
7,8In the 100-mL WST, reduced swallowing speed is considered to be a compensa- tory or defensive reaction against swallowing dysfunction, which is reflected as aspiration or laryngeal penetration in VF examination.
3Moreover, the presence of choking signs including choking-free cases (i.e., wet voice quality) could screen, with high sensitivity and specificity, not only aspira- tion but also silent aspiration, which is reflected only as aspiration in VF examination.
3The sensitivity and specificity of SC are 85.5% and 50%, respectively, while the sensitivity and specificity of choking signs are 47.8% and 91.7%, respectively.
3However, to the best of our knowledge, the screening sensitivity and specificity of all four indicators in 100-mL WST, compared to VF examination and other common criteria, has not been determined. Because each of the four indicators has its own properties, it is important to assess them in combination.
Previous studies investigating the risk factors for dysphagia among older populations have shown that malnutrition, cerebrovascular disease, chronic obstructive pulmonary disease (COPD), decline in laryngeal function, and polyp- harmacy were dominantly considerable.
9-13The 100-mL WST has been recommended for suspected dysphagia in subjects who are capable of eating and drinking orally.
3However, to our knowledge, the 100-mL WST has not been used in investigations focusing on community-dwelling older people. Hence, the precise characteristics of community- dwelling older individuals with swallowing disorder detected by the 100-mL WST are unknown. Furthermore, the rela- tionship between the each of the four indicators in the 100- mL WST and relating factors for dysphagia is also unclear.
Further investigation of the methods of screening tests for swallowing disorder in community-dwelling older adults is important because oral frailty is considered reversible when detected in the early stage.
14In addition, many Japanese older adults perceive a decline in swallowing function and hope to receive swallowing rehabilitation or preventive care for oral frailty within their community.
14The purpose of this study was therefore to identify the relationship between multidi- mensional performance on the 100-mL WST and relating factors for dysphagia in community-dwelling older adults.
Materials and Methods Setting and Participants
This study had a cross-sectional design. The ethics com- mittee of Sasebo-Chuo Hospital approved the study protocol, and the study was conducted from July 10, 2017 to November 30, 2017 in a suburban area in Sasebo City and Hirado City, Nagasaki Prefecture, Japan. Informed consent was obtained from all individuals included in this study.
The study participants were recruited from individuals with long-term care insurance utilizing daycare services at five facilities and participating in voluntary circle activities for care prevention at 11 public halls. The inclusion criteria were age ≥65 years and living at home, The exclusion criteria were having a psychiatric disorder, severe dementia, and receiving treatment for severe disease (e.g., cancer).
Measurements
First, a dentist or a public health nurse visited the study participants at the public hall or daycare center and conducted face-to-face interviews on basic attributes. The data collected in the interviews included age, sex, height, weight, number of prescribed medications, and medical history (cerebrovascular disease, COPD, and history of pneumonia within the last year).
Second, a self-reported dysphagia questionnaire was con- ducted using the 10-item Eating Assessment Tool (EAT-10).
After completing the interview and questionnaire survey, the
100-mL WST and the maximum phonation time (MPT) test
were conducted. The 100-mL WST was conducted by a dentist
or a public health nurse with the help of a speech therapist or
social worker. When tests were performed at daycare centers,
the dentist was assisted by a social worker, and when tests
were performed at public halls, the public health nurse was
assisted by a speech therapist or social worker. The public
health nurse, speech therapist, and social worker were ade-
quately trained by an experienced dentist before the study.
The EAT-10
The EAT-10 was used as an indicator of self-reported dysphagia.
15The EAT-10 is composed of 10 questions with responses given on a five-point Likert (0-4 score) scale. The score ranges from 0 to 40, with higher scores indicating severe dysphagia symptoms. The reliability and validity of the EAT-10 were demonstrated by Belafsky et al.
15We used the Japanese version of the EAT-10 which was translated by Wakabayashi et al.
16, who also demonstrated its reliability and validity.
100-mL WST
The 100-mL WST was performed to assess swallowing function. The four indicators in the 100-mL WST are SC, VS, TS and choking signs. Participants were asked to drink 100 mL of water as quickly as comfortably possible in a seated position with the lip on the glass.
3The swallowing time was measured from the “go” signal until the participant finished drinking the water using a stopwatch. For those who successfully finished the glass of water, the end of the swallowing test was defined as the completion of the last swallow, indicated visually by the return of the thyroid carti- lage to its resting position. The number of swallows was counted acoustically using a microphone (Nanzu Electric Co. Ltd.; Shizuoka, Japan) during the test. Choking signs (i.e., coughing or a wet, hoarse voice) within 1 minute of the test were recorded. Participants who showed signs of chok- ing in the middle of drinking finished the test immediately regardless of whether they had completed all of the water or not. In such cases, the amount of water drunk was deter- mined by subtracting the volume of residual water from 100 mL. This test was performed only once, and confirmation of the wet voice quality was confirmed by speaking after test- ing. SC [mL/sec], defined as the amount of water drunk di- vided by the swallowing time, was calculated. VS [mL/n]
was defined as amount of water drunk in one swallow, calcu- lated by the total amount of water drunk divided by the total number of swallows. TS [sec/n] was defined as the time for one swallow, calculated by the total swallowing time divided by total number of swallows. In the 100-mL WST, the faster the SC, the greater the VS and the shorter the TS, the higher the swallowing performance.
In the present study, SC, VS, and TS measurements were defined as quantitative indicators of swallowing performance, while choking signs was a qualitative indicator of swallow- ing performance.
MPT
The MPT was used to measure laryngeal function. Par- ticipants were instructed to sustain the vowel /a/ as long as possible, at their normal speaking volume while sitting upright.
17The trial was conducted three times, with a rest of at least 15 seconds and allowing for maximal inhalation. The duration of the MPT was measured using a stopwatch and the mean time of the three trials was calculated. The longer the MPT, the higher the laryngeal function.
Statistical analysis
Age, BMI, MPT, and the three quantitative indicators (SC, VS, and TS) of the 100-mL WST are expressed as mean values with standard deviation (SD). EAT-10 score is expressed as median with interquartile range (IQR). We calculated the number and percentage of participant characteristics (sex, medical history, and number of prescribed medications). We also calculated the number and percentage for the qualitative indicator choking signs in the 100-mL WST.
Pearsonʼs correlation analysis was performed by calculating the correlation coefficient to examine the relationship between the three quantitative indicators (SC, VS, and TS) in the 100- mL WST and participant characteristics (age and BMI) or dysphagia related measurements (MPT and EAT-10). Spear- manʼs correlation analysis was also performed by calculating the correlation coefficient to examine the relationship between the three quantitative indicators (SC, VS, and TS) in the 100- mL WST and number of prescribed medications. The t-test was used to examine the difference in participant character- istics (sex and medical history). Furthermore, multiple linear regression analysis was used to determine which variables were independently associated with each of the three quanti- tative indicators. Dependent variables were accordingly, SC, VS, and TS. Covariates selected in the model were age, sex, BMI, history of cerebrovascular disease, COPD, history of pneumonia within the past year, number of prescribed medications, MPT and EAT-10.
To examine the relationship between choking signs in the 100-mL WST and participant characteristics (sex and medical history) the chi-square test was used. The t-test was also used to examine the differences in participant characteristics (age and BMI) and dysphagia related measurements (MPT).
The Cochran-Armitage test was used to examine the associ- ations between choking signs and number of prescribed medications. The Mann-Whitney U-test was used to examine the difference in the EAT-10 score according to the presence/
absence of choking signs. Furthermore, multiple logistic
regression analysis was used to determine which variables were independently associated with choking signs in the 100-mL WST. Independent variables selected for the model were age, sex, BMI, history of cerebrovascular disease, COPD, history of pneumonia within the past year, number of prescribed medications, MPT, and EAT-10.
All statistical analyses were conducted using SPSS software (version 23.0 for Windows; IBM, Tokyo, Japan).
Results
Participant characteristics
Three-hundred and twenty-three community-dwelling older adults met the inclusion criteria; however, six partici- pants did not consent to participate in the study and 13 participants returned incomplete questionnaire responses leaving 304 participants (65 men, 239 women) for the final analyses.
The mean age (SD) of the study participants was 79.9 (7.2) years old. Cerebrovascular disease, COPD and history of pneumonia within the past year were observed in 40 (13.2%), 26 (8.6%) and 17 (5.6%) participants, respectively (Table 1).
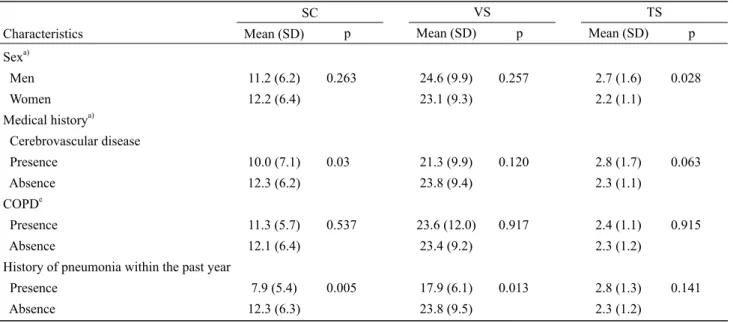
Swallowing performance and dysphagia questionnaire Table 2 summarizes the results of the three quantitative indicators of swallowing performance in the 100-mL WST and the dysphagia questionnaire. The mean (SD) values for SC, VS and TS were 12.0 (6.3) [mL/sec], 23.5 (9.5) [mL/n], and 2.3 (1.2) [sec/n], respectively. The median (IQR) of EAT-10 score was 0 (0, 3).
Quantitative indicators of swallowing performance in the 100-mL WST
Table 3 and Table 4 show the results of the relationship between each of the three quantitative indicators and basic characteristics, risk factors for dysphagia. SC in the 100-mL WST was negatively correlated with age (r=-0.41, p<0.001), number of prescribed medications (r=-0.13, p=0.022), and EAT-10 (r=-0.38, p<0.001), and positively correlated with BMI (r=0.30, p<0.001) and MPT (r=0.37, p<0.001). Partici- pants with cerebrovascular disease had significantly slower SC than those without cerebrovascular disease (10.0 [mL/
sec] vs. 12.3 [mL/sec], p=0.03). Participants with a history
of pneumonia within the past year also had significantly slower SC than those without a history of pneumonia within the past year (7.9 [mL/sec] vs. 12.3 [mL/sec], p=0.005).
VS in the 100-mL WST was negatively correlated with age (r=-0.3, p<0.001), number of prescribed medications (r=-0.16, p=0.006), and EAT-10 (r=-0.28, p<0.001), and positively correlated with BMI (r=0.25, p<0.001) and MPT (r=0.17, p=0.003). Participants with a history of pneumonia within the past year had significantly lower VS than those without a history of pneumonia within the past year (17.9 [mL/n] vs. 23.8 [mL/n], p=0.013).
TS in the 100-mL WST was positively correlated with age (r=0.23, p<0.001) and EAT-10 (r=0.33, p<0.001), and nega- tively correlated with BMI (r=-0.22, p<0.001) and MPT (r=- 0.37, p<0.001). None of the medical history variables had a significant relationship with TS. On the other hand, men had significantly longer TS compared to women (2.7 [sec/n] vs.
2.2 [sec/n], p=0.028).
Table 5 shows the results of the multiple linear regression analysis for each of the three quantitative indicators after adjusting for potential risk factors of dysphagia. The multi- variate analyses showed that age (regression coefficient (b)
=-0.216, p<0.001), BMI (b=0.357, p<0.001), MPT (b=0.276, p<0.001), and EAT-10 (b=-0.465, p<0.001) were independently associated with SC. BMI and EAT-10 were independently associated with all three quantitative indicators. Men had an independent association with VS only (b=3.491, p=0.006).
Qualitative swallowing performance in the 100-mL WST
Of the 304 study participants, 35 (11.5%) participants
showed choking signs in the 100-mL WST. Table 6 shows
the results of the relationship between choking signs and basic
characteristics and risk factors for dysphagia. The chi-square
test showed that men (21.5%) had a significantly higher rate
of choking signs compared to women (8.8%) (p=0.004). The
t-test showed that participants with choking signs were
significantly older than those without choking signs (83.3
years vs. 79.5 years, p=0.003). Also, participants with choking
signs had a significantly lower BMI than those without choking
sings (21.1 kg/m
2vs. 22.7 kg/m
2, p=0.008). After adjusting
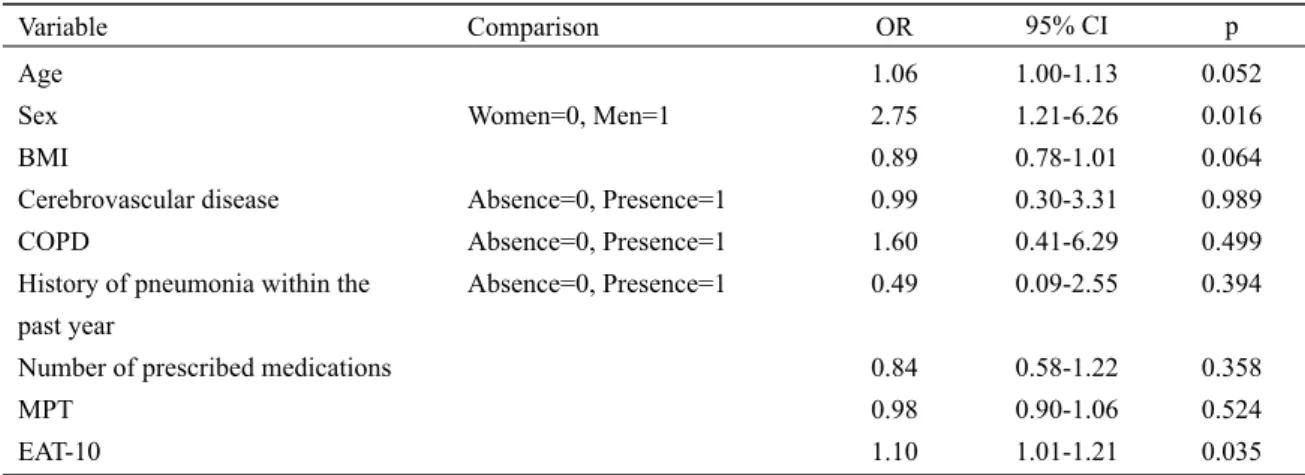
for potential risk factors, multiple logistic regression analysis
also revealed that men were more likely to have choking
sings than women (odds ratio [OR], 2.75; 95% confidence
interval [CI], 1.21-6.26), and that choking signs were associ-
ated with EAT-10 (OR, 1.10; 95%CI, 1.01-1.21) (Table 7).
Table 1. Characteristics of the study participants
Characteristics n (%) Mean (SD)
Sex Men Women Age (years) BMI (kg/m2) Medical history
Cerebrovascular disease COPD
History of pneumonia within the past year Number of prescribed medications 0
1-2 3-4 ≥ 5
65 (21.4) 239 (78.6)
40 (13.2) 26 (8.6) 17 (5.6) 51 (16.8) 72 (23.7) 74 (24.3) 107 (35.2)
79.9 (7.2) 22.5 (3.4)
SD: standard deviation, BMI: body mass index, COPD: chronic obstructive pulmonary disease.
Table 2. Results of the 100-mL WST and the dysphagia questionnaire
Examination Mean (SD) Median (1st quartile, 3rd quartile)
100-mL WST
Swallowing time (sec) Number of swallows (n) SC (mL/sec)
VS (mL/n) TS (sec/n)
Choking signs (n, %) MPT (sec)
EAT-10 score
12.0 (9.4) 5.0 (2.0) 12.0 (6.3) 23.5 (9.5) 2.3 (1.2) 35 (11.5) 12.7 (5.4)
0 (0, 3)
WST: water swallowing test, SD: standard deviation, SC: swallowing capacity, VS: volume per swallow, TS: time per swal- low, MPT: maximum phonation time, EAT-10: 10-item Eating Assessment Tool.
Table 3. Relationship between the three quantitative indicators in the 100-mL WST and risk factors for dysphagia
SC VS TS
Characteristics rc) p rc) p rc) p
Agea) BMIa)
Number of prescribed medicationsb) 0
1-2 3-4 ≥ 5 MPTa) EAT-10a)
-0.41 0.30 -0.13
0.37 -0.38
p<0.001 p<0.001 0.022
p<0.001 p<0.001
-0.30 0.25 -0.16
0.17 -0.28
p<0.001 p<0.001 0.006
0.003 p<0.001
0.23 -0.22 0.02
-0.37 0.33
p<0.001 p<0.001 0.728
p<0.001 p<0.001
a) Pearsonʼs correlation coefficient
b) Spearmanʼs correlation coefficient
c) r =correlation coefficient
WST: water swallowing test, SC: swallowing capacity, VS: volume per swallow, TS: time per swallow, MPT: maximum phonation time, EAT-10: 10-item Eating Assessment Tool.
Table 4. Relationships between the three quantitative indicators in the 100-mL WST and sex and medical history based on the t-test
SC VS TS
Characteristics Mean (SD) p Mean (SD) p Mean (SD) p
Sexa) Men Women Medical historya) Cerebrovascular disease Presence
Absence COPDe Presence Absence
History of pneumonia within the past year Presence
Absence
11.2 (6.2) 12.2 (6.4)
10.0 (7.1) 12.3 (6.2) 11.3 (5.7) 12.1 (6.4) 7.9 (5.4) 12.3 (6.3)
0.263
0.03
0.537
0.005
24.6 (9.9) 23.1 (9.3)
21.3 (9.9) 23.8 (9.4) 23.6 (12.0)
23.4 (9.2) 17.9 (6.1) 23.8 (9.5)
0.257
0.120
0.917
0.013
2.7 (1.6) 2.2 (1.1)
2.8 (1.7) 2.3 (1.1) 2.4 (1.1) 2.3 (1.2) 2.8 (1.3) 2.3 (1.2)
0.028
0.063
0.915
0.141
a) t-test
SC: swallowing capacity, VS: volume per swallow, TS: time per swallow, SD: standard deviation, COPD: chronic obstructive pulmonary disease.
Table 5. Independent predictors of the three quantitative indicators in the 100-mL WST among Japanese elderly persons aged ≥ 65 years
SC VS TS
Variable ba) SE p ba) SE p ba) SE p
Age
Sex (Women=0, Men=1) BMI
Cerebrovascular disease (Absence=0, Presence=1) COPD (Absence=0, Presence=1) History of pneumonia within the past year (Absence=0, Presence=1)
Number of prescribed medications MPT
EAT-10
-0.216 0.601 0.357 0.009
-0.651 0.468
-0.014 0.276 -0.465
0.047 0.76 0.094 0.973
1.121 1.488
0.293 0.06 0.092
p<0.001 0.43 p<0.001
0.993
0.562 0.753
0.962 p<0.001 p<0.001
-0.232 3.491 0.473 0.096
1.039 -1.641
-0.644 0.112 -0.584
0.077 1.259 0.155 1.611
1.857 2.464
0.486 0.099 0.152
0.003 0.006 0.003 0.952
0.576 0.506
0.186 0.26 p<0.001
0.013 0.216 -0.059 0.214
0.013 -0.101
-0.097 -0.289 0.26
0.01 0.157 0.019 0.201
0.231 0.307
0.061 0.012 0.019
0.188 0.169 0.003 0.286
0.806 0.082
0.076 p<0.001 p<0.001
a) b=regression coefficient
WST: water swallowing test, SC: swallowing capacity, VS: volume per swallow, TS: time per swallow, SE: standard error, BMI: body mass index, COPD:
chronic obstructive pulmonary disease, MPT: maximum phonation time, EAT-10: 10-item Eating Assessment Tool.
Table 6. Relationship between the qualitative indicator in the 100-mL WST and risk factors for dysphagia Choking signs
Characteristics Presence Absence p
Sexa) Men Women Ageb) BMIb)
Medical historya) Cerebrovascular disease Presence
Absence COPD Presence Absence
History of pneumonia within the past year Presence
Absence
Number of prescribed medicationsc) 0
1-2 3-4 ≥ 5 MPTb) EAT-10 scored)
14 (21.5%) 21 (8.8%) 83.3 (6.7) 21.1 (3.2)
6 (15.0%) 29 (11.0%)
3 (11.5%) 32 (11.5%)
3 (17.6%) 32 (11.1%)
4 (7.8%) 13 (18.1%)
4 (5.4%) 14 (13.1%)
11.1 (5.0) 4.1 (5.6)
51 (78.5%) 218 (91.2%)
79.5 (7.2) 22.7 (3.4)
34 (85.0%) 235 (89.0%)
23 (88.5%) 246 (88.5%)
14 (82.4%) 255 (88.9%)
47 (92.2%) 59 (81.9%) 70 (94.6%) 93 (86.9%) 13.0 (5.4)
1.8 (3.3)
0.004 0.003 0.008
0.458
0.997
0.415
0.907
0.054 0.004
a) Chi-square test
b) t-test
c) Cochran Armitage-test
d) Mann-Whitney U-test
WST: water swallowing test, BMI: body mass index, COPD: chronic obstructive pulmonary disease, MPT: maximum phonation time, EAT-10: 10-item Eating Assessment Tool.
Table 7. Independent predictors of choking signs in the 100-mL WST among Japanese elderly persons aged ≥ 65 years
Variable Comparison OR 95% CI p
Age Sex BMI
Cerebrovascular disease COPD
History of pneumonia within the past year
Number of prescribed medications MPT
EAT-10
Women=0, Men=1 Absence=0, Presence=1 Absence=0, Presence=1 Absence=0, Presence=1
1.06 2.75 0.89 0.99 1.60 0.49 0.84 0.98 1.10
1.00-1.13 1.21-6.26 0.78-1.01 0.30-3.31 0.41-6.29 0.09-2.55 0.58-1.22 0.90-1.06 1.01-1.21
0.052 0.016 0.064 0.989 0.499 0.394 0.358 0.524 0.035 WST: water swallowing test, OR: odds ratio, 95% CI: 95% confidence interval, BMI, body mass index, COPD: chronic obstructive pulmonary disease, MPT: maximum phonation time, EAT-10: 10-item Eating Assessment Tool.
Discussion
Swallowing difficulty is an important issue for the older population. Here, we investigated the utility of dysphagia screening using the 100-mL WST. The 100-mL WST has the advantage of evaluating swallowing performance both quan- titatively (SC, VS, and TS) and qualitatively (signs of choking). We aimed to explore the associations between each indicator in the 100-mL WST and potential risk factors for dysphagia. Our results of both single and multivariate analysis revealed that all four indicators in the 100-mL WST were commonly associated with EAT-10 score. The EAT-10 is a validated dysphagia questionnaire that has high reliability.
16This suggests the utility of the 100-mL WST as a multidi- mensional dysphagia screening tool among community- dwelling older people.
Furthermore, the characteristics of each indicator in the 100-mL WST were demonstrated in this study. Slower SC (i.e., slower swallowing speed) and longer TS (i.e., longer time taken for one swallow) were independently related to low BMI and poor MPT, and this was confirmed by multi- variate analysis. Sarcopenic dysphagia is highlighted as a cause of oral frailty and is considered to result from extreme muscle mass reduction in the muscles related to swallowing (e.g., suprahyoid muscles and infrahyoid muscles).
18,19Sarcopenia is not only an abnormal decrease in muscle mass and muscular strength but is also accompanied by malnutri- tion.
20Low BMI and MPT indicate poor nutritional status and weak laryngeal performance, respectively.
17,21Notably, it was reported that participants with swallowing difficulty had a higher prevalence of weak cough reflex and dysphonia.
22In addition, the direct cause of sarcopenic dysphagia is not considered to be associated with cerebrovascular disease or drugs.
19In the present study, multivariate analysis showed that none of the four indicators in the 100-mL WST, including SC and TS, were associated with cerebrovascular disease or polypharmacy, a finding congruent with the previous study by Mori et al.
19It is thought that if tongue strength declines, VS would decrease.
7However, in our multivariate analysis, VS was associated with BMI, but not with MPT. We suspect that older adults with dysphagia would prolong the time taken for one swallow rather than reduce the bolus volume as a strategy to compensate for swallowing difficulty. Alter- natively, slower SC in the 100-mL WST could comprehen- sively represent a mechanism of compensating for or adapting to dysphagia.
Considering the need for early detection and intervention, development of a sensitive dysphagia assessment tool for presbyphagia, which indicates declining swallowing perfor-
mance with age and is considered the pre-stage of sarcopenic dysphagia, is required. Although, all three quantitative indicators can be predictors of sarcopenia dysphagia in our results, we propose measuring SC only. Because SC in the 100-mL WST is only a timed test, it has the merit of being simple. The 100-mL WST involves a relatively high number of sequential swallows, which is demanding due to the fine coordination of breathing and swallowing.
7Participants with a swallowing disorder would drink the 100 mL of water taking care not to aspirate. Consequently, slower swallowing speed is considered to be a compensatory or adaptive mechanism to prevent aspiration.
3,7. If the SC in 100-mL WST is positive (ie., SC; >10 [mL/sec]),
3it may be a dysphagia that requires medical treatment, so it is necessary to refer to home doctor or specialist (dentist or speech therapist). In addition, even though in the case of medical treatment is not necessary in hospital, positive subjects in the 100-mL WST had better initiate or continue swallowing rehabilitation in the community.
We revealed that men are more likely to have choking signs compared to women based on the qualitative assess- ment of choking signs in the 100-mL WST. Moreover, our multivariate analysis results also showed that men have a higher VS value compared to women, whereas SC and TS showed no sex differences in the quantitative measurements.
These findings suggest that aspiration or penetration is induced easily in men and they may not swallow as carefully women. In fact, according to a Spanish retrospective cohort study from 2003 to 2013,
11and a 2009 statistical report from the Japanese Ministry of Health, Labour and Welfare,
23in older populations, men showed higher morbidity and mortality for aspiration pneumonia compared to women. In the present study, the prevalence of pneumonia within the past year was significantly higher in men compared to women (13.3% vs.
3.3%, p=0.001) (data not shown). These results indicate that among older populations, men are more sensitive to aspiration pneumonia than women. However, a previous study reported that women have more complaints about dysphagia symptoms compared to men based on a questionnaire survey.
24It is possible that conflicting results might exist due to sex differ- ences in self-reported assessments and performance-based evaluations of swallowing function.
25The main advantage of assessing choking signs with the 100-mL WST is the utility of monitoring the progression of aspiration.
3We therefore propose that in the case of men with choking signs, the risk of aspiration pneumonia should be taken into consideration.
This study had several limitations. First, because of the
nature of the cross-sectional study design, causal relationships
could not be determined. Second, our results might include
selection bias because we did not use random sampling.
Accordingly, our results should be interpreted with caution and cannot be completely generalized to other older adult populations. A prospective study is needed to identify further associations between performance in the 100-mL WST and relating factors for dysphagia in community-dwelling older people. Third, we measured MPT and BMI as risk factors for sarcopenic dysphagia; however, a definition of sarcopenic dysphagia has not yet been established. Further study is needed to investigate the associations between swallowing performance in the 100-mL WST and sarcopenia related markers such as hand grip strength, skeletal muscle mass index, and nutritional status, or tongue strength. Finally, we did not identify cut-off points for each indicator of the 100- mL WST in this study. Although Wu et al.
3defined >10 [mL/
sec] in the 100-mL WST as SC positive for stroke patients, the characteristics of our study participants differed from that previous study. Further study is required to identify the cut-off points for each indicator in the 100-mL WST by comparing VF examination for dysphagia as the gold stan- dard.
Although early detection of oral frailty is gaining impor- tance in Japan, dysphagia screening methods have not been established in the community. The strength of this study is that it is the first attempt at using the 100-mL WST as a dysphagia assessment tool in Japanese community-dwelling older populations. In the present study, we recruited 323 older adults aged ≥65 years, and 317 individuals agreed to participate (only six individuals refused). An excellent response rate (about 98%) for undergoing the 100-mL WST was shown among community-dwelling older adults. In addition, no participant had an adverse event on the 100-mL WST, indicating the test is safe and feasible. The novelty and importance of this study lie in its identifying which of the 100-mL WST indicators should be adopted in dysphagia screening. Specifically, low SC was the remarkable factor for predicting sarcopenic dysphagia among older adults.
Conclusions
All three quantitative indicators (SC, VS, and TS) in the 100-mL WST were associated with dysphagia risk factors among community-dwelling older adults aged ≥65 years.
Men were more likely to have choking signs in the qualitative assessment of the 100-mL WST compared to women, sug- gesting the utility of monitoring the progression of aspiration.
The 100-mL WST is feasible as a dysphagia screening test among community-dwelling older adults and can detect sar- copenic dysphagia at least by observing swallowing speed.
We propose that in assessing oral frailty, the two indicators of SC and choking signs in the 100-mL WST be included in a dysphagia screening tool for community-dwelling older people.
Conflict of interest
The authors have no conflicts of interest to declare.
Acknowledgment
We are grateful to all participants for their valuable contri- butions to the study. We also thank Ms. Fumiko Iwai and Ms. Chinatu Rokutanzono for their support with the data collection.
References
1. Ortega O, Sakwinska O, Combremont S et al. High prevalence of colo- nization of oral cavity by respiratory pathogens in frail older patients with oropharyngeal dysphagia. Neurogastroenterol Motil 27(12):1804- 16, 2015
2. Morimoto K, Suzuki M, Ishifuji T et al. Adult Pneumonia Study Group- Japan (APSG-J). The burden and etiology of community-onset pneumo- nia in the aging Japanese population: a multicenter prospective study.
PLoS One 10(3):e0122247, 2015
3. Wu MC, Chang YC, Wang TG, Lin LC. Evaluating swallowing dys- function using a 100-ml water swallowing test. Dysphagia 19(1):43-7, 4. Osawa A, Maeshima S, Tanahashi N. Water-swallowing test: screening 2004
for aspiration in stroke patients. Cerebrovasc Dis 35(3):276-81, 2013 5. DePippo KL, Holas MA, Reding MJ. The Burke dysphagia screening
test: validation of its use in patients with stroke. Arch Phys Med Rehabil 75(12):1284-6, 1994
6. Hughes TA, Wiles CM. Clinical measurement of swallowing in health and in neurogenic dysphagia. QJM. 89(2):109-16,1996
7. Patterson JM, Hildreth A, McColl E, Carding PN, Hamilton D, Wilson JA. The clinical application of the 100mL water swallow test in head and neck cancer. Oral Oncol 47(3):180-4, 2011
8. Bours GJ, Speyer R, Lemmens J, Limburg M, de Wit R. Bedside screen- ing tests vs. videofluoroscopy or fibreoptic endoscopic evaluation of swallowing to detect dysphagia in patients with neurological disorders:
systematic review. J Adv Nurs 65(3):477-93, 2009
9. Serra-Prat M, Palomera M, Gomez C et al. Oropharyngeal dysphagia as a risk factor for malnutrition and lower respiratory tract infection in independently living older persons: a population-based prospective study. Age Ageing 41(3):376-81, 2012
10. Kawashima K, Motohashi Y, Fujishima I. Prevalence of dysphagia among community-dwelling elderly individuals as estimated using a questionnaire for dysphagia screening. Dysphagia 19(4):266-71, 2004 11. Palacios-Ceña D, Hernández-Barrera V, López-de-Andrés A et al. Time
trends in incidence and outcomes of hospitalizations for aspiration pneumonia among elderly people in Spain (2003-2013). Eur J Intern Med 38:61-7, 2017
12. Butler SG, Stuart A, Wilhelm E, Rees C, Williamson J, Kritchevsky S.
The effects of aspiration status, liquid type, and bolus volume on pha-
ryngeal peak pressure in healthy older adults. Dysphagia 26(3):225-31, 13. Stoschus B, Allescher HD. Drug-induced dysphagia. Dysphagia 8(2):2011 154-9, 1993
14. Tanaka T, Takahashi K, Hirano H et al. Oral Frailty as a Risk Factor for Physical Frailty and Mortality in Community-Dwelling Elderly. J Gerontol A Biol Sci Med Sci 73(12):1661-7,2018
15. Belafsky PC, Mouadeb DA, Rees CJ et al. Validity and reliability of the Eating Assessment Tool (EAT-10). Ann Otol Rhinol Laryngol 117(12):
919-24, 2008
16. Wakabayashi H, Kayashita J. Translation, reliability, and validity of the Japanese version of the 10-item eating assessment tool (EAT-10) for the screening of dysphagia. Annals of Nutrition and Metabolism 29(3):75- 80, 2014 (in Japanese)
17. Maslan J, Leng X, Rees C, Blalock D, Butler SG. Maximum phonation time in healthy older adults. J Voice 25(6):709-13, 2011
18. Shiraishi A, Yoshimura Y, Wakabayashi H, Tsuji Y. Prevalence of stroke- related sarcopenia and its association with poor oral status in post-acute stroke patients: Implications for oral sarcopenia. Clin Nutr 37(1):204-7, 19. Mori T, Fujishima I, Wakabayashi H et al. Development, reliability, and 2016 validity of a diagnostic algorithm for sarcopenic dysphagia. JCSM Clinical Report 2(2):e00017, 2017
20. Maslan J, Leng X, Rees C, Blalock D, Butler SG. Maximum phonation time in healthy older adults. J Voice 25(6):709-13, 2011
21. Yamada M, Arai H, Sonoda T, Aoyama T. Community-based exercise program is cost-effective by preventing care and disability in Japanese frail older adults. J Am Med Dir Assoc 13(6):507-11, 2012
22. Ebihara S, Sekiya H, Miyagi M, Ebihara T, Okazaki T. Dysphagia, dys- tussia, and aspiration pneumonia in elderly people. J Thorac Dis 8(3):632-9, 2016
23. Ministry of Health, Labour and Welfare. The cause of Japanese death.
2009. Statistical table. (cited 2018 February 22) Available from: http://
www.mhlw.go.jp/toukei/saikin/hw/jinkou/suii09/deth8.html. (in Japa- nese)
24. Lindgren S, Janzon L. Prevalence of swallowing complaints and clinical findings among 50-79-year-old men and women in an urban population.
Dysphagia 6(4):187-92, 1991
25. Nimmons D, Michou E, Jones M, Pendleton N, Horan M, Hamdy S. A longitudinal study of symptoms of oropharyngeal dysphagia in an elderly community-dwelling population. Dysphagia 31(4):560-6, 2016