10
The Need for Competitive Research Grants to Promote The Vitalization of Young Research Scientists
YUKO ITO
Life Science and Medical Research Unit
10.1
Introduction
The Second Science and Technology Basic Plan (FY 2001-2005) suggested the pr ior itized expansion of research funding for young research scientists as a means to increase their independence. In response, the Ministr y of Education, Culture, Sports, Science and Technology added the lar ge Encoura gement of Young Scientists A grant to its Grants-in-Aid for Scientific Research program. Applications for the new grants, which target young research scientists age 37 or younger who are affiliated with universities or other institutions, became available in FY 2000, with grants to be disbursed beginning in FY 2002.
In addition, gover nment bodies outside the Ministry of Education, Culture, Sports, Science and Technology also began offering competitive research grants for young research scientists.
Research grants for young research scientists in the equivalent of U.S. full-time, tenure track assistant professor positions have just begun in Japan. It is vital that we understand the conditions faced by young research scientists in Japan as we consider the necessity of upgrading research grants in this country.
10.1.1 The necessity of support for young research scientists
If young research scientists are to be autonomous and independently follow their own
Source: 2001 White Paper on Science and Technology Figure 1:Distribution of ages at which Nobel Prize winning reseach was published(1981-2000)
ideas in research, they cannot be dependent on receiving funding from full professors and other senior researchers. They must therefore receive a certain amount of support. The 10 to 15 years following receipt of a doctorate are a particularly impor tant per iod for scientists to de velop independent research agendas and to begin research into their own ambitious ideas. As is shown in Figure 1, the peak a ge for Nobel laureates to have published the research that led to their awards in physiology or medicine and in physics is 35 to 39.[1]As scientists typically receive their doctorates in the second half of their 20s, this represents a period of about 10 years after receiving the degree. For the chemistry prize, the first peak is for ages 30 to 34, and the second is for
ages 40 to 44. This phenomenon suggests that we should consider dif ferences in the ways researchers are trained in these fields.
Moreover, the percentages of Nobel laureates who published their award winning work between the ages of 30 and 44 are 81 percent for physiology or medicine, 72 percent for chemistry, and 71 percent for physics. This suggests the possibility that in the fields of physiology and medicine in particular, those 15 years are a period when creative buds reach full flower.
In this report, we will consider the proper form for research grants that can help young research scientists at the university assistant professor level and similar positions to build their creativity and produce research that contr ibutes to the
Target K01
Mentored Research Scientist Development Award K02
Independent Scientist Award K05
Senior Scientist Award K07
Academic Career Award K08
Mentored Clinical Scientist Development Award
K12
Mentored Clinical Scientist Development Program Award
K18
Career Enhancement Award for Stem Cell Research
K22
Career Transition Award
K23
Mentored Patient-Oriented Research Career Development Award
K24
Midcareer Investigator Award In Patient- Oriented Research
K25
Mentored Quantitative Research Career Development Award
K26
Midcareer Investigator Award In Mouse Pathobiology Research
K30
Clinical Research Curriculum Development
Research scientists acquiring experience under a mentor, with the intention of pursuing independent research
Newly independent scientists
Independent scientists
Scientists aspiring to pursue independent clinical medical research
Scientists who have research experience under a mentor, and who aspire to pursue independent clinical medical research Scientists who have research experience under a mentor, and who aspire to pursue independent clinical medical research Scientists who require training in order to pursue research involving stem cells
Scientists with two or more years postdoctoral experience and less than two years as an independent investigator Scientists who have research experience under a mentor, and who aspire to pursue independent clinical medical research Clinical medical research scientists wit less than 15 years experience in clinical medical research
Scientists with engineering experience who aspire to pursue research in basic or clinical medical research
Scientists with less than 15 years experience in mouse pathobiology research
Scientists who are developing new training programs in the field of clinical medical research
3–5 years
5 years
5 years
2–5 years
3–5 years
5 years
6 months to 2 years
Up to 3 years
3–5 years
3–5 years
3–5 years
3–5 years
5 years
$125,900
(approx. ¥15 million)
$125,900
(approx. ¥15 million)
$125,900
(approx. ¥15 million)
$128,000
(approx. ¥15.3 million)
$120,000
(approx. ¥14.4 million)
$400,000
(approx. ¥48 million)
$166,700
(approx. ¥20 million)
$125,900
(approx. ¥15 million)
$140,000
(approx. ¥16.8 million)
$100,000
(approx. ¥12 million)
$140,000
(approx. ¥16.8 million)
$125,900
(approx. ¥15 million)
$200,000
(approx. ¥24 million)
Grant name Period Amount/year
Table 1:Overviews of K Awards
Source: Author’s compilation from information on the NIH website
worldwide progress of science. In particular, we will compare Japanese grants with the research grants available to young research scientists in the United States, and examine elements that should be incorporated into Japanese research grants for young scientists.
10.2
U.S. research grants for young research scientists (biology/medicine)
We will now examine the career development grants of the U.S. Department of Health and Human Services’ National Institutes of Health (NIH), the world’s largest biological and medical research institution as well as a major grant maker.
K Awards are developmental research grants (training grants), but they are clearly separated from the F and T Awards intended for graduate and post-doctoral students. These research grants are designed to support young research scientists in full-time positions who are at the stage of building careers and becoming independent researchers[2].
10.2.1 Types of K awards
The K Awards currently offered by NIH are shown in Table 1. NIH is a government institution focusing mainly on medical research. It supports young research scientists at various stages of their
careers with research grants. K Awards covering basic medical research are K01, K02, K05, K07, K18, K22, K25, and K26, while those for clinical medical research are K08, K12, K23, K24, and K30[2].
10.2.2 K Awards are developmental grants
The concept of “career developing” young research scientists is deeply imbedded in the K Awards. As can be seen in Figure 2-1 and 2-2, the various grants are designated with the clear differences in the career paths of basic and clinical researchers in mind.
10.2.3 Changes in total K Awards funding
As can be seen in Figure 3, K Awards funding increased rapidly beginning in 1999, with $400 million available in 2001, almost double the 1998 amount. This is approximately 2 percent of the entire NIH 2001 budget of about $20.5 billion. In 2001, 3,135 K Awards were granted[2].
10.2.4 Summary
In the past, NIH offered a grant called R29 for newly hired, full-time research scientists. That grant, however, was eliminated in June 1998. Since then, NIH has actively sought applicants for R01 grants, which have no restrictions on employment history and were promoted in the 19 December
Source: NIH website Figure 2-1:The concept behind K Awards for scientists in basic medical research
1997 NIH Guide (Volume 26, Number 40). R01 application for ms include a line to indicate whether the applicant is a newly hired full-time researcher.
It appears that the rapid increase in K Awards funding described in Section 10.2.2. above can be
attributed to NIH deciding to position those awards as the research grants for young scientists in place of R29 grants.
In addition to K Awards, R03 grants function as grants for young research scientists. At about
$50,000 per year, R03 grants are smaller than R01
Source: NIH website Figure 3:Changes in total monetary value of K Awards
Source: NIH website Figure 2-2:The concept behind K Awards for scientists in clinical medical research
grants, which begin at $50,000, and so are considered small grants. In most cases, R03 applications do not require preliminary research results. R03 grants are for challenging research that may not show results during the grant period and for the testing of new experimental methods.
10.3
Conditions for young research scientists in the U.S.
Comparing the number of doctorates awarded in the natural sciences (including engineering) in 1998 in Japan and the U.S., we find that almost three times as many were awarded in the U.S. as in Japan—19,566 to 6,576[3]. The number of
universities in the U.S., 1,478, is roughly double the 649 national, public, and private colleges in Japan (not including two-year colleges)[4]. Looking only at the numbers, there appears to be little difference in the opportunities for full-time research employment at universities in the two countries. Compared with Japan, however, the career paths of scientists in the U.S. can be much more difficult.
10.3.1 Research scientist career paths in the U.S.
A major difference between young research scientists in Japan and the U.S. is their postdoctoral career paths. Many scientists in the U.S. follow the path of PhD to postdoc to tenure
Source: Author’s compilation based on reference[7]
Figure 5:Factors “most important” in obtaining tenure according to U.S. academics
Source: Author’s compilation based on Science and Engineering Indicators 2002, National Science Foundation(1999 statistics).
Figure 4:Employment status of researchers at U.S.universities (4-7 year after acquisition of doctorate)
track to tenure. Tenure refers to the position held by scientists who have received the right to career-long employment, while tenure track refers to the position held by those eligible to possibly obtain tenure in the future. While regular full-time employment and fixed-term contract employment might be considered the equivalents of tenure and tenure track in Japanese universities, in 2001 only 2,884 university faculty, a mere 2 percent[5] of all university faculty in Japan, were employed under fixed-term contracts. It is not the ordinary career path for scientists in Japan. However, over the three years from 1998 to 2001, the number of such faculty increased by more than 29 times, so it bears watching whether a U.S.-style career path will develop in the future.
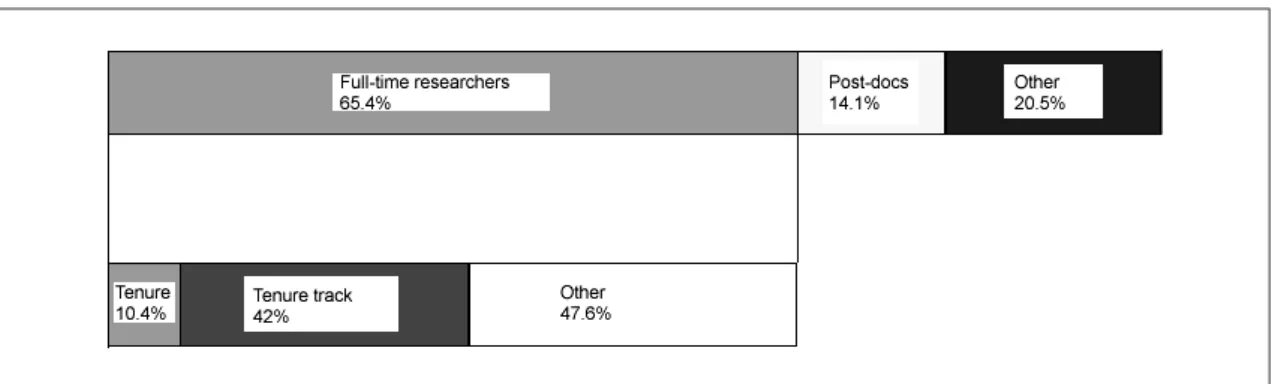
10.3.2 Ratio of tenure track personnel to all full-time academic employees
According to statistics in the U.S. National Science Foundation’s Science and Engineering Indicators 2002,[6] 65 percent of young research scientists (including faculty) emplo yed b y universities four to seven years after receiving doctorates were full-time employees. Of these, 10 percent had tenure, while 42 percent were tenure track (see Fiugre 4). The remainder, almost half of those full-time employees, were researchers (and instructors) who were neither tenured nor tenure track. Those in such circumstances must first obtain research results and then try to utilize those results to help secure a tenured or tenure track position. This shows the harshness of the career path for many young research scientists in the U.S.
10.3.3 Requirements for advancing from tenure track to tenure
At research universities (324 institutions), 96 percent of faculty members consider the number of publications and the number of research grants received to be the most important factor in advancing to tenured status (see Figure 5)[7]. Compared to tenure track, tenure guarantees stable employment and freedom to pur sue research. To obtain tenure, young research scientists must necessarily work to increase the number of grants they receive. It is believed that this fierce competition helps to raise the overall
quality of scientific research in the U.S.
10.3.4 Obtaining research grants contributes to the recipient’s organization
To research institutions, research grants are not only proof that a researcher’s work has been accepted b y outsider s, the y are also direct economic contributions. Called “overhead,” this is the requirement that the researcher give his or her institution a certain percentage of the grant to cover operating expenses. The percentage varies by university or institution. In the case of an institution requiring 100 percent of overhead, for example, if a researcher receiving a budget of
$30,000 from his or her institution receives a grant, that institution would receive a separate
$30,000 from the grant maker.
Certain private-sector research grants, however, specify that no overhead will be paid. In such cases, if a researcher at an institution requiring 50 percent overhead were to receive a grant of
$30,000, for example, he or she would have to pay
$15,000 overhead out of that grant.
Thus, researchers who obtain numerous large research grants are considered to be making an impor tant contr ibution to their research institutions.
10.3.5 Summary and problem areas
The stability and career advancement of young research scientists in the U.S. depend on their ability to obtain research grants. A research career without grants is inconceivable. Obviously, their attitude towards research grants will be different than that of young research scientists in Japan, who can expect lifelong employment. Young research scientists in the U.S. constantly face enormous stress, and career paths and survival strategies are widely discussed on the Internet[9].
10.4
Awareness of research grants among young
Japanese research scientists
As described above, obtaining research grants is impor tant to the career s of young research scientists in the US. Now we will look at how young research scientists in Japan view research grants.
The FY 2001 Survey of the Actual State of Research Activities in Japan, a survey performed by the Research Division, Science and Technology Policy Bureau, of the Ministr y of Education, Culture, Sports, Science and Technology and announced in September 2002 made clear the
attitudes of young Japanese research scientists towards research grants[10]. The survey targeted industry, academic, and government researchers who were listed as first or second authors of paper s registered in the Japan Science and Technology Corporation’s 2000 bibliographical
Source: Author’s compilation based on FY 2001 Survey of the Actual State of Research Activities in Japan Figure 7-1:Attitudes of Japanese scientists towards the percentage of research costs funded through competitive grants
(universities)
Source: Author’s compilation based on FY 2001 Survey of the Actual State of Research Activities in Japan Figure 6:The percentage of research budgets covered by competitive funding
database. A random sample of 1,200 was selected and questionnaires were mailed to them. Of the 889 valid responses received, 35 percent came from univer sities, 15 percent from public institutions, and 46 percent from the private sector. In each group, research scientists under the
age of 35 comprised about 10 percent of the whole.Those responding worked in diverse fields, including life sciences (22 percent), information and communications (18 percent), materials and nanotechnology (18 percent), environment (9 percent), and energy (8 percent).
Source: Author’s compilation based on FY 2001 Survey of the Actual State of Research Activities in Japan Figure 7-3:Attitudes of Japanese scientists towards the percentage of research costs funded through competitive
grants(private sector)
Source: Author’s compilation based on FY 2001 Survey of the Actual State of Research Activities in Japan Chart 7-2:Attitudes of Japanese scientists towards the percentage of research costs funded through competitive grants
(public institution)
10.4.1 The percentage of research costs covered by grants is increasing
The percentage of science and technology- related costs covered by competitive funding (research grants) is increasing each year, as is the amount (2.4-fold from 1995 to 2000)[1]. Next we will look at the percentage of the research costs of those targeted by the survey that is covered by competitive research funding (research grants).
The same question was asked in the 2000 survey. Figure 6 compares the results from 2000 and 2001. The responses are the percentage of laboratory and group research budgets covered by competitive funding rather than of individual budgets.
In universities, public institutions, and the private sector, the percentage of those responding that they receive less than 10 percent of their funding through competitive grants all declined from 2000 to 2001. In universities and public institutions, the percentage responding that they receive 50 to 100 percent of funding through competitive grants increased from 2000 to 2001, as did the percentage of private sector institutions receiving between 10 and 30 percent of their funding through competitive grants.
10.4.2 Young research scientists who welcome the introduction of research grants, and young research scientists who do not
What do scientists, and young scientists in particular, think of the fact that competitive funding (research grants) is increasing every year?
The responses of scientists to the question
“What do you think of increasing the percentage of science and technology research costs funded through competitive grants?” are broken down by type of institution and age in Figures 7-1, 7-2, and 7-3.
Over 50 percent of scientists aged 30 to 34 and affiliated with universities responded that the percentage funded through competitive grants should be increased.That was a higher percentage than any other group. They also had the lowest percentage responding that the percentage covered by ordinary funding should be increased.
Those aged 35 to 39 had the highest percentage responding that the ordinary funding percentage should be increased.
In all a ge groups, researcher s at public institutions (Figure 7-2) had lower percentages responding that the percentage funded through competitive grants should be increased than did
Source: FY 2001 Survey of the Actual State of Reaserch Activities in Japan Figure 8:Percentage of research funding covered by competitive grants in Japan (by age)
the same age groups in universities or private sector institutions. In the 30 to 34 age group, identical percenta ges responded that the competitive funding percenta ge should be increased and that the ordinar y funding percentage should be increased.The older the age group, the larger the percentage responding that the status quo should be maintained, and the fewer responding that the ordinar y funding percentage should be increased.
Among private sector research scientists (Figure 7-3), the 30 to 34 age group had the lowest percentage responding that the competitive funding percentage should be raised.The older the age group, the higher the percentage saying it should be increased. The 30 to 34 age group had the highest percentage responding “Don’t know,”
and the older the age group the fewer offering that response.
Research scientists in the 30 to 34 age group showed a high awareness of the concept of introducing competitive funding, yet the 35 to 39 group displayed a passive attitude. This difference is believed to stem from differences in job status.
Seventy percent of the 30 to 34 group said that they were in the “assistant professor/lecturer class,” while the 35 to 39 group said they were in the “associate professor class.” We must examine why the attitude of research scientists towards competitive grants becomes passive as their job status improves and they begin operating their own labs.
Among research scientists in public institutions and in the private sector, the 30 to 34 group showed a passive attitude towards competitive grants, while each older age group showed an increasingly high awareness of them.
What is the origin of these different attitudes towards competitive funding?
10.4.3 The research budgets of young scientists come primarily from ordinary funding
As we discussed in Section 10.4.2 above, with the exception of the 30 to 34 age group at universities, older groups tend to have more positive attitudes towards competitive funding. In order to better understand why younger research scientists are more passive towards the idea of
competitive grants, we compiled a table (Figure 8) showing funding percentages by age group.
Among those under 35, 60 percent responded that they receive 0 percent of their funding through competitive grants.
It is believed that young research scientists who receive funding primar ily through ordinar y funding fear that such funding will be cut and their research hindered if competitive funding is increased.
10.4.4 Struggling research scientists at universities
In order to under stand the attitudes of university research scientists towards research funding to a greater degree than was possible with those statistics, those who responded that competitive or ordinar y funding percentage should be increased in Section 10.4.2 above were asked follow-up questions. We will now discuss those results.
Among those in the 30 to 34 group who responded that the competitive funding percentage should be increased, the reason most often given was “Research fund amounts difficult to obtain through ordinary budgeting could be received.” In the 35 to 39 group, the most common answers were “It would promote scrapping and rebuilding in research” and “It would help loosen stagnant research budgets.” The most common responses of the 50 to 59 group were “Funding would go only to research that is acceptable” and
“Research would improve as researcher s competed for funding.”
Among those responding that the ordinar y funding percentage should be increased, the most common reasons given by those in the 30 to 34 and 50 to 59 groups were “Competitive funding might cause research to be influenced by fads, and funds might flow only to certain fields.” Among those aged 35 to 39, the most common answer was “Those who don’t obtain competitive grants might not be able to continue their research.”
Perhaps it is only natural that research scientists in age groups that would struggle to steadily secure competitive grants should take a passive attitude towards their introduction.
10.4.5 Young research scientists worry about obtaining research grants
How many competitive grants do young research scientists in Japan obtain?
Responses to the question “How many competitive grants have you personally applied for and obtained?” as of the time of the sur vey
(December 2001) are shown in Figures 9-1, 9-2, and 9-3[10].
Among university research scientists (Fiugre 9- 1), over 50 percent of those aged 30 to 34 said they had obtained no grants at all. Almost 80 percent of those aged 35 to 39 had received at least one.
Source: Author’s compilation based on FY 2001 Survey of the Actual State of Research Activities in Japan Figure 9-1:Grants personally obtained (universities)
Source: Author’s compilation based on FY 2001 Survey of the Actual State of Research Activities in Japan Figure 9-2:Grants personally obtained (public institution)
Among research scientists at public institutions (Figure 9-2), 80 percent of those aged 30 to 34 said they had obtained no competitive grants. Over 50 percent of those in the 35 to 39 group, however, said they had obtained at least one grant.
In the private sector (Figure 9-3), over 90 percent of research scientists aged 30 to 34 said they had received no competitive grants.Although the number of those saying they had received at least one grant increased with each higher age group, at only about 20 percent the figure was very low compared with the university and public institution researchers.
In each type of institution, the percentage of research scientists aged 30 to 34 obtaining research grants is low compared to older age groups.
10.4.6. Are young research scientists competing for research grants?
To address the question of whether young research scientists are aspir ing to obtain competitive grants but failing because of the high degree of competition, we compiled Figures 10-1, 10-2, and 10-3, “Number of competitive grants applied for during the past 5 years (by age) [10].”
Among university research scientists (Figure 10- 1), over 90 percent in each age group said they
have applied for at least one competitive grant in the last five years. Compared with other age groups, the large number of those aged 30 to 34 who had applied for no more than a single grant stands out. Fifty percent of university research scientists had applied for four or more grants over the previous five years.
At public research institutions (Figure 10-2), close to 60 percent of research scientists aged 30 to 34 had applied for no competitive grants in the past five years. Among those aged 35 to 39, however, over 75 percent had applied for at least one grant.
In the private sector (Figure 10-3), 80 percent of research scientists aged 30 to 34 had applied for no competitive grants during the previous five years.The percentage of those applying for at least one grant increased in each higher age group, with 45 percent of those in the 50 to 59 group having applied for at least one.
Young research scientists at universities are applying for grants, but are failing to obtain them.
On the other hand, young research scientists at public institutions and in the private sector apply for few grants, and from the beginning of their careers generally do not participate in the quest for competitive funding.
Source: Author’s compilation based on FY 2001 Survey of the Actual State of Research Activities in Japan Figure 9-3:Grants personally obtained (private sector)
10.4.7 Summary
The differences in the issues facing young research scientists at univer sities, at public institutions, and in the private sector are clear.
Young research scientists at universities are actively applying for competitive grants, but are obtaining few. At public institutions, young
research scientists show less interest in competitive grants than their university peers and want ordinary funding to be increased.They apply for few grants, so a high percentage of them have never obtained one. Interest in competitive funding among young research scientists in the private sector is similarly low, and they rarely
Source: Author’s compilation based on FY 2001 Survey of the Actual State of Research Activities in Japan Chart 10-1:Grants applied for during previous 5 year (universities)
Source: Author’s compilation based on FY 2001 Survey of the Actual State of Research Activities in Japan Figure 10-2:Grants applied for during previous 5 year (public institution)
apply for grants. The percenta ge of young scientists in the private sector who have obtained at least one grant is thus extremely low.
To develop policies to vitalize young research scientists, it is therefore necessary to consider strategies appropriate to each type of institution.
Young research scientists at universities need to be able to increase the number of grants they receive through the expansion of “young scientist research grants” that are not dependent on a long record of successful research. If the status quo continues, it will tend to discourage the ambition of these young researchers.
Young research scientists at public institutions need to change their attitude towards research grants, and the relevant government agencies need to support them with early career grants.
Young research scientists in the private sector need the support of research grants. Under the Basic Technical Research Promotion Program (Private Sector Basic Research Support System), the Ministr y of Economy, Trade and Industr y provides research support to private sector enterprises. We would like to see early career research grants included among such research grants.The fact that the winner of the latest (2002) Nobel Prize in chemistry works in the private sector and received the award for work begun in
his 20s shows how important research support for young research scientists in Japan can be to the development of this country’s scientific research.
10.5
Comparison of research grants for young scientists in Japan and the U.S.
We will now examine major early career research grants from government funds in Japan and the U.S., and consider issues facing such grants in Japan.
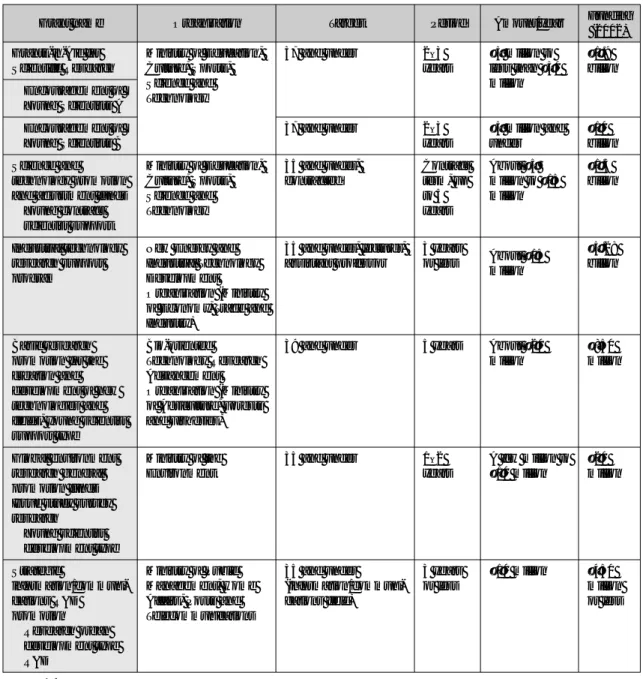
10.5.1 Targets of young scientist research grants
Tables 2-1 and 2-2 show major early career research grants (provided from government funds) in Japan and the U.S. The biggest difference between them is in the “Target” category. While in the U.S. the y are limited b y “year s as an independent investigator,” in Japan restrictions are cur rently based simply on a ge. Using a ge restrictions excludes many people, such as those who have worked before returning to graduate school or who previously pursued another field.
10.5.2 Grant amounts
A major grant in the U.S. when converted to yen
Source: Author’s compilation based on FY 2001 Survey of the Actual State of Research Activities in Japan Chart 10-3:Grants applied for during previous 5 year (private sector)
is typically around ¥12 million. This includes part or all of the scientist’s salary. In the case of a research scientist one to four years beyond his or her doctorate, the average salary is about $50,000 (¥6 million),[11]so if that entire amount were taken from the grant it would leave about ¥6 million for research.
In Japan, on the other hand, grants can generally be divided into those of ¥5 million or less and those of ¥10 million or more. Because Japanese research scientists do not need to draw their salaries from grants they receive, they can apply almost all of the money to research. Thus it is possible for young Japanese research scientists receiving ¥10 million grants to have more funds to
apply to their research than their U.S. counterparts who receive nominally larger grant amounts.
However, for reasons explained in Chapter 10-3 above, a majority of U.S. research scientists have more than one grant at a time, so the amount of money available to them to spend on research is, in fact, often greater.
10.5.3 Comparing early career research grants in Japan and the U.S. based on the number of young research scientists
Grants-in-Aid for Scientific Research is Japan’s largest research grant program, and it covers a wide array of fields, from the humanities and social sciences to the natural sciences. In the U.S.,
Grant name Grants-in-Aid for Scientific Research Encouragement of Young Scientists A Encouragement of Young Scientists B Science and technology promotion and adjustment funds Young contract scientist support Industrial technology research support program
Basic research promotion for the creation and development of new technologies and fields, young scientist support type Global environment research general promotion funds Issue study survey research
Young scientist development type Strategic
information/communi- cations R&D promotion
Research organ development type R&D
Ministry of Education, Culture, Sports, Science and Technology
Ministry of Education, Culture, Sports, Science and Technology
New Energy and Industrial Technology Development Organization (Ministry of Economy, Trade and Industry)
Bio-oriented
Technology Research Advancement Organization (Ministry of Agriculture, Forests and Fisheries)
Ministry of the Environment
Ministry of Public Management, Home Affairs, Posts and Telecommunications
37 and under
37 and under
35 and under, contracted
35 and under, lecturer, assistant professor
39 and under
35 and under
35 and under (information/communi- cations field)
2–3 years
2–3 years Contract term, up to 5 years
3 years or less
5 years
1–2 years
3 years or less
¥5 million to less than ¥30 million
¥5 million and under About ¥5 million to ¥15 million
About ¥15 million
About ¥20 million
A few million to
¥10 million
¥10 million
¥1.9 billion
¥10 billion
¥1.5 billion
¥5.28 billion
¥850 million
¥20 million
¥450 million or less
Organization Target Period Amount/year Funding
(2002)
Source: Author’s compilation from information on relevant government websites and direct contact with relevant personnel
Table 2-1:Major research grants for young scientists in Japan (government funded)
National Science Foundation (NSF) research grants support a similar wide variety of fields. According to statistics in the NSF’s Science and Engineering Indicators 2002,[6] however, NIH supplies 60 percent of U.S. government research grants, while the NSF provides only 15 percent. Therefore the Grants-in-Aid for Scientific Research’s young scientist program combines the NSF’s CAREER Program and NIH’s K Awards. In Table 3, we estimate the number of those eligible for the grants and the actual percentages obtaining them.
People affiliated with national, public, or private
univer sities compr ise 91.5 percent of all applicants for Grants-in-Aid for Scientific Research[12]. If this percentage holds true for
“young” applicants, of the 15,720 applicants for Encouragement of Young Scientists A and B grants (young scientists may apply for only one of either at a time), approximately 14,400 were affiliated with national, public, or private universities. As of 1 October 2001, there were 40,660 university faculty members (not including those at two-year colleges) in Japan who met the Encouragement of Young Scientists criterion of being age 37 or
Applicants Selected
(% selected) Average award No. eligible to apply Grants-in-Aid for Scientific
Research Encouragement of Young Scientists A (FY 2002)
Encouragement of Young Scientists B
NSF CAREER Program (2002)
NIH K Awards (2001) Encouragement of Young Scientists B
1,999
13,721
―
―
206 (10.3%)
4,155 (30.3%)
394
3,135 (40-60%)
¥9.22 million
¥1.65 million
$60,000–$80,000 (approx. ¥7.2–9.8 million)
$128,000
(approx. ¥15 million)
University faculty age 37 or younger (as of 1 October 2001) 40,660
Junior faculty with doctorates (1999)
47,368
$1=¥120 Source: Author’s compilation from information on various websites, etc.
Table 3:Comparison of young scientist grants in Japan and the U.S.
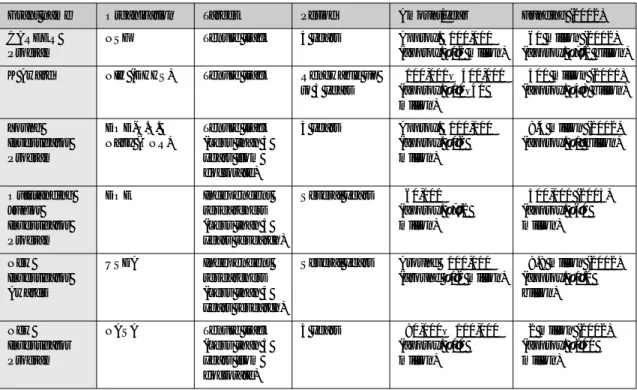
Grant name CAREER Program K Award
Young Investigator Program
Outstanding Junior Investigator Program New Investigator Awards
New Investigator Program
Organization NSF
NIH (DHHS)
DOD-U.S.
Navy (ONR)
DOE
USDA
NASA
Target Tenure track
Tenure track
Tenure track (Less than 5 years from doctorate) Independent researchers (Less than 5 years research) Independent researchers (Less than 5 years research) Tenure track (Less than 5 years from doctorate)
Period 5 years
Renewable up to 5 years
3 years
Several years
Several years
3 years
Amount/year Approx. $100,000 (approx. ¥12 million)
$100,000–$400,000 (approx. ¥10–40 million)
Approx. $100,000 (approx. ¥12 million)
$60,000 (approx. ¥7.2 million)
Around $100,000 (around ¥12 million)
$80,000–$100,000 (approx. ¥10 million)
Funding (2002)
$60 million (2002) (approx. ¥7.2 billion)
$400 million (2001) (approx. ¥48 billion)
$8.4 million (2002) (approx. ¥1 billion)
$500,000 (2003) (approx. ¥60 million)
$9.8 million (2002) (approx. ¥1.2 billion)
$2 million (2002) (approx. ¥200 million)
$1=¥120
(Japanese translations of names of U.S. government bodies are from the FY 2001 Indicators of Science and Technology.) Source: Author’s compilation from information on relevant U.S. government websites
Table 2-2:Major research grants for young scientists in U.S. (government funded)
under[13]. Thus, an estimated 35 percent of them applied for a Grant-in-Aid for Scientific Research.
The number of those selected for Encouragement of Young Scientist A and B grants was 4,361, so apparently about 11 percent of those eligible received a grant. Grants-in-Aid for Scientific Research are paid over a two to three year period, and only one new or continuing Encouragement of Young Scientists A or B grant at a time may be applied for, so the actual percentage obtaining grants may actually be 22 to 33 percent.
The number of full-time junior faculty with doctorates (a criterion for research grants) in the U.S. is 47,368[14]. As described in Chapter 10-3 above, 42 percent of them are tenure track (another criterion), so an estimated 19,900 are eligible for research grants. The number of Career Program grants and K Awards actually given was 3,529, so an apparent 18 percent of those eligible receive them. However, since Career Program grants and K Awards are disbursed over five years and only one can be applied for at a time, the actual percentage of those obtaining such a grant may actually be close 90 percent.
10.5.4 Summary
Although Table2-1 and 2-2 show little difference between young scientist research grants in Japan and the U.S., differences are seen in the “Average disbur sement per grant” and “selection percentage” columns in Table 3. Furthermore, the most common grant in Japan, the Encouragement of Young Scientists B grant, is a small grant averaging ¥1.65 million. The most common grants in the U.S., the K Awards, average ¥15 million, almost 10 times as much.
10.6
Finally
Young research scientists face dif ferent situations and hold different attitudes. Young research scientists in Japan are very fortunate in terms of employment stability. Although many Japanese scientists believe their counterparts in the U.S. are free to pursue research without interference, they are in fact bound to the research grant system.Their time is taken up with applying for various grants with different deadlines and with writing interim and final reports. These
reports must be both longer and more detailed than ordinary technical papers. An unacceptable interim report can lead to a merciless reduction of the coming year’s funding. Changes in government policy can cause decreased (or increased) funding without notice. Research grants must often be used to pay the salaries of postdocs and other research assistants and partners. In some cases postdocs must be laid off because of sudden funding cuts, and it is not unusual for scientists to shut down their labs and move into the private sector.
In contrast, young research scientists in Japan can expect career-long employment, and do not need to obtain grants to ensure career stability.
This makes it easier for them to pursue long-term research that may not offer immediate results.
10.7
Conclusion
As we have described, the environments for research scientists in Japan and the U.S. are quite different. For that reason, the introduction of a U.S.
style competitive system would not serve to vitalize young research scientists in Japan. Instead, we must consider effective ways to support research in Japan based on an understanding of the harshness of the science career path in the U.S. and the positive aspects of that career path in Japan.
10.7.1 Issues and policies
We believe the following are the major problem areas with Japanese early career research grants in comparison with U.S. grants.
(1) The perspective of researcher development is absent.
(2) The concept that obtaining research grants is proof of the independence and autonomy of a researcher is absent.
Simply increasing the budget for research grants is not sufficient to address these issues. Regarding (2) in particular, a change in the attitudes not only of the young research scientists themselves, but also of professors and other senior personnel at their affiliated laboratories is required. However, (1) could be addressed by incorporating the
concept of diversity into early career research grants.
10.7.2 Proposals
We propose that the following be incorporated into research grants for young research scientists.
(1) Incorporate the perspective of researcher development
(A) Applications based on research history rather than age
Do not exclude scientists who differ from the norm, such as those who have worked full-time before entering graduate school or who previously pursued another field.
(B) Create grants for researchers at early career stages
Provide support for scientists at stages such as
“newly hired as a full-time research scientist” or
“less than five year s as a full-time research scientist.” Provide support also for research scientists pursuing high-risk, challenging research or who have recently changed fields.
(C) Increase individual grant amounts and the number of grants
Research grant applications provide a perfect opportunity for scientists to objectively evaluate their own research projects. It is important that many research scientists take advantage of these opportunities at an early stage in their careers.This is another good reason to invest large amounts of funding into research grants targeting young research scientists.
(2) Foster the concept that obtaining research grants is proof of the independence and autonomy of a researcher.
(D) Clarify the role of senior researchers Applicants for research grants should not only be per sons car r ying out the research and representatives of the laboratory, but also senior researchers.
The evaluation system for all research grants, not just those for young scientists, should be
reformed. Rigorous interim evaluations are more impor tant than r igorous final evaluations.
Evaluations should be made not based on how many papers are published, but on whether the research car r ied out confor ms to the grant application. The reporting of any changes should be made mandatory. Evaluations should be used to advise that grants in the next year be increased or decreased, or that the researcher should be advised to seek a higher-level grant, and so on.
Acknowledgements
We would like to express our gratitude to the Research Division, Science and Technology Policy Bureau, of the Ministry of Education, Culture, Sports, Science and Technology for kindly allowing us to use statistics from the FY 2001 Survey of the Actual State of Research Activities in Japan.
References
[1] 2001 White Paper on Science and Technology. Ministry of Education, Culture, Sports, Science and Technology.
[2] From NIH web pages (http://www.nih.gov, http://grants.nih.gov/training/kawardresearch .htm).
[3] U.S. natural science doctorates are 1998 figures taken from Science and Engineering Indicators 2002, National Science Founda- tion. The total includes doctorates in natural sciences (physics, chemistry, astronomy, earth, atmospher ic sciences, ocean sciences, biological sciences, agricultural sciences), mathematics and computer sciences, and engineer ing. Japanese natural science doctorates are FY 1998 figures taken from the 2002 Educational and Scientific Statistical Summar y, Ministr y of Education, Culture, Sports, Science and Technology. The total includes doctorates in the physical sciences, engineering, and agricultural science.
[4] Japanese figures are from the 2001 Educational Statistical Summary. The total is for national, public, and private colleges, not including two-year colleges. The number is from 2000 statistics. U.S. totals are from the Car negie Foundation’s 2000 Carneg ie Classification of Institutions of Higher Education. The total was reached by adding
the Car negie Foundation’s count of doctoral/research univer sities, master’s colleges and universities, and baccalaureate colleges. Two-year colleges are not included.
The number is from 2000 statistics.
[5] Number of contract faculty is from Daigaku nioker u Cur r iculum touno Kaikaku Joukyou nitsuite, 19 December 2001, University Division, Higher Education Bureau, Ministry of Education, Culture, Sports, Science and Technology. University faculty figures for 2001 are from the 2002 Educational Statistical Summary.
[6] Science and Engineering Indicators 2002, National Science Foundation.
[7] Richard M. Reis, 1997, Tomorrow’s Professor:
Preparing for Academic Careers in Science and Engineering, IEEE Press.
[8] Carnegie Foundation categories. RES. I & RES.
II are Research University I & II. DOC. I & II are Doctoral University I & II. Those four classes of university carr y out high-level research and grant doctoral degrees. LA I & II are Liberal Ar ts Colleges I & II. Now categorized as Baccalaureate (Liberal Arts) Colleges I & II, their focus is on under- graduate education.
[9] T he Chronic le of Higher Education (http://chronicle.com/), Tomor row’s Professor Listserv (http://sll.stanford.edu/
projects/tomprof/newtomprof/postings.html) [10]FY 2001 Sur vey of the Actual State of Research Activities in Japan, September 2002, Research Division, Science and Technolog y Policy Bureau, Ministr y of Education, Culture, Spor ts, Science and Technology.
[11] Average salar y for doctorate holder s in scientific fields is taken from Science and Eng ineering Indicator s 2002, National Science Foundation.
[12] Information on Grants-in-Aid for Scientific Research is from the Japan Society for the Promotion of Science website (http://www.
jsps.go.jp/j-grantsinaid/).
[13] The number of university faculty is from Heisei Juusannen Gakkou Kyouin Toukei Chousa Chuukan Houkoku, September 2002, a survey by the Lifelong Learning Policy Bureau of the Ministry of Education, Culture, Sports, Science and Technology. Numbers are as of 1 October 2001.
[14] The number of full-time junior faculty with doctorates is from Science and Engineering Indicators 2002, National Science Founda- tion. Doctorates are in mathematics;
computer sciences; earth, atmospheric, and ocean sciences; life sciences; psychology;
social sciences; and engineering.
(Original Japanese version: published in December 2002)