Imaging and time‑resolved study of
laser‑induced fluorescence of dysprosium atoms injected into superfluid helium
Author P. Moroshkin, K. Kono journal or
publication title
Physical Review B
volume 101
number 13
page range 134520
year 2020‑04‑28
Publisher American Physical Society
Rights (C) 2020 American Physical Society Author's flag publisher
URL http://id.nii.ac.jp/1394/00001515/
doi: info:doi/10.1103/PhysRevB.101.134520
Imaging and time-resolved study of laser-induced fluorescence of dysprosium atoms injected into superfluid helium
P. Moroshkin1,2,*and K. Kono 1,3
1RIKEN, CEMS, 2-1 Hirosawa, Wako, Saitama 351-0198, Japan
2Okinawa Institute of Science and Technology, 1919-1 Tancha, Onna-son, Okinawa 904-0495, Japan
3International College of Semiconductor Technology, National Chiao Tung University, Hsinchu 300, Taiwan
(Received 23 October 2019; revised manuscript received 5 April 2020; accepted 7 April 2020;
published 28 April 2020)
We study the time evolution of the cloud of Dy atoms dispersed in superfluid helium and investigate the possibility of using these atoms as tracers for the imaging of superfluid-helium flows. The atoms are produced by pulsed laser ablation and are visualized via their laser-induced fluorescence. It turns out that the observation time is limited by the optical pumping of the atomic population into a nonabsorbing metastable state which is also responsible for the saturation of the fluorescence yield observed earlier.
DOI:10.1103/PhysRevB.101.134520
I. INTRODUCTION
Imaging the motion of tracer particles moving together with the liquid is a powerful method to visualize the liquid flow. It has been used in the studies of various systems, includ- ing quantum fluid4He. Introduction of the tracer particles into this cryogenic liquid represents a major experimental chal- lenge. Typically, micron-sized solid hydrogen, deuterium, or frozen air particles are used in visualization studies of thermal counterflow, quantized vortices, and quantum turbulence in superfluid He [1–8].
A good tracer should be an efficient scatterer of the visible light and at the same time be as small as possible in order to minimize the disturbance of the liquid flow. It is also important that the tracers have a well-defined size and shape and are not heated by the illuminating light since the heat dissipation may significantly affect the liquid flow in the vicinity. From this perspective, single atoms and molecules of certain species are considered promising candidates for the flow visualization studies in superfluid helium. Another advantage of the atomic and molecular tracers is that their laser-induced fluorescence usually has a wavelength shifted with respect to that of the excitation laser. This enables an efficient spectral filtering and suppression of the unwanted scattered laser light from the sample cell walls, windows, and density fluctuations of the liquid.
A cloud of impurity atoms suspended in superfluid He was imaged for the first time in the pioneering experiments by the Heidelberg group [9,10]. In those experiments, Ba+, Mg+, and Tl+ ions were injected into superfluid 4He and then recombined with free electrons produced by a field emission tip. The fluorescence emitted by the resulting cloud of electronically excited atoms was imaged and provided
*Present address: Brown University, School of Engineering, Provi- dence, Rhode Island 02912, USA; [email protected]
information about the drift velocity of the ions in the external electric field.
Fluorescing He∗2 excimer quasimolecules were used as tracers for the visualization of the counterflow in superfluid helium [11–14]. The excimers in a metastablea3ustate were produced either by an electric discharge near a high-voltage tip or by a laser breakdown in liquid He induced by focused femtosecond laser pulses. The cloud of excimers was imaged using the laser-induced fluorescence excited via an infrared two-photona3u−d3utransition.
Optical spectra of many atomic and molecular impurities in liquid and solid He matrices are strongly broadened by the interaction with surrounding helium (for a review see [15]). This spectral broadening greatly reduces the absorption probability for the resonant laser radiation, which leads to a low fluorescence yield and poses a serious problem for the imaging studies. Inner-shell 5f-4d electronic transitions of lanthanide elements are much less broadened due to the screening effect of the electrons in the outer 6sshell [16–19].
These transitions are therefore much better suited for imaging.
In our recent publications [18,19] we investigated the absorption spectrum of the 5I8-5K7 inner-shell transition of Dy atoms in superfluid helium and confirmed its exceptionally small spectral width. Here, we present an extension of that study and report the imaging of the Dy atomic cloud in liquid helium using the laser-induced fluorescence. We investigate the dynamics of the laser-induced fluorescence and the sat- uration of the fluorescence yield at a high excitation laser power.
II. EXPERIMENT A. Experimental setup
The experimental setup is described in our recent publi- cation [19]. The experiments are carried out in an optical helium-bath cryostat cooled to 1.35–2.1 K by pumping on the helium bath. The side view of the sample cell and the configuration of the laser beams are shown Fig.1.
P. MOROSHKIN AND K. KONO PHYSICAL REVIEW B101, 134520 (2020)
liquid He
Dy target
cw laser
pulsed laser 1
pulsed laser 2 dichroic
mirror sample cell
FIG. 1. Side view of the experimental sample cell.
Superfluid He in the sample cell is doped with dysprosium atoms by means of laser ablation using two nanosecond pulsed lasers. The primary ablation of a metallic Dy target by a frequency-tripled DPSS laser (λ=355 nm) produces mostly metal clusters and nanoparticles. Dy atoms are produced by the secondary ablation and sputtering of these nanoparticles by another, more powerful pulsed laser. The primary ablation laser has a repetition rate of 20–100 Hz and a pulse energy of 70μJ. It is expanded to a diameter of 2 cm and then focused on the target by a f =15 cm lens mounted on a motorized XY translation stage that is moving in a plane orthogonal to the laser beam. In this way we move the ablation spot along the target surface within an area of 2×1 mm, thus avoiding drilling of a crater. For the secondary sputtering we use either a frequency-doubled Nd:yttrium aluminum garnet (YAG) laser (λ=532 nm) with a maximum repetition rate of 10 Hz and a pulse energy of 0.5–15 mJ or a frequency-tripled Nd:YAG laser (λ=355 nm) with a maximum repetition rate of 20 Hz and a pulse energy of 1.5–6.5 mJ. The secondary laser beam is expanded to a diameter of 2.5 cm and then focused in the middle of the sample cell, above the Dy target, as shown in Fig.1.
Dy atoms in liquid He are excited by a second harmonic of a tunable cw Ti:sapphire laser superimposed on the secondary sputtering laser beam using a dichroic mirror. For the spec- troscopy studies, we use an approximately parallel or slightly converging cw laser beam. For the imaging experiments, the beam was expanded by a telescope up to a diameter of 2–5 mm and was significantly broader than the secondary pulsed laser beam over the whole length of the sample cell (see Fig.1). Laser-induced fluorescence is collected at a right angle with respect to the laser beams and is analyzed with a grating spectrograph equipped with a CCD camera and a photomultiplier tube (PMT).
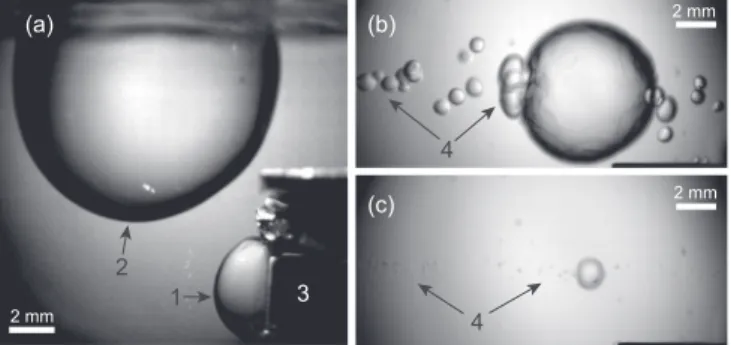
The ablation process is monitored with a high-speed digital complementary metal-oxide semiconductor (CMOS) video camera oriented orthogonal to the laser beams and operated at a frame rate of 500–8500 fps. The camera is equipped with a macro-objective with adjustable focal distance and magnification1. In Fig.2we show selected frames from a typical video recording made via a side window. The interior of the cell is illuminated by a collimated beam of a powerful LED shining through the opposite side window.
For the imaging of the atomic fluorescence we use either the same high-speed CMOS camera or a thermoelectrically cooled CCD camera. In both cases the image is produced
) b ( )
a (
(c)
1 2
3
4 4
2 mm
2 mm
2 mm
FIG. 2. Selected frames from three high-speed video recordings showing laser-induced gas bubbles in liquid He. 1, a bubble at the primary ablation spot; 2, a bubble due to the breakdown in the secondary laser focus; 3, ablation target; 4, a string of small bubbles along the secondary laser beam. Each picture corresponds to the moment when the bubbles reach their largest size. Exposure time is 1.6 ms. (a) T =1.35 K, delay time with respect to the secondary laser pulse τ=11.4 ms, pulse energy WLas=11.5 mJ; (b) T = 2.06 K,τ=3.2 ms,WLas=14 mJ; and (c)T =2.06 K,τ=1.6 ms, WLas=7.0 mJ.
by the same macro objective. The scattered light from all three laser beams was suppressed by a low-pass interference filter with a cutoff wavelength of 600 nm. Due to the low fluorescence intensity, the CMOS camera had to be operated at a relatively low frame rate of 10–50 frames/s. The CCD camera was used to take still images of the atomic cloud at a chosen delay time with respect to the secondary sputtering laser pulse with an exposure time of 1–100 ms.
B. Microparticles and laser-induced gas bubbles In Fig. 2(a) one can see a typical image of gas bubbles produced by the laser ablation at the lowest accessible temper- ature of 1.35 K. There is a hemispherical gas bubble centered at the primary ablation spot on the target surface. It expands and collapses over≈10 ms following each primary ablation laser pulse. The bubble reaches a maximum diameter of ≈ 5 mm and does not perturb the sample volume illuminated by the cw laser beam.
Another gas bubble is formed in the middle of the cell when the secondary sputtering laser pulse hits a metallic particle passing through its focal region. The image in Fig. 2(a) corresponds to a large laser pulse energy, WLas 10 mJ.
Under these conditions, we obtain a laser breakdown in liquid He in the laser focus accompanied by a bright flash of light containing spectral lines of He atoms and He∗2excimers. The breakdown is followed by the rapid growth of a large spherical gas bubble reaching a diameter of 5–20 mm, as shown in Fig. 2(a). The bubble growth and collapse take 10–20 ms and strongly affect the measurements of the laser-induced fluorescence from Dy atoms.
Since the helium in the sample cell is always under a sat- urated vapor pressure, the increase in the helium temperature from 1.35 to 2.1 K leads to the pressure increase from 200 to 4000 Pa. This external pressure applied to the liquid has a pronounced effect on the laser-induced bubbles. At a higher temperature, the lifetime of the bubble and its maximal radius become 2–3 times shorter than at T =1.35 K. This effect is 134520-2
illustrated in Fig.2(b), showing the secondary bubble at its largest expansion atT =2.06 K. One can also see a string of smaller bubbles along the track of the secondary laser beam.
We expect that each of the smaller bubbles corresponds to a Dy nano- or microparticle heated and probably destroyed by the secondary laser pulse. Formation of similar small gas bubbles around injected nanoparticles was studied in detail in [20].
The largest and most stable Dy fluorescence yield was achieved at a moderate secondary pulse energy WLas= 3–7 mJ, below the breakdown threshold. A typical image is shown in Fig.2(c). Under these conditions no large bubble is produced in the laser focus. We still observe a string of very small bubbles appearing along the track of the secondary pulsed laser beam. Their diameters do not exceed 0.5 mm, and the bubbles disappear typically within 2 ms. The laser- induced fluorescence spectra reported below and in [18,19]
were obtained in this regime.
With the primary ablation laser operated at a repetition rate of 20 Hz or more, the cell quickly becomes filled with metallic nano- and microparticles. The particles efficiently scatter the laser light and therefore can be visualized using an expanded cw laser beam and the video camera [21,22]. By moving the cw laser beam across the sample cell in both horizontal and vertical directions we have verified that the entire sample volume is filled with the particles. Their motion is affected very little by the expanding and collapsing gas bubbles. The particles slowly drift in random directions. Near the target, they seem to follow the flow of the normal-fluid component arising due to the counterflow excited by the inhomogeneous heating of the ablation target by the laser pulses. It is directed predominantly away from the target and is strongly inhomoge- neous and turbulent, with many large-scale eddies appearing and disappearing on the timescale of several milliseconds.
C. Laser-induced fluorescence spectrum
A typical spectrum of the laser-induced fluorescence recorded by the spectrograph with the CCD camera is shown in Fig.3. The emission is excited by the Ti:sapphire laser tuned into the resonance with the transition from the 4f106s2 5I8 ground state of Dy towards the state 4f95d6s2 5K7 at λ=458.9 nm (see Fig. 4). By selecting the delay time between the ablation laser pulse and the CCD exposure time, we have verified that this emission is produced by the Dy atoms solvated in superfluid He. The Dy atoms in the primary ablation plume and in the gas bubbles appearing in the focus of the secondary sputtering laser beam emit much narrower spectral lines and do not contribute to the spectrum in Fig.3.
In total we observe seven spectral lines originating from the electronic states of Dy lying below the laser-excited 4f95d6s2 5K7state. The corresponding transitions are shown in Fig.4by solid red arrows and are listed in TableI. Their line shapes are discussed in detail in [18]. The observed transitions are indicated in Fig. 4 by the red arrows. The emission spectrum is dominated by a strong line at 641 nm (labeled 5 in Fig.3) which originates from the state (5I8)(3P0), the lowest in the group of 4f106s6p(5I8)(3Pk) states (see Fig.4). In a free Dy atom this transition has wavelengthλfree=642.4 nm. We
Intensity (arb. u.)
Emission wavelength (nm)
560 580 600 620 640 660 680
x 20 x 1 1
2
3 4 5
6 7
FIG. 3. Laser-induced fluorescence spectrum. Excitation at λLas=458.9 nm. Numbers 1 to 7 mark the emission lines of Dy (see Fig.4).
also observe the emission from two other 4f106s6p(5I8)(3Pk) states (lines 1 and 4 in Fig. 3) and from two higher-lying 4f106s6p(5I7)(3Pk) states (lines 2 and 3 in Fig.3). All these emission lines are strongly broadened and blueshifted, which is typical for the valence electron transitions [15,23].
In the emission spectrum we also observe two transi- tions from states5H7 and5I8 belonging to the configuration 4f95d6s2 (6 and 7 in Fig. 3; λfree =657.9 and 683.5, re- spectively). These two inner-shell transitions are much less broadened and are shifted in the opposite direction.
D. Time-resolved fluorescence
Typical time-resolved fluorescence signals atλemiss=641 nm measured by the PMT are shown in Fig.5. Here, curve 1 is
0 5 10 15 20
E (103 cm-1)
5H7
5I8
5K7
5I8
(5I7)(3Pk) (5I8)(3Pk)
4f106s6p
4f106s2 4f95d6s2
642.4
625.9
554.7
5I7
458.9
657.9 683.5 601.1 616.8
25
1 4 5 2 3
6 7
8 8 9 J
8 7 J
FIG. 4. Electronic states and transitions of a Dy atom [24]. Only the states and transitions that are relevant for the present work are shown. The vertical blue arrow indicates the transition excited by the laser. Red arrows indicate the transitions observed in the fluorescence spectrum, numbered according to Fig.3(see also TableI). Transition wavelengths are given in nanometers.
P. MOROSHKIN AND K. KONO PHYSICAL REVIEW B101, 134520 (2020) TABLE I. Parameters of electronic transitions of Dy atoms ob-
served in the present experiment. The wavelengths of the free Dy atomλfree, spontaneous emission ratesAki, and statistical weights of the uppergkand lowergielectronic states are taken from [24].fikare the oscillator strengths from [39].Irel represent relative intensities observed in the present work in the emission spectrum. The last column shows the labels assigned to the transitions in Figs. 3 and4.
λfree Aki fik
Transition (nm) (s−1) ( 10−3) gi gk Irel Label (5I8)(3P2)-5I8 554.7 3.0×10⁵ 1.8 17 17 0.017 1 (5I7)(3P1)-5I7 601.1 5.9×10⁵ 10 15 15 0.007 2 (5I7)(3P1)-5I7 616.8 8.1×10⁵ 11 15 17 0.002 3 (5I8)(3P1)-5I8 625.9 8.9×10⁵ 5.4 17 19 0.113 4 (5I8)(3P0)-5I8 642.2 1 17 17 1.00 5
5K7-5I8 458.9 1.37×10⁷ 40 17 15
5H7-5I8 657.9 7.7×10⁵ 4.7 17 15 0.002 6
5I8-5I8 683.5 17 17 0.052 7
obtained with the cw excitation laser blocked and represents the emission from the laser-induced plasma in the focus of the secondary pulsed laser beam. The pulse width is limited by the detector bandwidth. Curve 2 shows the emission excited by the cw Ti:sapphire laser tuned to λLas=458.9 nm, in resonance with the Dy absorption line.
Following the secondary sputtering laser pulse, the atomic fluorescence excited by the cw laser increases over≈5 ms, reaches a maximum, and then decreases exponentially with decay timeτ ≈90 ms. The rise time is similar to the typical lifetime of large gas bubbles appearing in the focus of the pulsed laser at a large laser power. The increase in the atomic fluorescence yield thus can be associated with the collapse of the gas bubble and to the increase in the number of Dy atoms solvated in liquid He. The decay of the fluorescence yield at larger delay times may be attributed to the diffusion
Time (ms)
0 50 100 150
Fluorescence yield (arb. u.)
0 1.0 2.0
1.5
0.5
1 2
3
FIG. 5. Time-resolved emission intensity at λemiss=641 nm.
T =1.35 K, secondary sputtering laser: λ=532 nm, WLas=4.5 mJ, pulses at t=0 and 100 ms. Curve 1 (blue), cw excitation laser blocked; curve 2 (red), cw excitation at λLas=458.9 nm, PLas=9.0 mW; curve 3 (black dashed), exponential fit to the data att=20–100 and 120–190 ms.
(a)
(b)
(c)
(d)
(e)
(f)
(g)
(h)
Z (mm)
Y (mm)
Y (mm)
0 0.5 -0.5
0 1 2 3 4
FIG. 6. (a)–(d) Images of laser-induced fluorescence made with the CCD camera. (e)–(h) Corresponding transversal profiles of the atomic cloud. Camera exposure time in (a) 10 ms and in (b)–(d) 100 ms. Delay time with respect to the secondary laser pulse: (a) and (e) τ =0, (b) and (f)τ=5 ms, (c) and (g)τ=100 ms, and (d) and (h) τ =200 ms.T =2.07 K; secondary laser pulse energyWLas=3 mJ, cw laser powerPLas=22 mW.
of the Dy atoms from the excitation zone illuminated by the cw laser beam or to the coalescence of the atoms into dimer molecules and clusters. However, our estimates of the diffusion coefficient (Sec. III A) and of the atomic density (Sec. III B) rule out both these interpretations. Alternatively, the observed dynamics can be a result of optical pumping that transfers the Dy atoms to a nonabsorbing metastable state. The latter interpretation is discussed in detail in Sec.III C.
E. Imaging of the atomic fluorescence
In Figs. 6(b)–6(d) we show images of the atomic Dy fluorescence excited by the cw Ti:sapphire laser at 458.9 nm, PLas=20 mW, T =2.0 K. The secondary sputtering laser (λ=532 nm) is operated at a repetition rate of 2 Hz and a pulse energy of 3.0 mJ. The images are taken by the CCD camera with the exposure time of 100 ms delayed with respect to the laser pulse by τd =5, 100, and 200 ms. The fluorescence is produced along the track of the secondary pulsed laser beam with a diameter (FWHM) equal to 0.3 mm.
Note that the diameter of the cw laser beam at the center of sample volume is≈4 mm.
The diameter of the track does not change with the in- creased delay time. In Figs.6(f)–6(h)we plot the transversal distribution of the light intensity across the track binned over a length of 2 mm (100 pixels). The same track diameter was also obtained with a camera exposure time of 10 ms, overlapping with the laser pulse [Figs.6(a)and6(e)]. No noticeable spread of the atomic cloud due to the diffusion occurs on a time interval of 300 ms. The observed decay of the laser-induced fluorescence (see Fig.5) thus does not result from the spread of the atomic cloud.
134520-4
t = 0
0.2 s
0.4 s
0.6 s
0.8 s
1.0 s
FIG. 7. Selected frames from a video recording of atomic fluo- rescence made by the CMOS camera. Exposure time of each frame is 50 ms; image size is 12×4 mm.T =1.4 K, secondary laser pulse energyWLas=7 mJ, repetition rate is 10 Hz, and cw laser power PLas=70 mW.
The images of the atomic cloud shown in Fig.6represent single exposures, each synchronized to the nearest preceding secondary sputtering laser pulse. The whole sequence is taken within a time interval of several minutes, with a number of laser pulses fired between the successive images. Because of relatively quiet conditions (low laser pulse energy), the shape of the cloud does not change on this timescale. Images obtained by the accumulation of many exposures demonstrate the same profile of the track. However, the brightness of the atomic fluorescence along the track is not always uniform, as can be seen in Figs.6(a)–6(d). The effect becomes more pronounced at a higher power and repetition rate of the pulsed laser.
The dynamics of the atomic cloud is relatively slow and can be observed in the video recordings made by the CMOS camera. Selected frames from a typical video recording made atWLas=7 mJ and a repetition rate of 10 Hz are shown in Fig.7. The cw laser power is also increased to 70 mW. The delay time is indicated in each frame. Each exposure overlaps with one secondary laser pulse; therefore, no decay of the emission brightness can be seen. The shape of the emitting atomic cloud does not follow exactly the straight path of the secondary laser beam. One can also see a pronounced inhomogeneity of the emission intensity within the atomic cloud.
The shape of the cloud and the structure of the bright spots evolve relatively slowly, on a timescale of seconds. Both are only weakly affected by every successive laser pulse. This would be impossible if the atoms completely disappeared during the time interval between the two pulses and each successive pulse created an entirely new atomic cloud. On the other hand, the observations are consistent with the follow- ing scenario. The atoms become invisible because they stop absorbing the cw laser light at λ=458.9 nm and emit no fluorescence. At the same time, they move very slowly and remain within the excitation zone until the arrival of the next secondary laser pulse. The interaction with the intense laser pulse atλ=532 or 355 nm transfers the atoms back into the absorbing state and thus makes them visible again.
We attribute the slow motion of the atomic cloud to the effect of the macroscopic liquid-helium flow. The atoms
experience a drag force only from the normal-fluid compo- nent of superfluid He that possesses a finite viscosity. In the temperature range of our experiments, the normal-fluid fraction varies between 5% and 75% [25]. The motion of the Dy atomic cloud in Fig. 7 thus visualizes the flow of the normal-fluid component driven by the local heating by the intense laser beams (thermal counterflow) and/or by the gas bubble dynamics.
It is expected that impurity atoms in superfluid He can be trapped by quantized vortices, similar to the trapping of micron-sized tracer particles [1,2], free electrons (electron bubbles), [26,27] and positive ions [27]. However, in the im- ages obtained in the present experiments we could not identify any objects resembling vortex lines decorated by trapped Dy atoms. The sensitivity of the camera and the resolution of the imaging system in the present experiment are not sufficient for resolving the individual Dy atoms.
III. ANALYSIS
As can be seen in Figs.5 and6, the atomic fluorescence observed in the experiment decays on a timescale of 50–100 ms, without the spreading of the atomic cloud. Below we discuss possible mechanisms leading to the loss of the Dy atoms: (i) diffusion of atoms out of the observation zone, (ii) their coalescence into dimer molecules and larger clusters and nanoparticles, and (iii) optical pumping into a long-lived nonabsorbing electronic state(s).
A. Diffusion of Dy atoms in liquid helium
Dy atoms produced along the track of the secondary sput- tering laser beam are expected to spread out because of the diffusion. The excitation zone is defined by the cw Ti:sapphire laser beam. In the imaging study it had a diameter of≈4 mm, i.e., much larger than that of the sputtering laser. One therefore could expect to see the spreading of the atomic cloud until it fills the cross section of the cw laser beam.
The rate of diffusion of impurity atoms in superfluid he- lium has not been measured. The diffusion coefficient D is expected to be of the same order of magnitude as that of He∗2, which was estimated in [28]. In the temperature range of our experiments, D(H e∗2)∼10−4–10−3 cm2/s [28]. Similar values of the diffusion coefficient have been obtained for spin- polarized 3He impurity atoms in dilute 4He -3He mixtures [29,30]. Residence times of various metal impurity atoms reported in spectroscopy experiments range from a few tens of milliseconds [31] to 500 ms [32,33] and even several seconds [34]. It was also suggested [34] that the atoms are removed from the observation zone not by diffusion, but rather by a convection or a counterflow arising due to the inhomogeneous heating by the ablation laser pulses.
∂Nat
∂t =1 r
∂
∂r
rD∂Nat
∂r
. (1)
In order to model the diffusion of Dy atoms created within the approximately cylindrical volume illuminated by the pulsed laser beam, we find a solution of the diffusion equa- tion (1) following the procedure described in [35]. The initial distribution of the atomsNat(r,t =0) is modeled by a radial
P. MOROSHKIN AND K. KONO PHYSICAL REVIEW B101, 134520 (2020)
Time (s)
0 0.2 0.4 0.6 0.8 1.0
0 0.2 0.4 0.6 0.8 1.0
Nat(r = 0)/N0 FWHM (mm)
0.2 0.4 0.6 0.8 1.0
0 1
2
3
4 5 6
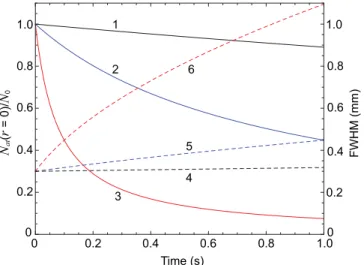
FIG. 8. Results of the calculations of the diffusion of impurity atoms in liquid He. Solid curves (left axis), normalized atomic density on the laser beam axis; dashed curves (right axis), FWHM diameter of the atomic cloud. Curves 1 and 4, D=10−5 cm2/s;
curves 2, 5,D=10−4cm2/s; curves 3, 6,D=10−3cm2/s.
Gaussian function with a FWHM of 0.3 mm, corresponding to Fig.6(e):
Nat(r,t =0)=N0exp
−r2 w2
. (2)
The time-dependent concentration of the impurity atoms Nat(r,t) is found as
Nat(r,t)= 2 a2
n
k=1
Ckexp
−Dαk2t
J0(αkr), (3) with the coefficients
Ck= 1 J1(αka)2
a
0
Nat(r,t =0)J0(αkr)rdr. (4) Here, J0(x) and J1(x) are Bessel functions, a is the radius of the sample volume, and αk are the roots of the equation J0(αka)=0. It is assumed that the atoms reachingr=astick to the wall and disappear. In the geometry of our experiment (aw), the terms up ton=130 must be included in the summation in Eq. (3).
In Fig. 8 we show the calculated time dependence of the atomic density at the axis of the laser beam, Nat(r= 0,t)/N0, and of the FWHM diameter of the atomic cloud for different values ofD. Our experimental observations are consistent with the magnitude of the diffusion coefficientD 10−4cm2/s. No significant spreading of the atomic cloud can be seen within the time interval of 200–300 ms following the sputtering laser pulse (see Fig.6). This is also consistent with the data of [28,32–34]. The dominating loss mechanism is not associated with the diffusion.
B. Coalescence of Dy atoms into molecules and nanoparticles Dy atoms solvated in superfluid helium may form dimer molecules and larger clusters. They may also attach them- selves to nanoparticles that have survived the secondary laser sputtering. Both processes will lead to the decrease of the
density of solvated atoms and to a depletion of the laser- induced fluorescence.
The coalescence of two atoms or an atom and a larger par- ticle is possible only upon a collision at a very close distance, and therefore, the rates of both reactions are controlled by the diffusion. For a diatomic recombination, the distance between the two atoms should be approximately equal to the diameter of the atomic bubble, 2Rb≈1 nm [18]. The atomic density Natobeys the following equation [36]:
dNat
dt = −8πRbDNat2. (5) The solution is
Nat(t)= N0
t/τat+1. (6) The decay of Nat(t) is nonexponential, with a characteristic decay time depending on the initial atomic density:
τat = 1
8πRbDN0. (7)
In order to estimate the absolute value of N0 achieved in the experiment, we use the expression for the absorption rate per atom [37]:
Wa= λ3Aik
8πhνc gk
gi
ILas. (8)
Here,Aikis the Einstein coefficient for spontaneous emission (see TableI),giandgkare the statistical weights of the ground and excited states, respectively,cis the speed of light, andh is the Planck constant. It is assumed that the cw laser with the intensityILas is tuned exactly at a center of the excitation spectrum that has a Lorentzian line shape with a FWHM width ν. At a low laser power, the fluorescence yield is given by IF =WaNat. By comparing the results of the calculation with the experimentally measured fluorescence yield corrected for the collection efficiency, we can estimate the atomic density:
N0∼108cm−3.
The diatomic coalescence time τat can thus be calculated using Eq. (7), assuming the value of the diffusion coefficient D10−4 cm2/s obtained in Sec. III A: τat 10 s. It leads to a decay of the atomic density that is even slower than that resulting from the spreading of the atomic cloud.
The coalescence of atoms with larger particles is described by a rate equation similar to Eq. (5):
dNat
dt = −4π(Rc+Rb)(D+Dc)NcNat, (9) where Nc is a number density of all particles larger than a single atom,Rcis the particle radius, andDcis their diffusion coefficient. Since Rc>Rb, it is expected that Dc<D. The solution is
Nat(t)=N0exp
−t τc
, (10)
τc= 1
4π(Rc+Rb)(D+Dc)Nc 1
4πRcDNc. (11) The experimentally observed decay time of the atomic density (Fig. 5) can be attributed to the attachment of atoms to nanoparticles only if the productNcRcexceeds 108m−2. Our 134520-6
estimates [21] suggest that metallic nanoparticles with a diam- eter of about 100 nm or larger scatter a sufficient intensity of the laser light to be detected by our video camera. The number density of such particles can be estimated from our video recordings. Their contribution is totally negligible in compar- ison with the diatomic recombination. Smaller nanoparticles and atomic clusters (1 nm<Rc<50 nm) remain invisible.
They may produce the observed effect, but only if their number density is extremely high: 109–1011cm−3.
C. Saturation and optical pumping
The slow decay of atomic fluorescence following the sput- tering laser pulse observed in the experiment (Fig. 5) may result from the optical pumping of Dy atoms into a long-lived electronic state that has no allowed transition to the ground state. The candidate metastable state can be easily identified in Fig.4as the 4f106s2 5I7state that has an energy of 4134 cm−1 above the5I8ground state. It is populated by the spontaneous emission at 601.1 and 616.8 nm (emission lines 2 and 3 in Fig.3 and Table I). At present, nothing is known about its lifetime in a superfluid helium environment.
The rate at which the atomic population is pumped into the metastable state is determined by the intensity of the cw excitation laserILas and by the branching ratio between the emission lines terminating at the metastable and at the ground state. Below, we develop a rate-equation model that uses the results of our earlier work [18], where we have investigated the dependence of the fluorescence yield on the excitation laser power. In that experiment, a mean fluorescence intensity at each emission line was measured, averaged over a time much longer than the dynamics reported here in Figs. 5–
7. As the power of the resonant cw laser is increased, the fluorescence yieldIF saturates according to
IF ∝ ILas
1+ILas/ISexp. (12) Here, ISexp is the saturation intensity that is determined by fitting the experimental data. The same dependence was ob- tained by measuring the laser-induced fluorescence at dif- ferent emission channels. The resulting saturation intensity for the excitation at the zero-phonon line (ZPL) of the
5I8-5K7 transition increases with the temperature. At T = 1.4 K, ISexp=17±5 mW/cm2, and at T =2.05 K, ISexp= 100±20 mW/cm2.
Assuming a homogeneously broadened two-level atomic transition, the saturation intensity can be calculated [38] as
IS(2)=4πchν λ3
gi
gk
, (13)
which corresponds to the conditionWa=Aik/2. Equation (13) can explain partially the observed increase of the saturation intensity with the temperature since the spectral width of the ZPL is also increasing fromν=5.5 GHz atT =1.4 K to ν=11.5 GHz at T =2.1 K [19]. However, the absolute value of the saturation intensity calculated using the mea- sured value of ν [19] is IS(2)≈10 W/cm2, which is 600 times larger than the experimentally measured valueISexp. This discrepancy is also attributed to the optical pumping of the atomic population into the metastable state.
FIG. 9. (a) A simplified six-level system used to calculate the steady-state atomic populations. Blue, red, and black solid arrows represent optical excitation, spontaneous emission, and radiationless transitions, respectively; the dashed blue arrow indicates stimulated emission. (b) Calculated saturation intensityIS as a function of the radiationless rateγ24. Curve 1:γ25=0, states 5 and 6 not populated;
curves 2, 3, and 4:γ25=0,γ61=1000, 100, and 10 s−1, respectively.
We neglect all minor decay channels and consider the simplified six-level system shown in Fig. 9 (a). It includes the laser-excited transition at 458.9 nm, two transitions that are most prominent in the experimental emission spectrum at 642 and 626 nm, and the transition at 601 nm. The emission at 601 nm is rather weak. It has to be included since this transition leads to the population transfer to the5I7state that is metastable and may become a trap for the excited atomic population (see Fig. 4). The steady-state populations of the six atomic statesN1toN6can be found by solving the system of rate equations:
N1γp=N2(A21+γst)+N3A31+N4A41+N6γ61, (14) N2γ23 =N3A31, (15) N2γ24 =N4A41, (16) N2γ25 =N5A56, (17) N6γ61 =N5A56, (18) N1+N2+N3+N4+N5+N6=1. (19) Here,A21,A31,A41, andA56 represent the spontaneous emis- sion rates of states 2, 3, 4, and 5, respectively.A21,A31, and A56 can be found in [24] (see TableI). In order to determine A41, we use measured the values of the relative oscillator strengths fikof Dy transitions reported in [39] (see TableI).
Since fik ∝Akigk/gi, the absolute value ofA41is calculated as follows:
A41= f14
f12
g2
g4
A21, (20)
with the resultA41≈ 1.7×10⁵s−1.γpandγstare the optical pumping and stimulated emission rates for state 2 [38]:
γp= A21λ3 8πchν
g2
g1
ILas, (21) γst =γp
g1
g2. (22)
P. MOROSHKIN AND K. KONO PHYSICAL REVIEW B101, 134520 (2020) The ratesγ23,γ24,γ25, andγ61, corresponding to the radia-
tionless transitions (see Fig.9), are unknown and have to be found together with the state populations. It is expected that γ61 is much smaller than all other radiationless rates in the system due to the large energy separation of the two states and the absence of any intermediate states.
The populations of excited states 3, 4, and 5 are propor- tional to the experimentally observed intensities of the laser- induced fluorescence at the transitions 3→1, 4→1, and 5→6 at 626, 642, and 601 nm, respectively. We therefore can write two additional equations:
N3A31
N4A41
=IF(626)
IF(642) ≡α≈0.113, (23) N5A56
N4A41
=IF(601)
IF(642) ≡β≈0.007. (24) The system of Eqs. (14)–(19), (23), and (24) can be solved to express all populations via the unknown radiationless rates γ24 andγ61 and the optical pumping rate that is proportional to the laser intensity. The solution forN3,N4, andN5has the form
Nk∝ γp
1+γpC(γ24) ∝ ILas
1+ILas/IS(6)(γ24). (25) Since N3A31 ∝IF(626), N4A41 ∝IF(642), and N5A56∝ IF(601), this solution is equivalent to Eq. (12).
In Fig.9(b)we compare the calculated saturation intensity for the six-level systemIS(6)(γ24, γ61) with the experimental valueISexp. First, we setγ25 =0 and thus neglect the channel that leads to the population of the metastable state 6. The resulting IS(4)(γ24) is plotted in Fig. 9 as curve 1. Although the calculated value of IS(4) decreases with increasing the radiationless rateγ24, it remains significantly larger than the experimentally measured ISexp. We therefore conclude that the four-level system ignoring the population transfer to the metastable state does not describe our experiment adequately.
Allowing for the finite rates of the radiationless transitions 2→5 and 6→1 significantly reduces the saturation inten- sity and makes it compatible with the experimental obser- vations. The ratesγ23 andγ25 can be expressed viaγ24 and experimental relative line intensities:γ23=αγ24,γ25 =βγ24. The decay rate of the metastable state γ61 remains a free parameter. In Fig.9we plot the computedIS(6)(γ24) forγ61 = 10, 100, and 1000 s−1. Onlyγ61100 s−1is compatible with the experimentally measured value ofIS.
In principle, the model developed above can be used to calculate the dynamics of the fluorescence yield that is measured in the experiment. However, the number of free parameters remains too large. Besides that, the model is based on the assumption that the dependence of the fluorescence yield on the laser power (saturation intensity) is measured in a steady state, whenIF is not varying in time. In the experiment [18], the secondary sputtering laser pulses were fired at a rate q=10 Hz; therefore, the conditionqγ61was not fulfilled.
The time interval between the pulses was too short to reach the steady state.
The model nevertheless demonstrates that the fluorescence yield excited by the cw laser is expected to decrease on a timescale determined mostly byγ61, the rate of the slowest
FIG. 10. Energy levels and allowed transitions of Dy [24]. Ver- tical red and blue arrows indicate the transitions suitable for the repumping from the metastable5I7state to the ground state.
radiationless transition in the system. This rate has the same order of magnitude as the decay rate observed in the experi- ment after each secondary sputtering laser pulse (Fig.5). We therefore attribute the observed decay of laser-induced fluo- rescence to the optical pumping of Dy atoms to the metastable 4f106s2 5I7 state that does not absorb the laser radiation at λ=458.9 nm.
D. Possible repumping schemes
As discussed in Sec.II E, our data suggest that the pulses of the Nd:YAG laser, in addition to sputtering the nanoparticles, also remove a certain number of atoms from the metastable state and thus enhance the fluorescence yield. Note that the 4f106s2 5I7 state has a large number of strong transitions towards the higher-lying excited states, many of which are strongly broadened and shifted by the interaction with liquid He. Some of these transitions are shown in Fig. 10. For the sputtering laser atλ=532 nm, the repumping may proceed via the transition at λfree =562.7 nm (see Fig.10). For the pulsed laser at λ=355 nm, the repumping probably occurs via another known transition of Dy atλfree=357.1 nm [24].
For a more accurate measurements of the atomic diffusion on a longer timescale and for visualization of the helium flow, it is essential to increase the observation time. This can be achieved by a more efficient repumping scheme using a cw or pulsed laser tuned to the wavelength of one of the transitions originating from the 5I7 state. Of particular interest are the transitions towards the excited states that can also decay to the ground state via spontaneous emission at another allowed transition. In Fig. 10 we identify three possible repumping schemes: (1) intermediate state 7K7, excitation at 737.6 nm (Aki =105s−1) and spontaneous emission at 565.2 nm (Aki= 4×10⁵ s−1); (2) intermediate state (5I7)(3P2), excitation at 562.7 nm (Aki=2×10⁵ s−1) and spontaneous emission at 456.5 nm (Aki=7×10⁵ s−1); and (3) intermediate state (5I6)(3P2), excitation at 479.1 nm (Aki=1.2×10⁶ s−1) and spontaneous emission at 401.4 nm (Aki=2.9×10⁶s−1) or at 404.6 nm (Aki=1.9×10⁸s−1).
134520-8
Scheme 1 uses spectrally narrow inner-shell transitions.
However, both transitions involved in this scheme are rather weak, as indicated by their respectiveAki∼105s−1. On the other hand, scheme 3 involves much stronger transitions.
Although in this case, the excitation spectrum is expected to be strongly broadened. Moreover, this scheme relies on a radiationless quenching of the laser excited state towards closely lying (5I6)(3P2) or (5I8)(1P1) states that possess espe- cially strong probability of a spontaneous decay towards the ground state.
IV. CONCLUSIONS
Impurity atoms injected into superfluid He and excited by resonant laser radiation can be used as microscopic tracers of the liquid He flow. In particular, atoms of rare-earth elements with their spectrally narrow inner-shell electronic transitions already at a moderate excitation laser power emit a suffi- ciently bright laser-induced fluorescence that can be used for
imaging. In the case of dysprosium, investigated in the present work, the observation time is strongly limited by the effect of the optical pumping into a metastable 5I7 state and the associated depletion of the ground state. This finding allows us to explain the previously observed saturation of the Dy absorption line by a relatively weak resonant laser radiation.
Our observations set an upper limit to the value of the dif- fusion coefficient of neutral impurity atoms in superfluid He that is compatible with earlier estimates. We propose to use an additional cw or pulsed laser to optically pump the atoms trapped in the metastable state back into the ground state in order to increase the fluorescence yield and thus achieve a higher sensitivity.
ACKNOWLEDGMENTS
This work was supported by JSPS KAKENHI Grants No.
JP24000007 and No. JP17H01145. K.K. has obtained support from MOST, Taiwan (Grant No. 109-2112-M-009-002).
[1] G. P. Bewley, D. P. Lathrop, and K. R. Sreenivasan, Nature (London)441,588(2006).
[2] M. S. Paoletti, M. E. Fisher, K. R. Sreenivasan, and D. P.
Lathrop,Phys. Rev. Lett.101,154501(2008).
[3] T. V. Chagovets and S. W. Van Sciver,Phys. Fluids27,045111 (2015).
[4] M. LaMantia and L. Skrbek,Phys. Rev. B90,014519(2014).
[5] P. Švanˇcara, P. Hrubcová, M. Rotter, and M. LaMantia,Phys.
Rev. Fluids3,114701(2018).
[6] W. Kubo and Y. Tsuji,J. Low Temp. Phys.187,611(2017).
[7] B. Mastracci and W. Guo, Phys. Rev. Fluids 3, 063304 (2018).
[8] B. Mastracci and W. Guo,Phys. Rev. Fluids4,023301(2019).
[9] H. Bauer, M. Beau, A. Bernhardt, B. Friedl, and H. J. Reyher, Phys. Lett. A137,217(1989).
[10] B. Tabbert, M. Beau, M. Foerste, H. Günther, C. Hönninger, H.
Hust, K. Layer, G. zu Putlitz, and T. Schumacher,Z. Phys. B 98,399(1995).
[11] W. Guo, J. D. Wright, S. B. Cahn, J. A. Nikkel, and D. N.
McKinsey,Phys. Rev. Lett.102,235301(2009).
[12] W. Guo, S. B. Cahn, J. A. Nikkel, W. F. Vinen, and D. N.
McKinsey,Phys. Rev. Lett.105,045301(2010).
[13] A. Marakov, J. Gao, W. Guo, S. W. Van Sciver, G. G. Ihas, D. N. McKinsey, and W. F. Vinen, Phys. Rev. B91, 094503 (2015).
[14] J. Gao, A. Marakov, W. Guo, B. T. Pawlowski, S. W. Van Sciver, G. G. Ihas, D. N. McKinsey, and W. F. Vinen,Rev. Sci. Instrum.
86,093904(2015).
[15] P. Moroshkin, A. Hofer, and A. Weis,Phys. Rep.469,1(2008).
[16] K. Ishikawa, A. Hatakeyama, K. Gosyono-o, S. Wada, Y.
Takahashi, and T. Yabuzaki,Phys. Rev. B56,780(1997).
[17] Q. Hui and M. Takami,J. Low Temp. Phys.119,393(2000).
[18] P. Moroshkin, A. Borel, and K. Kono,Phys. Rev. B97,094504 (2018).
[19] P. Moroshkin and K. Kono,Phys. Rev. B99,104512(2019).
[20] V. Fernandez, A. Garcia, K. Vossoughian, E. Popov, S. Garrett, and J. Eloranta,J. Phys. Chem. A119,10882(2015).
[21] P. Moroshkin, R. Batulin, P. Leiderer, and K. Kono, Phys.
Chem. Chem. Phys.18,26444(2016).
[22] P. Moroshkin, P. Leiderer, and K. Kono, Phys. Fluids 29, 047106(2017).
[23] P. Moroshkin, V. Lebedev, and A. Weis,Europhys. Lett. 96, 26002(2011).
[24] A. Kramida, Yu. Ralchenko, J. Reader, and NIST ASD Team, NIST Atomic Spectra Database version 5.3, National Institute of Standards and Technology, Gaithersburg, MD,http://physics.
nist.gov/asd.
[25] J. Wilks,The Properties of Liquid and Solid Helium(Clarendon, Oxford, 1967).
[26] G. A. Williams and R. E. Packard, Phys. Rev. Lett.33, 280 (1974).
[27] R. J. Donnelly,Quantized Vortices in Helium II(Cambridge University Press, Cambridge, 1991).
[28] D. N. McKinsey, W. H. Lippincott, J. A. Nikkel, and W. G.
Rellergert,Phys. Rev. Lett.95,111101(2005).
[29] K. Fukuda, Y. Hirayoshi, and A. Hirai,Phys. Lett. A47,377 (1974).
[30] N. Piegay, G. Tastevin, and P. J. Nacher,J. Low Temp. Phys.
121,785(2000).
[31] A. Fujisaki, K. Sano, T. Kinoshita, Y. Takahashi, and T.
Yabuzaki,Phys. Rev. Lett.71,1039(1993).
[32] B. Tabbert, M. Beau, H. Günther, W. Häußler, C. Hönninger, K. Meyer, B. Plagemann, and G. zu Putlitz,Z. Phys. B97,425 (1995).
[33] T. Furukawa, Y. Matsuo, A. Hatakeyama, Y. Fukuyama, T.
Kobayashi, H. Izumi, and T. Shimoda, Phys. Rev. Lett. 96, 095301(2006).
[34] M. Arndt, S. I. Kanorskii, A. Weis, and T. W. Hänsch,Phys.
Lett. A174,298(1993).
[35] J. Crank, The Mathematics of Diffusion(Clarendon, Oxford, 1975).
[36] G. H. Duffey,Modern Physical Chemistry(Kluwer Academic, New York, 2000).
[37] I. I. Sobelman, Atomic Spectra and Radiative Transitions (Springer, Berlin, Heidelberg, 1979).
[38] W. Demtröder,Laser Spectroscopy(Springer, Berlin, 2008).
[39] V. A. Komarovskii, Opt. Spectrosc.71, 322 (1991) [Opt. Spek- trosk.71, 559 (1991)].


![FIG. 10. Energy levels and allowed transitions of Dy [24]. Ver- Ver-tical red and blue arrows indicate the transitions suitable for the repumping from the metastable 5 I 7 state to the ground state.](https://thumb-ap.123doks.com/thumbv2/123deta/6947193.2271126/9.884.455.819.95.338/energy-allowed-transitions-indicate-transitions-suitable-repumping-metastable.webp)
