DOI: http://dx.doi.org/10.14246/irspsd.3.3_4
Copyright@SPSD Press from 2010, SPSD Press, Kanazawa
Evacuation Simulation and Evaluation of Different Scenarios based on Traffic Grid Model and High Performance
Computing
Miaoyi Li 1, Jing Deng 2*, Lun Liu 3 , Ying Long 4 and Zhenjiang Shen1
1 School of Environmental Design, Kanazawa University, Japan
2 Institute of Land Science and Technology, China University of Geosciences 3 Department of Land Economy University of Cambridge
4 Beijing Municipal Institute of City Planning and Design
* Corresponding Author, Email: [email protected] Received 24 June, 2014; Accepted 11 November, 2014
Key words: Evacuation Simulation; Traffic Model; Agent Based Model; High Performance Computing(HPC)
Abstract: This paper describes the design and implementation of an evacuation simulation model developed based on the Traffic Grid Model in NetLogo. In this model, different scenarios were tested in order to find out the best strategy within specific environments. The model is flexible and includes many parameters to adjust to environment conditions and agent rules. These parameters can be modified to study which driving factors contribute most to drivers’ evacuation performance. This research also focuses on the method of results analysis and traffic performance evaluation for different combinations of two model parameters. In each experiment, we analysed metrics such as evacuation time and average car speed for each strategy under different population distribution patterns. The results showed that this model could reveal an effective evacuation strategy for realistic scenarios.
1. INTRODUCTION
Evacuation is an important issue in emergency situations; effective egress routes can decrease evacuation time, protect people’s safety and minimize loss. There has been much research concentrated on evacuation planning.
Evaluation of traffic operations during an evacuation is critical for assessing the effectiveness of a plan, including evacuation time and traffic congestion (Jha, Moore, et al., 2004). However, the evaluation requires an estimation of evacuation results for different plans, which can be simulated through traffic models. If the evacuation strategy for a specific environment can be simulated prior, or the congestion could be predicted, it will assist in getting better solutions for realistic problems.
Simulation is a very effective way of finding solutions for complex problems (Champion, et al., 1999). In the simulation models, egress routes and evacuation effectiveness can be implemented and evaluated rather than using empirical tests of their claims (Kuligowski and Erica, 2003).
Nowadays, a large amount of literature focuses on models and methods for evacuation simulation, and there are many types of classification from different perspectives based on different research fields. According to different methods of representing reality, these models can be classed as continuous or discrete. Most of the continuous models use equilibrium
4
equations to describe object change; while discrete simulations treat reality as discrete events or discrete time states, so states or events happen in each time interval (Champion, et al., 1999; Algers, et al., 1997; Schulze and Fliess, 1997). According to mainstream realization methods, the simulation models include flow based, cellular automata, agent-based, multi-agent based and activity-based models (Santos and Aguirre, 2004), with each model having its own merits and disadvantages. Depending on how detailed the information is in the model, models can be simulated on microscopic, mesoscopic or macroscopic levels (Sheffi, Mahmassani, et al., 1982) and the choice should always depend on the requirements for accuracy, calculation speed or study region scale. According to whether the experiment results need to be reproducible, there are stochastic or deterministic models corresponding to their different strategies for simulating randomness (Champion, et al., 1999).
The conventional models use static analysis on the macro simulation level and are quite limited for a real time simulation. With the development of computer technology, many complex models can be realized in a more vivid way using computers. Nowadays, individual based modeling and agent based modeling are widely used for micro modeling. Interaction rules and behavior patterns are studied in this kind of model, which enables us to simulate different types of agents which are driven by different behavior patterns. When every individual is given some simple interaction rules, the behavior patterns which were not programmed into the agents will emerge when many agents are simulated as a group; which is known as emergent phenomenon (Ferber, 1999). Therefore, agent based modeling is suitable for simulating complex systems and studying complexity. In this research, we chose agent based modeling to simulate an evacuation model because it provides flexibility to various parameters of the agents and environment easily, from which the user can gain results in real-time and test different parameter combinations.
We built this agent based model based on a software platform according to agent based modeling practice, which includes seven stages:
brainstorming, theory, hypothesis, flowchart, code, analysis and publishing (The Institute for Modeling Complexity, 2004). This paper introduces a modeling process following the model design and development phase at the software level. After model realization, the method to evaluate the experiments’ results is illustrated.
2. MODEL DESIGN
Model design is the first important stage for simulation, which includes listing critical components of the model, representing main objects using some parameters or properties, and describing processes and interactions abstracted from real world. The model is described according to the Overview, Design concepts, and Details (ODD) protocol, which is a standard used for the description of agent based models (Volker, Uta, et al., 2010).
2.1 Model components
This model contains three important components, the individuals, environment and process. Individuals correspond to the agents that are moving and reacting in the model, they have their specific behavior and
movement rules. The environment provides the basic platform for individuals’ activities; it also specifies the boundary and restrictions. Process is another important component in the model; the process needs to be kept simple and yet close to reality. Processes can be designed quite differently for different study objectives.
2.1.1Individuals
Two kinds of agents are included in this model. One is a super agent, an abstract agent, who takes charge of the work assignment and process; the other one is a normal agent, the car, which represents the evacuation entities.
They will move forwards according to their speed, which is determined by the traffic situation and restricted by cars in front.
2.1.2Environment
Environment in this model includes blocks and roads. The basic spatial component unit for the environment is cells. Different blocks may have different population sizes, cars will park in blocks and run on roads. While the simulation is running, each road cell will be either empty or occupied by some vehicles.
2.1.3Process and scheduling
This model uses discrete time intervals to simulate events changing in the real world; the basic temporal unit is a tick. In the beginning, the whole model will begin scheduling. During the process, each agent will follow its rules to move and change. The states of all the objects will be checked and updated after each tick.
2.2 Unified Modeling Language(UML) diagrams
2.2.1Class diagram
An object oriented method is used to design the objects and procedures in this model. UML standards are implied in describing the model. The main classes in the model are shown as follows, the attributes for all the agents are quite straightforward. Cars are moving agents in the model, there are three different states for cars, one is parking in blocks and waiting for evacuation, one is waiting on the roads and blocked in a traffic jam, the other is moving on roads. Speed and wait-time can describe the features of cars during the evacuation process. Each car is able to turn at intersections, accelerate and decelerate, and when it arrives at its destination, it will disappear from the environment. Some other functions are designed to check the states of the cars, whether they are stopped or have reached destinations. Super agent is an abstract class, which will take charge of the arrangement of work to update the environment for agents. It can allocate cars on the road, and change the traffic lights. Cars belong to different blocks, which have block IDs and population information. Roads have limitations on car speed, intersections are the overlay cells of different roads, and the traffic lights are set near the intersections. Destinations are set on intersections, so some of the intersections are assigned as destinations. The relationships between different classes are also shown in Figure 1, below. Blocks and roads are composed of many cells; many cars can park in each block.
Figure 1. Class diagram of the model
2.2.2Sequence diagram
Sequence diagram is a kind of UML diagram that shows the flow of procedures which are executed in the model. It also shows how different agents interact with each other. The sequence will repeat during the simulation, until the model reaches its stop condition, for example, all the cars have already evacuated. In the “setup()” procedure, the environment will be set up, the cars will be allocated on blocks’ roads according to which block they belong to and the road capacity. During the “go()” procedure, cars will move according to their action rules and their performance will be recorded. Then cars’ states will be checked after their movement, if they reach the destinations they will disappear from the environment. See Figure 2, below.
Figure 2. Sequence diagram of the model
2.3 Model platform
There are many types of platforms on which agent based simulations can be realized. There are integrated development environments (IDEs), toolkits and libraries. Models can be built, coded and run on these platforms, which usually utilize their own graphical interface and use abstract languages for model builders to interact with the model. Some popular toolkits and software such as Swarm, Repast, MASON and Cybele are widely used, they are all free open source and easy to use. It is important to compare and choose a platform after considering the time cost for learning and issues that may be run into during modeling. Existing research can be referred to for choosing models (RAILSBACK, et al., 2006).
We used NetLogo as the modeling platform. It is written in Java and free for use. It provides a friendly user interface to enable users to build any number of agents and change environmental setup of the world. This software is widely used by students and researchers to explore agent based modeling for its low programming requirements. It has a massive model library, which contains many model examples covering different disciplinary and research regions. Users can modify the models for their own research objectives. NetLogo includes some existing traffic models and the model of this current research is developed based on the traffic grid model in NetLogo.
The simulated world in NetLogo is composed of patches and turtles.
Patches are arranged in grids, which have fixed locations. Turtles are individuals that can move on patches, they have their own properties to enable them to form their characteristics and behavior rules. The programming for this research was based on the two components of this platform, using turtles to simulate cars, patches to represent roads, blocks and destinations. The movement and action of each car is written in the car procedures. In NetLogo, scheduling works on every minimal time unit in the form of ordering agents to complete their procedures by turn.
3. MODELING REALIZATION 3.1 Environment preparation
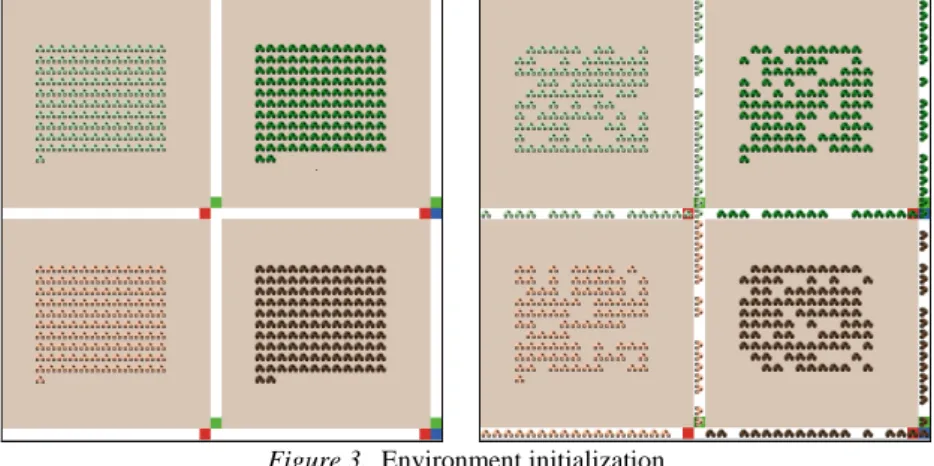
The roads and blocks are set up as an evenly distributed grid pattern. The pattern is shown in Figure 3, below. Blocks are initialized with different populations, which show in the number of cars. Each block has two roads surrounding the block, one is below and the other one is to the right side of the block. Roads are set up as white cells; they are initialized with the same capacity and speed limit. Capacity is used to control how many cars can be put on the roads and is represented as the percentage of road cells occupied by cars. When the super agent allocates the cars, it randomly picks a number of cars from the blocks and sets them on the blocks’ roads. In Figure 3, we can see that cars have different colors according to their block ID, and they can only be arranged on the two roads of their blocks. Traffic lights are set near the roads’ intersections, in green or red; the destinations are set on the intersections on the right side of the simulated world, which are the blue cells.
Figure 3. Environment initialization
3.2 Vehicle simulation
In this microscopic simulation, cars can respond individually to traffic situations. Roads in the model are one directional, so cars can only move to the right or move down. The speed of cars is set based on the basic rule of avoiding collision. For each car, it can speed up or slow down; meanwhile, we assume that a car can always stop immediately. The speed limit is the possible maximum speed for each car. The algorithm for car speed is, if there is a car in the patch ahead, slow down, or else speed up using acceleration, but all the cars are restricted by maximum speed. When the cars come to an intersection, they must stop if they encounter red traffic lights. Cars can also turn at intersections according to the traffic conditions, if they are blocked at an intersection they are more likely to turn in another direction.
3.3 Strategy simulation
Staged strategy is used in this paper; three kinds of strategies for this model are considered here. The first one is to evacuate simultaneously, the second one is for cars nearest to the destinations to go first, and the last one is for the cars furthest away from the destinations to go first. The strategies are realized by arranging blocks in a particular order and controlling the start time for each block using the time interval parameter. The evacuation order under different strategies is shown in Figure 4, below. The blue point is the destination, the number represents the order of evacuation.
Figure 4. Evacuation order for different strategies
4. DESIGN OF EXPERIMENTS 4.1 Evacuation scenarios
In this research, the different combinations of road pattern, population distribution and evacuation strategy are considered as scenarios. In this
experiment, the roads are set as a grid pattern; six columns multiplied by six rows of blocks in total. We designed three kinds of population distribution, including an even, distance and inverse distance distribution. Based on these distributions, the three kinds of evacuation strategies were tested.
4.2 Model parameters
We design some parameters to increase the flexibility of the model. All of the parameters can be changed through the graphic user interface of the model. So that users may adjust the values and study on the effects of different parameters. In the experiment, we only change two parameters, and set other parameters unchanged, shown in Table 1.
Table 1. List of Parameters
Name Definition Value
grid-size-x Number of blocks in horizontal direction. 6 grid-size-y Number of blocks in vertical direction. 6 capacity The limitation for cars on the road. 0.7 time-interval Time interval for different blocks to evacuate. 20
num-dest Number of destinations. 4
distribution-pattern Population distribution pattern (three types). Adjust evacuation-strategy Different evacuation order for blocks (three types). Adjust
speed-limit Speed limit for cars. 1.0
ticks-per-cycle To control the traffic lights’ cycle. 15 show-distribution Whether to show distribution graph as background. no
4.3 Recording of metrics
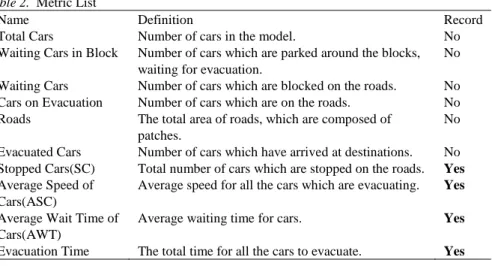
During the running of the model, some metrics are monitored in order to evaluate the performance of each experiment. Some of the metrics were recorded from the monitor windows of NetLogo; some were only observed.
Table 2. Metric List
Name Definition Record
Total Cars Number of cars in the model. No
Waiting Cars in Block Number of cars which are parked around the blocks, waiting for evacuation.
No Waiting Cars Number of cars which are blocked on the roads. No Cars on Evacuation Number of cars which are on the roads. No Roads The total area of roads, which are composed of
patches.
No Evacuated Cars Number of cars which have arrived at destinations. No Stopped Cars(SC) Total number of cars which are stopped on the roads. Yes Average Speed of
Cars(ASC)
Average speed for all the cars which are evacuating. Yes Average Wait Time of
Cars(AWT)
Average waiting time for cars. Yes
Evacuation Time The total time for all the cars to evacuate. Yes
4.4 Experiment running
In this research, the experiments were run in NetLogo based on high performance cluster, using VIPER Queue, from the University of North Carolina, Charlotte (UNCC). The programs are encapsulated in different jobs and are automatically sent to queue. Once the experiments are set up and parameters are modified, the whole process will run multiple times on different nodes. After that, results can be achieved on the queue; instead of
waiting by the computer for the duration of the experiment, results were achieved from the queue after about 30 minutes. It is much faster than running all the experiments in the windows’ operation environment manually.
5. RESULTS AND ANALYSIS 5.1 Evaluation method
Different metrics have different units and ranges of values. In order to get an overall evaluation result, the values need to be standardized, and then the metrics aggregated. In this model, the extreme value standardization method is used and then the weighted summation method is employed to achieve an overall evaluation result. Two types of metrics are summarized using the different formulas shown below. The weighted summation formula is:
Evaluation Score = w1×Evacuation Time + w2×Average Speed + w3×Average Wait Time + w4×Stopped Cars.
In this research, the weights are set as 40, 30, 20 and 10 according to the importance of the metrics; Evacuation Time (ET) is assumed as the most important metric. After this standardization process, all the data for metrics will be in the range of 0 to 1. The overall evaluation score for one experiment will be in the range of 0 to 100.
Table 3 Standardization
Type Metrics Formula
Positive Average Speed of Cars x = (x-Min)/(Max-Min)
Negative
Evacuation Time
x = (Max-x)/(Max-Min) Stopped Cars
Average Wait Time of Cars
5.2 Results from experiment
Each experiment was run 20 times, which is acceptable for the conditions of the Monte Carlo test (Marriott, 1979). The results are concluded as maximum, minimum and average values of the 20 repetitions, and the average values are used to compare the performances of the different experiments. The results achieved for different scenarios are shown below in Table 4.
Table 4 Results for simulation scenarios Type
Evacuation Time
Stopped Cars(SC)(Avg)
Average Speed of Cars(ASC)
Average Wait Time of Cars(AWT)
exp1
Min 1476.00 656.54 1.53 0.73
Avg 1545.95 689.74 1.62 0.74
Max 1656.00 734.51 1.68 0.75
exp2
Min 1952.00 325.56 1.29 0.60
Avg 2129.95 396.37 1.38 0.62
Max 2406.00 437.64 1.45 0.64
exp3 Min 1926.00 376.40 1.31 0.60
Avg 2050.38 418.03 1.37 0.61
Max 2196.00 457.64 1.44 0.63
exp4
Min 1536.00 682.40 1.60 0.73
Avg 1685.19 772.12 1.67 0.74
Max 1832.00 844.66 1.77 0.76
exp5
Min 2046.00 472.68 1.24 0.56
Avg 2196.43 496.49 1.28 0.58
Max 2342.00 526.49 1.34 0.59
exp6
Min 1922.00 484.98 1.39 0.63
Avg 2051.24 523.27 1.44 0.64
Max 2256.00 550.98 1.51 0.65
exp7
Min 1356.00 739.69 1.47 0.66
Avg 1515.81 810.80 1.53 0.68
Max 1712.00 890.75 1.62 0.70
exp8
Min 1802.00 384.10 1.30 0.60
Avg 1987.90 420.64 1.38 0.62
Max 2196.00 476.70 1.49 0.64
exp9
Min 1836.00 418.45 1.12 0.51
Avg 2037.52 468.01 1.19 0.54
Max 2226.00 516.10 1.26 0.56
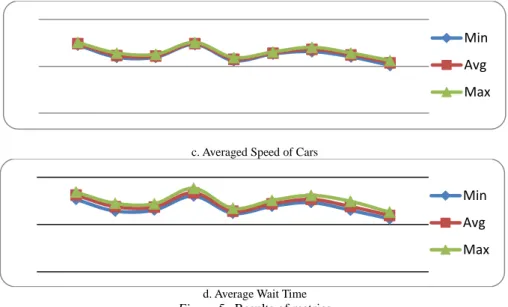
The results for different metrics are shown in Figure 5. According to the type of metrics, the three negative metrics should be similar, and they should be almost inverse to the Evacuation Time. However, we can see that the result trends for SC and AWT are quite similar with ASC. Through observing the running of the model, it was found that when the speed of cars is very high, which will happen near the end of the evacuation process, then the cars become blocked because of the traffic lights and spend time waiting for green lights. This explains the reason why the higher the ASC, the higher the value of the SC and AWT.
a. Evacuation Time
b. Stopped Cars
Min Avg Max
Min Avg Max
c. Averaged Speed of Cars
d. Average Wait Time Figure 5. Results of metrics
5.3 Evaluation results
The evaluation results for all the experiments are shown in Table 5. The results are compared in Figure 6. The data of the weighted evaluation, evacuation time, the number of stopped cars, the average speed of cars and observed average wait time of cars in different scenarios are clarified.
Table 5. Evaluation Scores
Figure 6. Evaluation results for different scenarios
Min Avg Max
Min Avg Max
Weighted Evaluation
Evacuation Time
Stopped Cars (SC)(Avg)
Average Speed of Cars(ASC)
Average Wait Time of Cars (AWT)
exp1 68.159 95.571 29.211 89.899 0.198
exp2 37.733 9.767 100.000 38.353 61.602
exp3 42.074 21.458 94.772 36.747 64.945
exp4 60.979 75.114 9.333 100.000 0.000
exp5 29.484 0.000 75.842 18.507 81.739
exp6 40.764 21.332 69.378 51.396 49.372
exp7 67.291 100.000 0.000 70.774 30.294
exp8 45.220 30.637 94.142 39.456 58.568
exp9 37.610 23.347 82.713 0.000 100.000
6. CONCLUSION
Conclusions have been arrived at according to the evaluation results. For each population distribution, the first strategy always results in the best outcome, so the population distribution pattern in these experiments is not significant.
The best performance of all the experiments is Experiment 1, the simultaneous evacuation under even distribution, because under this scenario roads are fully utilized, while in other cases, drivers waste a lot of time waiting for cars from other blocks to evacuate first.
When the average car speed is high or there are few cars on the roads, the traffic control becomes a significant factor for evacuation efficiency.
Therefore, the evacuation speed can be improved by reducing the switch interval time for traffic lights under this situation, or by trying to use people for directing traffic.
This research built a traffic model to simulate different evacuation scenarios and evaluated the simulation results. The whole process proves to be an effective and convenient way to collect feedback simulation data, which can assist in analyzing evacuation strategies and bottleneck issues.
There is a lot of research that can be referred to regarding this model.
Many parameters were set as fixed values; some of them may be critical factors under specific conditions. Those parameters can be adjusted and then the results analysed. What’s more, the model can be improved and developed in many ways. For example, two lanes and directions for roads can be considered, which would be closer to a realistic situation. Also, empirical data could be imported into the model. For example, true road networks and real population distributions. In this way more meaningful suggestions for evacuation plans in specific regions can be attained.
REFERENCES
Jha, M., Moore, K. and Pashaie, B. 2004. Emergency evacuation planning with microscopic traffic simulation. Transportation Research Record, 1886: 40-48.
Champion, A. et al., 1999. Traffic generation with the SCANeR II simulator: towards a mulit- agent architecture. DSC '99: Proceedings of the first Driving Simulation Conference, 1999: 311-324.
Kuligowski, Erica Dawn. 2003. The evaluation of Performance-Based Design Process for a Hotel Building: The Comparision of two Egress Models. Master of Science Thesis.
Department of Fire Protection Engineering, University of Maryland, College Park, Maryland.
Algers, S. et al., 1997. Review of Micro-Simulation Models. SMARTEST Deliverable D3, , Institute for Transportation Studies, University of Leeds, Leeds, UK, Aug. 1997.
Schulze, T. and Fliess, T., 1997. Urban traffic simulation with psycho-physical vehicle- following models, WSC '97: Proceedings of the 29th conference on Winter simulation, 1997, ACM Press pp1222-1229.
Santos G, Aguirre B (2004) A critical review of emergency evacuation simulation models, Proceedings of building occupant movement during fire emergencies, Gaithersburg, Maryland.
Sheffi, Y ., H. Mahmassani, and W. Powell. A Transportation Network Evacuation Model.
Transportation Research Part A, Vol. 16, No. 3, 1982: 209-218.
FERBER, J., 1999. Multi-agent Systems: Introduction to Distributed Artificial Intelligence.
England: Addison Wesley.
The Institute For Modeling Comlexity, 2004. Understanding the Modeling Process [online].
Available from: http://netlogo.modelingcomplexity.org/modeling_process.htm [Accessed November 2005]
Volker Grimm, Uta Berger, Donald L. DeAngelis, J. Gary Polhill, Jarl Giske, Steven F.
Railsback, The ODD protocol: A review and first update, Ecological Modelling, Volume 221, Issue 23, 24 November 2010, Pages 2760-2768, ISSN 0304-3800, 10.1016/j.ecolmodel.2010.08.019.
RAILSBACK, S.F. et al., Draft as of Jan 2006. Agent-based Simulation Platforms: Review and Development Recommendations.
F. H. C. Marriott, "Barnard's monte carlo tests: How many simulations?" Journal of the Royal Statistical Society. Series C (Applied Statistics), vol. 28, no. 1, 1979. [Online]. Available:
http://dx.doi.org/10.2307/2346816