熊本大学学術リポジトリ
Pulsed and DC discharges in supercritical carbon dioxide
journal or
publication title
Digest of Technical Papers‑IEEE International Pulsed Power Conference
volume 2007
page range 1528‑1531
year 2007‑06
URL http://hdl.handle.net/2298/10323
PULSED AND DC DISCHARGES IN SUPERCRITICAL CARBON DIOXIDE ∗
T. Kiyan
ξ, K. Tanaka, A. Uemura, M. Takade, B. C. Roy, T. Namihira, M. Sasaki, H. Akiyama, M. Goto and M. Hara
Graduate School of Science and Technology, Kumamoto University, 2-39-1 Kurokami, Kumamoto 860-8555, JAPAN
∗
The work is supported by the 21st century center of excellence (COE) program on pulsed power science.
ξ
email: [email protected]
Abstract
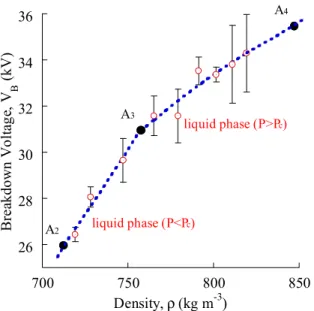
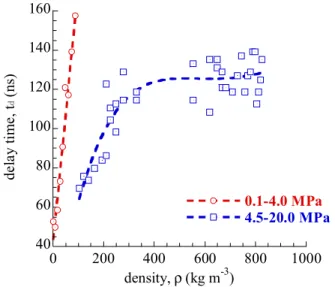
This paper reports the experimental results on the breakdown voltage and phenomena in carbon dioxide medium at 298, 304 and 373 K and within the pressure range of 0.1 to 12.0/20.0 MPa under the point-to-plane electrode using negative dc and pulsed discharge. From the experimental results of negative dc discharge, corona discharges with preceding as well as complete breakdown are observed more clearly in liquid and in supercritical phase than in gas phase of carbon dioxide. The calculated electric field intensity on the tip of point electrode at the corona onset voltage is about 450 MV/m; it suggests that corona is triggered by the field emission of electron. The breakdown mechanism of liquid phase can be classified into two categories in comparison with critical pressure of medium. On the other hand, in the experimental result of pulse electric discharge, the time delay of pulse forming and the relevance of the medium density were found.
I. INTRODUCTION
The point of view of green chemistry, the concern with the union of supercritical fluids (SCFs) and discharge plasma has been growing for the last several years. SCFs used as extraction as well as reaction media have received increasing attention in a variety of field due to the following features: a) the attractive properties of it (which are neither typical gases nor typical liquids but having intermediate properties) such as liquid like densities and gas like viscosities coupled with enhanced diffusion coefficients b) provide high solubility, improved mass transfer and high heat transfer is achieved by the large thermal conductivity [1, 2].
Among the industrial applications of SCFs, carbon dioxide (CO
2) is mostly preferred because it is safe, noncombustible, inexpensive, nontoxic, easily available, and has low critical temperature and pressure. On the other hand, the production of electric discharge plasma in atmosphere [3] or underwater [4] will generate various reactive species such as high-electrons, ions and radicals those may enhance chemical reaction in media. To put it more concretely, it is surely a very attractive idea for the production of electric discharge plasma combines with supercritical fluids technology. It may offer a possibility of new horizon in reaction fields near future.
Ito et al. studied the electric discharge characteristics in supercritical carbon dioxide using minute gap of micron order, and observed the unique phenomenon in which the local minimum of breakdown voltage appeared near the critical point, and presumed that this may be due to the cluster formation in supercritical carbon dioxide [5]. Lock et al. studied the characteristic of dielectric breakdown for CO
2media by applying pulsed voltage with 100ns pulse width in a coaxial cylinder electrode system. In her study, it is demonstrated that the dropping of breakdown voltage to about one third of conventional Paschen's law estimated due to the inhomogeneity of carbon dioxide density near critical point [6].
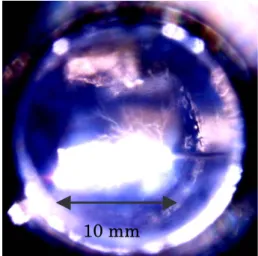
Figure 1 shows a typical photograph of the arc discharge (thermal plasma) produced by our experimental apparatus using a Blumlein type Pulse Forming Network (B-PFN) at 10.1 MPa and 323 K. For instance, the light emitted from discharge plasma directly indicates its chemical activity.
10 mm
Figure 1. Typical photograph of arc discharge in CO
2The purpose of this study is to explore discharge
phenomena in carbon dioxide media using negative dc
and pulsed discharge. Because of the development of a
plasma reactor under supercritical fluids, knowledge of
prebreakdown phenomena and breakdown characteristics
in pressurized carbon dioxide up to supercritical condition
is indispensable. The final goal of this research is the
industrial application of discharge plasma in supercritical
fluids medium.
II. EXPERIMENT APPROACH AND EXPERIMENTAL CONDITION
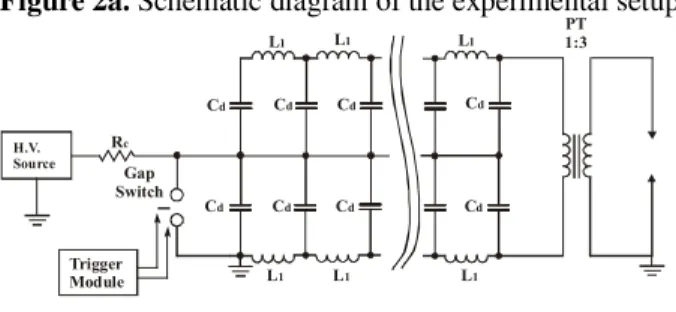
In both pulsed and negative dc discharge, a schematic diagram of the base experimental setup is shown in Figure 2a. In cases where pulse electric discharge was generated, B-PFN was introduced into the input side of feedthrough.
Test reactor is made of stainless steel (SUS316) having the maximum temperature 573 K, compressive strength of 30 MPa, the total volume 1,300 mL and an inspection window through which continuous monitoring was performed. Power lead was introduced through the center of long bushing made of peak resin, and the annular space was sealed off with double o-rings placed outer surface of it to prevent air leakage. The CO
2used as an electric discharge atmosphere was connected with the test cell through the cooling system and pump. The B-PFN consists of 7 stages with winding ratio of pulsed transformer 1: 3, as shown in Figure 2b, which was used in case of pulsed discharge. The circuit parameters of B- PFN have a capacitor (1.7 nF) and an inductor (0.2 µ H).
OSC curr ent tr an sfor mer high-volta ge bush ing
H.V. So urce PMT
pum p coo ling system
High voltage probe
2MΩ
Figure 2a. Schematic diagram of the experimental setup
Rc
Cd Cd Cd Cd
Cd
L1 L1 L1
L1 L1 L1
Cd Cd Cd
H.V.
Source Gap
Switch
PT 1:3
Trigger Module
Figure 2b. The circuit of B-PFN with trigger module is connecting to high voltage power supply.
In case of negative dc discharge, the corona light intensity of the tip of the point electrode and applied voltage within electrodes were simultaneously measured using photo multiplier tube (PMT) in order to observe prebreakdown phenomena of electric discharge. A series of measurements in our experiment were carried out controlling pressure decreased gradually in the test cell to each experimental pressure that was controlled by
backpressure regulator keeping constant temperature. The experimental conditions are shown in Table 1.
Table 1. Experimental conditions
Exp. condition
Exp.#1 Exp.#2
Applied source: Negative dc discharge Pulsed discharge Electrode: Point - Plane Point - Plane
Gap length: 0.20 mm 10.0 mm
Temperature: 298K (Gas-Liquid) 304/373K (Gas-SCF) Pressure range: 0.1 - 12.0MPa 0.1 - 20.0MPa
III. RESULTS AND DISCUSSION
The measurement of breakdown voltage has been carried out using two kinds of power supplies namely negative dc and pulse discharge. And also we have performed the observation of luminescence from corona discharge in order to investigate prebreakdown phenomena. In this work, the discharge phenomenon in CO
2media has been illustrated under the three points: the prebreakdown phenomena, the breakdown characteristic using negative dc, and the breakdown characteristic using pulsed discharge. But at first, it is better to demonstrate how the phase changes as a function of molecular density in order to explain the electric discharges phenomenon.
Figure 3 shows thermodynamic state of CO
2named the pressure-density changes of carbon dioxide within the temperature range 283 - 373 K. These curves were calculated using the equation of state [7], to demonstrate the characteristics of electric discharges. The bold lines in this figure indicate the experimental temperatures of 298 and 304, 373 K for the production of negative dc and pulsed discharge, respectively. The point corresponding to the critical temperature 304 K and critical pressure 7.38 MPa is the critical point. In order to understand breakdown phenomena of electric discharges, the liquid phase to be considered as low-pressurized liquid and high-pressurized liquid phases those are separated by the critical pressure line.
Another important fact is the ionization phenomenon in gas, liquid and super fluidity media is deeply related to a mean free path, and a mean free path is inversely proportional to density. From this figure, it is observed that the characteristics of curves above the critical isotherm and below it are different with change in temperature. The area between the right-upper side of saturated curve and the right side of critical isotherm is liquid but it would be better to mention low-pressure liquid and high-pressure liquid below and above the critical pressure line, respectively, on the viewpoint of electric discharges. This distinction is very useful to explain the mechanism of breakdown process. In the experimental condition of temperature constancy, if electric discharge is generated between electrodes, the phase state at the tip of a point locally can be changed the state by the electric discharge. For example, X
1may be shifted to X
2-X
3-X
4, and X
5to X
6. Therefore, it seems that the phase change may be occurred locally, as shown figure 3.
1529
0 200 400 600 800 1000 0
2 4 6 8 10 12 14
Pr es su re (MP a)
Density (kg m
-3)
critical isotherm
333K 313K 304K
298K
283K
liquid (P > Pc) supercritical phase
X
5X
6saturated gas line critical point
saturated liquid line liquid (P < Pc)
X
1X
2X
3X
4wet vapour
373K