Prostate Cancer Cells via Hydrogen Peroxide Accumulation
著者 金 延任
著者別表示 Kim Jungim journal or
publication title
博士論文本文Full 学位授与番号 13301甲第4099号
学位名 博士(医学)
学位授与年月日 2014‑09‑26
URL http://hdl.handle.net/2297/41997
Abstract. Background: The functions of superoxide dismutase-3 (SOD3), which acts on the cell surface and protects cells from oxidative stress, remain uncertain in progression of prostate cancer. Materials and Methods: To verify SOD3 expression in human prostate tissue, immunohistochemistry was performed using tissue microarray. To investigate the effects of SOD3 on proliferation, migration, and invasion, SOD3 was overexpressed and recombinant SOD3 was employed in PC- 3 prostate cancer cells. H2O2 level, reduced glutathione (GSH)/ oxidized glutathione (GSSG) ratio, catalase activity, and 8-oxo-2’-deoxyguanosine (8-OHdG) were estimated in SOD3-overexpressing PC-3 cells. Results: Immunohisto- chemistry revealed reduced expression of SOD3 in prostate cancer tissue. SOD3 overexpression in PC-3 cells inhibited cell proliferation, migration, and invasion. Recombinant SOD3 had the same effect. H2O2 accumulation was increased by SOD3 overexpression, GSH/GSSG ratio decreased, and catalase activity decreased. DNA damage in SOD3-overexpressing cells was confirmed by 8-OHdG elevation. Conclusion: Since SOD3 acts as a tumor suppressor, SOD3 overexpression and recombinant SOD3 might lead to treatment for prostate cancer.
Prostate cancer and castration-resistant prostate cancer (CRPC) can progress into a more advanced level via generation of oxidative stress, which can induce the
formation of reactive oxygen species (ROS), as well as activation of androgen receptor (1). Usually, antioxidant enzymes function to preserve cell damage by ROS. However, cell defense systems can be destroyed if ROS generation is tremendously increased (2). It has been reported that the activity and expression level of several antioxidant enzymes are low in prostate cancer tissue (3, 4). Thus, it is important to explore the correlation between antioxidant enzymes directly related to ROS and prostate cancer.
Superoxide dismutases (SODs) have been shown to be the first line of antioxidants that protect cells against detrimental oxidative stress by catalyzing the two superoxide radicals (O2•–) to hydrogen peroxide (H2O2) and oxygen (O2) (5, 6).
There are three isoforms in human SODs, SOD1 (copper-zinc SOD; CuZnSOD), SOD2 (manganese SOD; MnSOD), and SOD3 (extracellular SOD; EcSOD) (7). SOD2 overexpression reduced the growth, proliferation, and invasion of human lung cancer (8). It also reduced cell growth of SOD2- overexpressing prostate cancer PC-3 cells (9). The high level of H2O2produced by SOD2 overexpression might contribute to the anti-proliferative function. In highly proliferative cancer cells, ROS are ironically accumulated by up-regulation of antioxidant enzymes in genetically manipulated cells (10).
Although a high level of ROS in cancer cells can induce tumorigenesis, ROS also increase the susceptibility of cancer cells to death (11).
SOD3 is known as the only antioxidant enzyme which acts on the extracellular matrix (12) in only a few cell types (13). SOD3 can be present both within cells and in conditioned media (7, 14). It was reported that SOD3 overexpression is correlated with down-regulation of matrix metalloproteinases (MMPs) activity and cell invasion in prostate cancer cells (14).
However, the influence of SOD3 on cell proliferation or migration of prostate cancer cells has not yet been well elucidated. In the present study, we focused on the alteration of cell proliferation, migration, and invasion in terms of the Correspondence to: Atsushi Mizokami, Department of Integrative
Cancer Therapy and Urology, Kanazawa University Graduate School of Medical Sciences, 13-1 Takaramachi, Kanazawa, Ishikawa, 920-8640, Japan. Tel: +81 762652393, Fax: +81 762226726, e-mail: [email protected]
Key Words: SOD3, prostate cancer, proliferation, migration, hydrogen peroxide, DNA damage.
SOD3 Acts as a Tumor Suppressor in PC-3 Prostate Cancer Cells via Hydrogen Peroxide Accumulation
JUNGIM KIM1, ATSUSHI MIZOKAMI1*, MINKYOUNG SHIN1, KOUJI IZUMI1, HIROYUKI KONAKA1, YOSHIFUMI KADONO1, YASUHIDE KITAGAWA1, EVAN T. KELLER2, JIAN ZHANG3 and MIKIO NAMIKI1
1Department of Integrative Cancer Therapy and Urology, Kanazawa University Graduate School of Medical Sciences, Kanazawa, Ishikawa, Japan;
2Department of Urology and Pathology, University of Michigan, Ann Arbor, Michigan, U.S.A.;
3Center for Translational Medicine, Guangxi Medical University, Nanning, Guangxi, China
cellular redox state, which has significant effects on the supervision for cell survival by SOD3.
Materials and Methods
Immunohistochemistry. Two types of prostate cancer tissue microarrays (TMAs, 4012209 and A302IV) were purchased from Provitro (Berlin, Germany) and Isu Abxis Co. Ltd. (South Korea), respectively. Immunohistochemical (IHC) staining was performed through the Dako ChemMate ENVISION Kit/HRP (DAB)-universal kit (K5007) according to the manufacturer’s protocol (Dako, Carpinteria, CA, USA) and the method described by Shin et al.
(15). Tissue specimens were stained with rabbit polyclonal antibodies against SOD3 (Santacruz Biotechnology, Inc. Dallas, TX, USA).
Cell culture. Human prostate carcinoma cell line PC-3 (ATCC, Manassas, VA, USA) were cultured in RPMI-1640 (Sigma-Aldrich, St. Louis, MO, USA) supplemented with 1% penicillin/streptomycin (Invitrogen, Carlsbad, CA, USA) and 10% fetal bovine serum (Sigma-Aldrich). The medium was changed every 2-3 days, and cells were routinely grown in 75-cm2vented tissue culture flasks at 37˚C in a humidified atmosphere of 5% CO2.
DNA transfection. PC-3 cells were transiently and stably transfected with 0.25, 0.5, and 1 μg of pCMV6-SOD3 plasmid or pCMV6- Entry plasmid as a vector control (OriGene Technologies, Rockville, MD, USA) by Lipofectamine Reagent (Invitrogen) according to the manufacturer’s instructions. To construct the stable transfection, after transfection of PC-3 cells with 1 μg of pCMV6-SOD3 or pCMV6-Entry, the clones were selected with 200 μg/ml of G418 (Sigma-Aldrich) and isolated by cloning rings for further selection (PC-3/SOD3 and PC-3/Entry, respectively). The selected clones were confirmed by western blot analysis for the level of SOD3 expression and the media in which transfected cells were cultured were also collected to evaluate SOD3.
Preparation of conditioned media. PC-3/SOD3 or PC-3/Entry cells were maintained for 3-5 days after their subculture. Their conditioned media were concentrated by Amicon Ultra-15 Centrifugal Filter Devices (EMD Millipore, Merck KGaA, Darmstadt, Germany). The treated protein amount in conditioned media from PC-3 cells was 500 μg or 1000 μg by the same measurement for protein in western blot analyses.
SOD activity assay.Cell lysates were extracted by adding 200 μl of Mammalian Protein Extract Reagent (M-PER; PIERCE, Rockford, IL, USA) to a 60 mm culture dish with cells and by sonication. This assay was applied to 100 μl of each cell lysates by sandwich enzyme-linked immunosorbent assay (ELISA) Assay Kit according to the manufacturer’s protocol (Northwest Life Science Specialties, LLC, Vancouver, Canada). The 96-well plate provided in the kit was pre-coated with a monoclonal antibody specific to human SOD3 and the absorbance was read at 450 nm.
Reverse-transcription polymerase chain reaction. Total cellular RNA was extracted by using RNeasy Mini Kit (Qiagen, Valencia, CA, USA) according to the protocol described by the manufacturer.
RT-PCR was carried out using the iScript cDNA Synthesis Kit (Bio- Rad, Hercules, CA, USA) and Ex Taq DNA polymerase (TaKaRa,
Shiga, Japan). The primers were SOD1sense: 5’-TGGAGACTTG GGCAATGTGACTGCT-3’ and anti-sense: 5’-GGGCCTCAGA CTACATCCAAGGGAA-3’; SOD2 sense: 5’-CCCAGATAGCTC TTCAGCCTGCACT-3’ and anti-sense: 5’-TAAGCGTGCTCCC ACACATCAATCC-3’; SOD3sense: 5’-TCGTCCTCTTCCGGCA GCTT-3’ and anti-sense: 5’-GCTTCTTGCGCTCTGAGTGCT-3’;
MMP2sense: 5’-TACCACGGCCAACTACGACA-3’ and anti-sense:
5’-ATGATCTAAGCCCAGCGCGT-3’; MMP9 sense: 5’-TACC ACGGCCAACTACGACA-3’ and anti-sense: 5’-AAAGTTCGA GGTGGTAGCGC-3’; glyceraldehyde 3-phosphate dehydrogenase (GAPDH) sense: 5’-CCACCCATGGCAAATTC CATGGCA-3’ and anti-sense: 5’-TCTAGACGGCAGGTCAGG TCCACC-3’. The annealing temperature of RT-PCR and PCR cycle number were 62˚C and 33 cycles for SOD3, MMP2, and MMP9, 65˚C and 25 cycles for SOD1and SOD2, and 65˚C and 20 cycles for GAPDHas a control.
Western blot analysis. Total proteins were extracted from cells by adding 200 μl of M-PER (PIERCE) to 100 mm culture dish of PC- 3/SOD3 and PC-3/Entry cells. Proteins were quantified according to the method of Bradford and more than 50 μg of proteins loaded on a 12.5% Ready Gel J (Bio-Rad). Western blot analysis was carried out as described by Shin et al.and antibodies to SOD1, SOD2, and SOD3 were purchased from Santacruz Biotechnology, Inc. (diluted 1:200) (15).
Native gel activity assay. Concentrated conditioned media blended with an equal volume of a native sample buffer (Bio-Rad) were loaded onto a 4-20% polyacrylamide gel and electrophoresis was performed in nondenaturing running buffer (pH 8.3) at 50 V for 5 h.
The activity of SOD on the gel was visualized by the staining procedure described by Beauchamp and Fridovich (16). Another gel onto which was loaded with the same sample was incubated with 50 mM phosphate buffer (pH 7.8) containing 5 mM H2O2(Nacalai Tesque, Kyoto, Japan) at room temperature for 15 min prior to soaking in riboflavin- nitroblue tetrazolium (NBT) solution.
Cell proliferation assay.One day after PC-3 cells were plated at a density of 1×10⁵cells onto 6-well plates with RPMI-1640 (Sigma- Aldrich) containing 10% fetal bovine serum (Sigma-Aldrich) without penicillin/streptomycin, the cells were transiently transfected with 1 μg of pCMV6-Entry or pCMV6-SOD3. Then cells were counted using a hemocytometer at 24, 48, and 72 h after transfection in triplicate. PC-3 cells were also treated with conditioned media of PC-3/Entry and PC-3/SOD3 cells or the purified recombinant human SOD3 protein (OriGene Technologies, Inc) after cells were plated at a density of 1×10⁵cells onto 6-well plates. Then cells were cultured for the indicated periods (48 h or 72 h) and counted using a hemocytometer. The data represent the means±SD in triplicate.
Wound-healing assay.Cells were plated at a density of 2×10⁵cells onto 60 mm culture dish. Twenty-four hours later, cells were transiently transfected with pCMV6-SOD3 or pCMV6-Entry at a concentration of 0.25, 0.5, and 1 μg. Five hours after transfection, the media were changed to complete media and with a pipette tip, a wound space in the confluent monolayer was made. Cells migrating from the leading edge were photographed at 24, 48, and 72 h after transfection. PC-3 cells were also plated at a density of 2×10⁵cells onto 6-well plates for treatment with conditioned media or 12-well
plates for treatment with recombinant SOD3 protein. The data represent the means±SD of three replicates.
Cell invasion assay.Cell invasion assay was performed using a kit (Chemicon, Temecula, CA, USA) according to the manufacturer’s instructions. The cells were suspended in 300 μl of serum-free medium, and were transiently transfected with 1 μg of pCMV6- SOD3 or pCMV6-Entry vector overnight then placed into inserts and were incubated in a tissue culture incubator for 24, 48, and 72 h. The inserts were gently removed using a cotton-tipped swab.
After staining inserts, they were dipped into a beaker of water several times to rinse and air-dried. These arrays were performed three times, and similar results were obtained.
MMP zymography. Enzymatic activities of MMP2 and MMP9 were determined by Gelatin Zymography Kit (Primary Cell Co., Ltd., Japan). Concentrated conditioned media blended with equivalent volume of 2× Sample Preparation Buffer were loaded onto a 10%
polyacrylamide gel and electrophoresis was performed in Electrophoresis Running Buffer pH 8.3 in 100 V for 2 h. The gel was rinsed with Washing Buffer and incubated at room temperature for 1 h and then incubated with 50 ml of Reaction Buffer at 37˚C overnight.
The gel was stained with Staining Solution at room temperature for 30 min and was destained at room temperature for 30 min.
ROS/Superoxide detection assay.Cells transiently transfected with 1 μg of pCMV6-Entry or pCMV6-SOD3 were loaded with ROS/Superoxide Detection Mix of Total ROS/Superoxide Detection Kit (Enzo Life Sciences, Inc.) at 37˚C incubator for 1 h. The Mix was removed and washed with 1× Wash Buffer. They were observed under a fluorescence/confocal microscope using standard excitation/emission filter sets.
8-OHdG estimation. DNA was extracted from PC-3/Entry and PC- 3/SOD3 cells using EX-R&D Kit (Medical & Biological Laboratories Co., Ltd., Japan) according to the manufacturer’s instructions. After DNA extraction, 8-OHdG estimation was performed by HT 8-oxo-dG ELISA Kit II (TREVIGEN, Gaithersburg, MD, USA) according to the manufacturer’s instructions. The absorbance was read at 450 nm.
GSH/GSSG ratio assay.GSH/GSSG Quantification Kit (DOJINDO Molecular Technologies, Inc., Rockville, MD, USA) was used to measure reduced and oxidized glutathione in pCMV6-Entry and PC- 3/SOD3 cells. The homogenized pellets which were treated with 5%
metaphosphoric acid in PBS were centrifuged. The supernatants were then added to the 96-well plate. All steps were performed as per the manufacturer’s instructions. After adding the substrate solution, coenzyme solution and enzyme solution, the reaction change was monitored every 2 min for 10 min at an absorbance at 415 nm.
Hydrogen peroxide assay.The amount of 100 μg and 1000 μg of proteins acquired from the conditioned media of PC-3/SOD3 or PC- 3/Entry cells were assessed. BIOXYTECH H2O2560™ Quantitative Hydrogen Peroxide Assay Kit (OXIS International, Inc., Portland, OR, USA) was used for production of H2O2. Absorbance was read at 560 nm.
Catalase activity assay.Catalase Assay Kit (Abcam, Cambridge, MA, USA) was used to measure catalase activity. Homogenized PC-
3/SOD3 or PC-3/Entry cells (106) in 200 μl of cold Assay Buffer were centrifuged at 10,000× gfor 15 min at 4˚C and the supernatant collected for assay. We followed the manufacturer’s instructions for this assay.
Statistical analysis.All experiments were carried out in triplicates and mean values±SD are shown. Statistical significance was determined by utilizing Prism 5.0 (GraphPad Software, San Diego, CA, USA). The χ2test was used to assess the significance between different proportions. Analysis of continuous variables between different groups was assessed by one-way ANOVA or two-way ANOVA. Differences between two groups were analyzed by Student’s t-test. Kruskal–Wallis test was used to determine the statistical significance of differences in IHC staining of tissue microarrays.
Results
Evaluation of SOD3 expression in prostate cancer and normal prostate. In order to identify the genes differentially expressed between normal prostate and prostate cancer tissue, we previously compared the expression profiles of three normal prostate biopsy samples and each of three prostate cancer samples using cDNA microarray analysis (Whole Human Genome Microarry 4× 44K (Agilent Technologies; GEO accession number: GSE 30994) (17).
This analysis identified SOD3 gene as being decreased to 21% in prostate cancer tissues compared with normal prostate tissues. The expression levels of SOD1 and SOD2 in PCa tissues were not different from those in normal prostate tissues (data not shown).
To investigate expression level of SOD3 in normal prostate and PCa tissues, we first performed immuno- histochemistry (IHC) via tissue microarrays (TMAs). As shown in (Figure 1 A), we classified the intensity of the staining of SOD3 as four levels, 0, 1+, 2+, and 3+. IHC revealed that 95% (40/42) of normal prostate tissues showed positive expression for SOD3, whereas only 41% (38/92) of prostate cancer tissues showed positive expression for SOD3.
Interestingly, among these positive cases, the ratio of strong expression of over 2+ was 67% (28/42) in normal prostate tissues and 15% (14/92) of prostate cancer tissues (p<0.05) Table I. Immunohistochemistry of superoxide dismutase 3 on prostate tissue microarray.
Clinicopathological Intensity of SOD3 feature
0 1+ 2+ 3+ Total p-Value
Normal 2 12 4 24 42
Gleason score 5, 6 14 8 4 0 26 <0.05
Gleason score 7 27 9 7 1 44 <0.05
Gleason score 8, 9, 10 13 7 1 1 22 <0.05
(Table I). However, this result was not correlated with Gleason score, age, tumor invasion, or T stage.
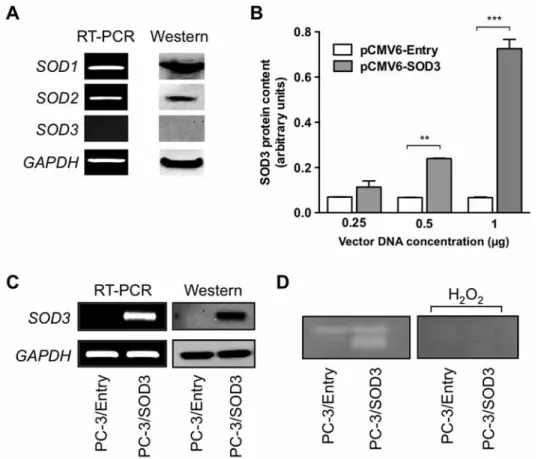
Overexpression of SOD3 in PC-3 cells. First, we examined whether SODs are expressed in androgen-independent prostate cancer cell lines by RT-PCR and western blot analyses (Figure 2A). SOD1 and SOD2 were strongly expressed in PC-3 cells. However, SOD3 was not expressed in PC-3 cells. To explore the effect of SOD3 in PC-3 cells,
we transfected PC-3 cells with pCMV6-SOD3 transiently and the activity for SOD3 in the cell lysate was examined by ELISA (Figure 2B). The activity of PC-3 cells transfected with pCMV6-SOD3 was elevated in a dose-dependent manner compared to those cells frustrated with pCMV6- Entry. Moreover, we successfully generated stable SOD3- overexpressing PC-3 cells (PC-3/SOD3) and confirmed the expression of SOD3 mRNA and protein (Figure 2C). The activity of SOD3 in the conditioned media was also identified Figure 1. Immunohistochemistry of superoxide dismutase 3 (SOD3) in prostate tissue. A: Immunohistochemical expression patterns of SOD3 on the tissue microarray of non-neoplastic speimens and prostate cancer (PCa). The upper panels show normal specimens (i-v) and the lower panels indicate prostate cancers (vi-x). i: normal (intensity 3+) from vi, ii: normal (intensity 3+) from vii, iii: normal (intensity 3+) from viii, iv: normal (intensity 3+) from ix, v: normal (intensity 2+) from x, vi: cancer with Gleason score 7 (intensity 0), vii: cancer with Gleason score 7 (intensity 2+), viii: cancer with Gleason score 7 (intensity 0), ix: cancer with Gleason score 8 (intensity 0), x: cancer with Gleason score 9 (intensity 1+). B:
Quantitative analysis of sections as shown in A. All panels shown at ×40 magnification, the areas of the field indicated are shown enlarged as seen at ×100 magnification.
by gel enzymatic assay (Figure 2D). Here, this activity of SOD3 can be inhibited or inactivated by various agents such as H2O2, azide, cyanide, and dietheldithio-carbamate (5). We confirmed that SOD3 was reduced by addition of H2O2 (Figure 2D). Thus, we verified the existence of SOD3 in PC- 3 cells in the cell lysates as well as in the media.
Overexpression of SOD3 suppresses cell proliferation.It has been reported that overexpression of SOD2 has an inhibitory effect on the growth of PC-3 cells as a tumor-suppressor gene (9). We investigated whether SOD3 could suppress cell proliferation as well as SOD2. The proliferation of PC-3 cells transiently transfected with pCMV6-SOD3 remarkably decreased in a time-dependent manner compared to those with pCMV6-Entry. To see the effect of SOD3 at the extracellular surface, we used conditioned media from PC- 3/SOD3 or PC-3/Entry cells, and treated PC-3 cells with them. The proliferation of PC-3 cells was inhibited by 500 or 1000 μg of conditioned media of PC-3/SOD3 cells more than that of PC-3/Entry cells (Figure 3B). Moreover, we
utilized purified recombinant human SOD3 protein to confirm the effect of SOD3 on cell growth inhibition (Figure 3C). Treatment of PC-3 cells with recombinant SOD3 protein caused the inhibition of cell proliferation in a dose- dependent manner, suggesting that SOD3 functions as a tumor suppressor in PC-3 cells.
Overexpression of SOD3 inhibits cell migration and invasion and inactivates MMP2 and MMP9. We further investigated if SOD3 affects the cell migration and invasion of PC-3 cells.
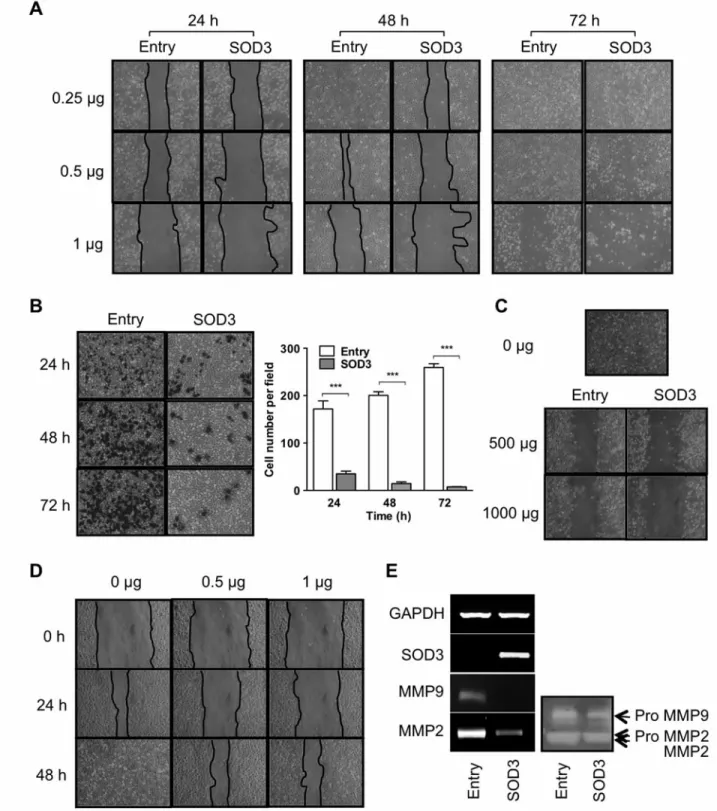
Firstly, we performed the wound-healing assay to explore cell migration using cells transiently transfected with pCMV6-SOD3. We found a dose-dependent difference in migration between PC-3 cells transfected with pCMV6-Entry and pCMV6-SOD3 (Figure 4A). Next, to confirm the effect of SOD3 on cell invasion, the cells transiently transfected with pCMV6-SOD3 or pCMV6-Entry were applied to an invasion assay. The number of invaded cells was significantly reduced by SOD3 by 79.7%, 92.8%, and 97.1% at 24, 48, and 72 h, respectively (Figure 4B).
Figure 2. Superoxide dismutases (SODs) and stable transfection of SOD3 in PC-3 cells. A: mRNA and protein expression of endogenous SODs in PC-3 cells. B: After PC-3 cells were transiently transfected with pCMV6-SOD3 and pCMV6-Entry, SOD3 activity of the cell lysates was measured by ELISA. **p<0.05 and ***p<0.001. C: Expression of SOD3 mRNA and protein of PC-3/Entry and PC-3/SOD3. D: SOD3 activity was assayed in conditioned media including 300 μg of protein by native gel electrophoresis. After electrophoresis, the gel was stained for SOD3 activity and confirmed with 5 mM of H2O2, one of agents for inhibition of SOD3 activity.
Furthermore, we investigated the effect of the conditioned media derived from PC-3/SOD3 cells (Figure 4C) and recombinant human SOD3 protein on migration of PC-3 cells (Figure 4D). Conditioned media derived from PC-
3/SOD3 and recombinant SOD3 protein also inhibited migration of PC-3 cells in a dose-dependent manner.
Since cancer invasion is closely connected with MMPs regarding extracellular matrix renovation (18), we Figure 3. Effect of superoxide dismutase 3 on cell proliferation of PC-3 cells. A: After transfection of PC-3 cells with pCMV6-Entry or pCMV6-SOD3, the cells were photographed and counted in triplicate at 24, 48, and 72 h. B: After 500 μg or 1000 μg of conditioned media derived from PC- 3/SOD3 or PC-3/Entry cells was added to PC-3 cell cultures, cells were photographed and counted at 24, 48, and 72 h. C: After recombinant human SOD3 protein was added to PC-3 cells, the cells were photographed at 24, 48, and 72 h and counted at 72 h. **p<0.05 and ***p<0.001.
Figure 4. Effect of superoxide dismutase 3 on cell migration and invasion in PC-3 cells. A: Migrated cells were photographed at 24, 48, and 72 h after transfection. B: Cells transiently transfected with 1 μg of pCMV6-SOD3 or pCMV6-Entry were applied to an invasion assay and the cells that invaded the membrane were observed for 24, 48, and 72 h. ***p<0.001. C: Migration assay of PC-3 cells was carried out after treatment of conditioned media including 500 μg or 1000 μg protein from PC-3/SOD3 or PC-3/Entry cells. D: Migration assay of PC-3 cells was carried out with treatment of purified recombinant human SOD3 protein. E: The mRNA level of matrix metalloproteinase (MMP) 2 and MMP9 was measured by reverse-transcription polymerase chain reaction in PC-3 cells transfected with 1 μg of pCMV6-SOD3 or pCMV6-Entry for 48 h (left) and the activity of MMP2 and MMP9 was assessed by zymography (right).
investigated the expression and activity of MMP2 and MMP9 in PC-3 cells transfected with pCMV6-SOD3 or pCMV6-Entry (Figure 4E). The expression of MMP2 and MMP9mRNA was down-regulated in pCMV6-SOD3 cells compared to pCMV6-Entry cells. Zymographic analysis also revealed that the activity of MMP2 and MMP9 was reduced in pCMV6-SOD3 cells in accordance with the expression of MMPs, suggesting that SOD3 impacts extracellularly and intracellularly on cancer cell movement, such as migration and invasion, by reducing activity of MMP2 and MMP9 in PC-3 cells.
Overexpression of SOD3 changes cellular redox state and lead to accumulation of H2O2. It has been reported that oxidative stress caused by ROS is related to prostate cancer progression and aggressiveness (19, 20). Therefore, we wondered whether ROS production or O2•– change as a fundamental function of SOD3 could be observed. We investigated total ROS/superoxide in PC-3 cells transfected with pCMV6-SOD3 and pCMV6-Entry (Figure 5A).
Although the total ROS level was not changed irrespective of SOD3 overexpression, O2•– level was significantly reduced on SOD3 overexpression at 48, and 72 h after transfection.
Figure 5.Effect of superoxide dismutase 3 on reactive oxygen species and H2O2production by PC-3 cells. A: Total ROS and O2•–detection in PC- 3 cells after transfection with pCMV6-SOD3 or pCMV6-Entry at 48, and 72 h. Green and orange fluorescence represent total ROS and O2•–, respectively. Pyocyanin and N-acetyl-L-cysteine were used as a positive control (Pos.) and a negative control (Neg.), respectively. B: H2O2production with conditioned media including 100 μg or 1000 μg protein from PC-3/SOD3 and PC-3/Entry cells was detected by microplate reader. C: Catalase (CAT) activity was assessed for the cell lysates of PC-3/SOD3 or PC-3/Entry cells. D: Reduced glutathione (GSH)/ oxidized glutathione (GSSG) ratio in PC-3/SOD3 and PC-3/Entry cells was assessed. E: DNA damage as 8-oxo-2’-deoxyguanosine (8-OHdG) level in PC-3/SOD3 and PC-3/Entry cells was measured. Mean±SD was used at least three independent samples per group. ***p<0.0001.
H2O2, representative of oxidative stress, is the product of dismutation by SODs. H2O2produced in SOD3-overexpressing cells should be accumulated either in the intracellular environment or in the extracellular one if the removal system for H2O2, detoxification, is not appropriate. Thus, we measured H2O2 production with 100 μg and 1000 μg of conditioned media derived from PC-3/SOD3 cells (Figure 5B). We measured extracellular H2O2 because of its fast diffusing properties towards the outside of cells and cumulative characteristics in the media (9, 21). H2O2 produced in PC- 3/SOD3 cells was remarkably accumulated in a dose- dependent manner compared with that of PC-3/Entry cells.
H2O2 should be removed by catalase in the cellular environment (22, 23). However, catalase activity in PC- 3/SOD3 cells was low compared to that of PC-3/Entry cells (Figure 5C). Moreover, GSH is oxidized by reacting with H2O2 and converted to GSSG. Glutathione peroxidase is involved in this reaction. Therefore, we compared glutathione peroxidase activity between PC-3/Entry and PC- 3/SOD3 cells. However, glutathione peroxidase activity was not different between these cells (data not shown). Since the GSH/GSSG ratio is a marker of oxidative stress, and with decreased GSH cells cannot eliminate H2O2 well (24), the ratio in PC-3/SOD3 and PC-3/Entry cells was also examined.
The ratio of PC-3/SOD3 cells decreased to half of that of PC-3/Entry (Figure 5D). These results suggested that H2O2 produced by overexpression of SOD3 was accumulated due to low CAT activity and decreased GSH/GSSG ratio.
Finally, in order to reveal the DNA damage produced by H2O2, we examined 8-OHdG production (Figure 5E). DNA damage in PC-3/SOD3 cells was twice as high as that of PC- 3/Entry cells, suggesting that the cells transfected with pCMV6-SOD3 under the condition of an excessive amount of H2O2 by manipulation of antioxidant enzyme could affect cell proliferation, migration, and invasionvia DNA damage.
Discussion
There have been lots of investigations into SODs in a variety of human cancer cell types, including prostate, breast, and lung cancer (4, 18). Baker et al. demonstrated that the expressions of antioxidant enzymes such as CAT, SOD1, and SOD2 were lower in PCa tissues compared with those of normal tissues (3). However, SOD3 expression has not been evaluated yet. Our previous cDNA microarray analysis revealed differences in the SOD3 expression of biopsy samples between normal prostate and prostate cancer (17).
We investigated whether the expression of SOD3 in prostate cancer tissues is different from that in normal tissues. The expression level of SOD3 was reduced in prostate cancer tissues compared to that of normal tissue derived from the same patients. It remains unclear why SOD3 expression is reduced in tissue. However, SOD3 could become a
biomarker of prostate cancer pathologically, although malignant grade did not influence expression of SOD3.
We characterized functions of SDO3 to evaluate whether SOD3 is a tumor-suppressor gene, as well as a biomarker of prostate cancer. We then investigated the effect of SOD3 on cell proliferation, migration, and invasion of prostate cancer cells. SOD3 overexpression reduced cell proliferation of PC- 3 cells. Furthermore, conditioned media of PC-3/SOD3 cells repressed the proliferation of PC-3 cells, suggesting that SOD3 itself or other unknown secreted factors regulated by overexpression of SOD3 might affect cell proliferation.
Experiments with purified recombinant human SOD3 protein indicated the possibility that one of unknown factors is SOD3 protein.
We further focused on cell migration and invasion to assess how SOD3 overexpression affects cancer cell migration. We found that transfect ion of PC-3 cells with SOD3 suppressed prostate cancer cell progression. In general, it is well-known that some MMP family members, MMP2 and MMP9, play an essential role in tumor invasion and angiogenesis in many types of cancer, and they are more activated and increased when cancer progresses through the higher grades (25). ROS generation may induce migration and invasion by activating MMP2 and MMP9 in prostate cancer cells (19, 26-28). In contrast, excessive ROS can also elicit cancer cell death such as apoptosis or diverse cell damage (29, 30). Moreover, Ganguly et al. described that MMP2 was down-regulated by exogenous H2O2 (31).
Although the total ROS level was not changed by overexpression of SOD3 in the present study, accumulation of H2O2by overexpression of SOD3 attenuated MMP2 and MMP9, in accordance with its inhibiting influence on cell invasion.
We confirmed that O2•– was decreased and the level of H2O2 was increased in SOD3-overexpressing PC-3 cells because of the action of dismutation of SOD3. It has been demonstrated that SOD2 overexpression inhibits cell growth caused by elevation of H2O2in PC-3 cells and DU145 cells (9, 32). One of the reasons that SOD3 suppressed cell growth in PC-3 cells might by production of H2O2. We performed H2O2 generation assay by means of the conditioned media of PC-3/SOD3 cells due to membrane permeability of H2O2 (33). Here we observed accumulation of H2O2 in the conditioned media of PC-3/SOD3 cells. Increased H2O2is usually eliminated by GSH binding and catalase (18, 34).
However, the GSH/GSSG ratio and catalase activity in PC- 3/SOD3 cells were rather lower than those of PC-3/Entry cells, suggesting that H2O2 produced due to SOD3 overexpression is not eliminated and is therefore accumulated. Furthermore, GSH is known to protect cells against free radicals, and GSH deficiency might stimulate cell death, including apoptosis, in cancer cells (35). SOD3 overexpression may also induce stimulation of cell deathvia
inhibition of GSH. It remains unknown why catalase activity and GSH/GSSG ratio were reduced by SOD3 overexpression.
We are now investigating the mechanisms involved in this.
It was reported that 8-OHdG was highly expressed in cancer tissues in comparison with benign tissue and it has been known to be a DNA oxidative damage marker in cancer cells (36). H2O2treatment of cells resulted in an increase of 8-OHdG level (36, 37). 8-OHdG level was increased in PC- 3/SOD3 cells, suggesting that accumulation of H2O2caused by SOD3 overexpression or SOD3 treatment might induce DNA oxidative damage and cause cell death. Taken together, SOD3 overexpression or recombinant SOD3 treatment might contribute to inhibition of cell proliferation, migration, and invasion.
In conclusion, we revealed the function of SOD3 as a tumor suppressor in PC-3 cells. For the development of a prospective antioxidant therapy, we further need to elucidate functional influences and mechanical pathways of endogenous and exogenous SOD3 in vitroand in vivo.
Conflicts of Interest
None.
Acknowledgements
This work was supported by a Grant-in-Aid for Scientific Research on Priority Areas from the Ministry of Education, Culture, Sport, Science, and Technology of Japan (23390379).
References
1 Shiota M, Yokomizo A and Naito S: Oxidative stress and androgen receptor signaling in the development and progression of castration-resistant prostate cancer. Free Radic Biol Med 51:
1320-1328, 2011.
2 Khandrika L, Kumar B, Koul S, Maroni P and Koul HK:
Oxidative stress in prostate cancer. Cancer Lett 282: 125-136, 2009.
3 Baker AM, Oberley LW and Cohen MB: Expression of antioxidant enzymes in human prostatic adenocarcinoma.
Prostate 32: 229-233, 1997.
4 Suzuki Y, Kondo Y, Himeno S, Nemoto K, Akimoto M and Imura N: Role of antioxidant systems in human androgen- independent prostate cancer cells. Prostate 43: 144-149, 2000.
5 Fattman CL, Schaefer LM and Oury TD: Extracellular superoxide dismutase in biology and medicine. Free Radic Biol Med 35: 236-256, 2003.
6 McCord JM and Edeas MA: SOD, oxidative stress and human pathologies: a brief history and a future vision. Biomed Pharmacother 59: 139-142, 2005.
7 Faraci FM and Didion SP: Vascular protection: superoxide dismutase isoforms in the vessel wall. Arterioscler Thromb Vasc Biol 24: 1367-1373, 2004.
8 Kinnula VL, Paakko P and Soini Y: Antioxidant enzymes and redox regulating thiol proteins in malignancies of human lung.
FEBS Lett 569: 1-6, 2004.
9 Venkataraman S, Jiang X, Weydert C, Zhang Y, Zhang HJ, Goswami PC, Ritchie JM, Oberley LW and Buettner GR:
Manganese superoxide dismutase overexpression inhibits the growth of androgen-independent prostate cancer cells. Oncogene 24: 77-89, 2005.
10 Cairns RA, Harris IS and Mak TW: Regulation of cancer cell metabolism. Nat Rev Cancer 11: 85-95, 2011.
11 Nogueira V and Hay N: Molecular pathways: reactive oxygen species homeostasis in cancer cells and implications for cancer therapy. Clin Cancer Res 19: 4309-4314, 2013.
12 Nozik-Grayck E, Suliman HB and Piantadosi CA: Extracellular superoxide dismutase. Int J Biochem Cell Biol 37: 2466-2471, 2005.
13 Marklund SL: Expression of extracellular superoxide dismutase by human cell lines. Biochem J 266: 213-219, 1990.
14 Chaiswing L, Zhong W, Cullen JJ, Oberley LW and Oberley TD:
Extracellular redox state regulates features associated with prostate cancer cell invasion. Cancer Res 68: 5820-5826, 2008.
15 Shin M, Mizokami A, Kim J, Ofude M, Konaka H, Kadono Y, Kitagawa Y, Miwa S, Kumaki M, Keller ET and Namiki M:
Exogenous SPARC suppresses proliferation and migration of prostate cancer by interacting with integrin beta 1. Prostate 73:
1159-1170, 2013.
16 Beauchamp C and Fridovich I: Superoxide dismutase: improved assays and an assay applicable to acrylamide gels. Anal Biochem 44: 276-287, 1971.
17 Shima T, Mizokami A, Miyagi T, Kawai K, Izumi K, Kumaki M, Ofude M, Zhang J, Keller ET and Namiki M: Down- regulation of calcium/calmodulin-dependent protein kinase kinase 2 by androgen deprivation induces castration-resistant prostate cancer. Prostate 72: 1789-1801, 2012.
18 Zhang HJ, Zhao W, Venkataraman S, Robbins ME, Buettner GR, Kregel KC and Oberley LW: Activation of matrix metalloproteinase-2 by overexpression of manganese superoxide dismutase in human breast cancer MCF-7 cells involves reactive oxygen species. J Biol Chem 277: 20919-20926, 2002.
19 Kumar B, Koul S, Khandrika L, Meacham RB and Koul HK:
Oxidative stress is inherent in prostate cancer cells and is required for aggressive phenotype. Cancer Res 68: 1777-1785, 2008.
20 Storz P: Reactive oxygen species in tumor progression. Front Biosci 10: 1881-1896, 2005.
21 Antunes F and Cadenas E: Estimation of H2O2gradients across biomembranes. FEBS Lett 475: 121-126, 2000.
22 Lim YB, Park TJ and Lim IK: B-Cell translocation gene 2 enhances susceptibility of HeLa cells to doxorubicin-induced oxidative damage. J Biol Chem 283: 33110-33118, 2008.
23 Ray G and Husain SA: Oxidants, antioxidants and carcinogenesis. Indian J Exp Biol 40: 1213-1232, 2002.
24 Zhao Y, Seefeldt T, Chen W, Wang X, Matthees D, Hu Y and Guan X: Effects of glutathione reductase inhibition on cellular thiol redox state and related systems. Arch Biochem Biophys 485: 56-62, 2009.
25 Munoz-Moreno L, Arenas MI, Schally AV, Fernandez-Martinez AB, Zarka E, Gonzalez-Santander M, Carmena MJ, Vacas E, Prieto JC and Bajo AM: Inhibitory effects of antagonists of growth hormone-releasing hormone on growth and invasiveness of PC3 human prostate cancer. Int J Cancer 132: 755-765, 2013.
26 Shariftabrizi A, Khorramizadeh MR, Saadat F, Alimoghadam K, Safavifar F and Ebrahimkhani MR: Concomitant reduction of matrix metalloproteinase-2 secretion and intracellular reactive
oxygen species following anti-sense inhibition of telomerase activity in PC-3 prostate carcinoma cells. Mol Cell Biochem 273: 109-116, 2005.
27 Belkhiri A, Richards C, Whaley M, McQueen SA and Orr FW:
Increased expression of activated matrix metalloproteinase-2 by human endothelial cells after sublethal H2O2 exposure. Lab Invest 77: 533-539, 1997.
28 Nelson KK, Ranganathan AC, Mansouri J, Rodriguez AM, Providence KM, Rutter JL, Pumiglia K, Bennett JA and Melendez JA: Elevated SOD2 activity augments matrix metalloproteinase expression: evidence for the involvement of endogenous hydrogen peroxide in regulating metastasis. Clin Cancer Res 9: 424-432, 2003.
29 Das TP, Suman S and Damodaran C: Reactive oxygen species generation inhibits epithelial–mesenchymal transition and promotes growth arrest in prostate cancer cells. Mol Carcinog 2013.
30 Trachootham D, Alexandre J and Huang P: Targeting cancer cells by ROS-mediated mechanisms: a radical therapeutic approach? Nat Rev Drug Discov 8: 579-591, 2009.
31 Ganguly K, Kundu P, Banerjee A, Reiter RJ and Swarnakar S:
Hydrogen peroxide-mediated down-regulation of matrix metalloprotease-2 in indomethacin-induced acute gastric ulceration is blocked by melatonin and other antioxidants. Free Radic Biol Med 41: 911-925, 2006.
32 Li N, Zhai Y and Oberley TD: Two distinct mechanisms for inhibition of cell growth in human prostate carcinoma cells with antioxidant enzyme imbalance. Free Radic Biol Med 26: 1554- 1568, 1999.
33 Wagner BA, Evig CB, Reszka KJ, Buettner GR and Burns CP:
Doxorubicin increases intracellular hydrogen peroxide in PC3 prostate cancer cells. Arch Biochem Biophys 440: 181-190, 2005.
34 Buettner GR: Superoxide dismutase in redox biology: the roles of superoxide and hydrogen peroxide. Anticancer A gents Med Chem 11: 341-346, 2011.
35 Ortega AL, Mena S and Estrela JM: Glutathione in cancer cell death. Cancers 3: 1285-1310, 2011.
36 Kanwal R, Pandey M, Bhaskaran N, Maclennan GT, Fu P, Ponsky LE and Gupta S: Protection against oxidative DNA damage and stress in human prostate by glutathione S- transferase P1. Mol Carcinog 53: 8-18, 2014.
37 Zunino A, Degan P, Vigo T and Abbondandolo A: Hydrogen peroxide: effects on DNA, chromosomes, cell cycle and apoptosis induction in Fanconi’s anemia cell lines. Mutagenesis 16: 283-288, 2001.
Received March 23, 2014 Revised April 21, 2014 Accepted April 22, 2014