Developments of the Manuacturer's Sales Company System in
Hiroaki Seto
Summary
This paper rakes up a little history of the manufacture's sales com-.
pany (being abbreviated to MSC) system in Japan based on statistical data.
The proportion of MSC in all the manufacturing firms with capital stocks of $0 325 million or more is 0 12. In 126 manufacturing sec- torsin Input-Output Tables of Japan (1970) MSC exist. The weight of MSC in final demand is 0 21.
Three stages of economic growth in Japan after World War I1 a r e also stages of MSC.
I
Developments of the manufacturer's sales company system a r e fol- (1)
lowed by a survey conducted by the author. Subjects of this survey a r e all the manufacturing firms with capital stock of $0 325 million (of -
( 2 )
100 million yens) or more.
* I a m grateful to Professor Hitoshi Kimura and Assistant Professor Ka-.
zuo Oyabu, Kagawa University, for their helpful comments.
(1) This system will be defined in Section 3
( 2 ) Numbers and r a t e s of manufacturing firms which own MSC a r e '
determined a s follows :
Classifications of stratum, industry and scale of MSC a r e defined a s follows: a sales company incorporated by a manufacturing firm with its own capital for the purpose that the latter sells its products through the former in the domestic market.
Strata
1 Sole MSC exclusively dealing with all or almost all products manu- factured by its parent company or by the division of its parent com- pany.
2 Local (territorial) MSC covering the national market, though each of them covers a prefecture or a smaller area than it.
Industrzes
1 Foods and Drinks 2 Textile fibres and related 3 Pulp &
Paper 4 Chemicals 5 Ceramics, Stone & Clay 6 Iron & Steel 7 Nonferrous Metals 8 Fabricated Metals 9 Machinery 10 Electrical ~ a c h i b e r y 11 Transport Equipment (machinery) 12 Others (including precision Instruments and Petroleum) Scales (capital stocks) millions
( 3 )
A $0 325 - $3 247 (Y100 - Y1,000) B $3 247 - $16 234 (Y 1,000 - Y 5,000) C $16 234 or more (Y5,000 or more)
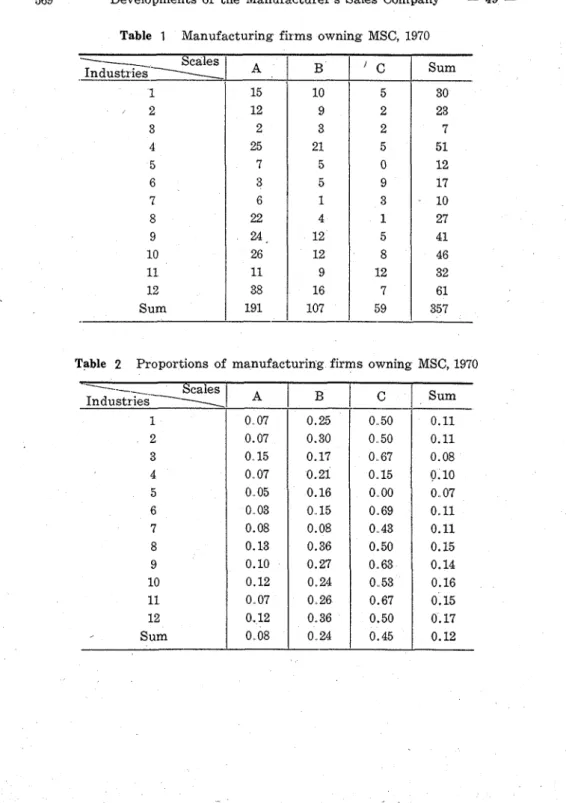
Table 1 shows numbers of manufacturing firms which own MSC and Table 2 shows rates of these. The rate in Scale C is greatest. The pro- portions of three scales, A, B and C a r e 0 08, 0 24 and 0 45. The proportion of the sum total is 0 12.
All the manufacturing firms with capital stock of $0.325 million or more surveyed by mail in 1971 The proportion of response is 0 9754 (2969/3044)
' ( 3 ) Our exchange rate ($1=Y308 0) come from par values or central
rates in the "IMF, IFS, April 1972 "
569 Developments of the Manufacturer's Sales Company - 49 -
Table 1 Manufacturing firms owning MSC, 1970
Table 2 Proportions of manufacturing firms owning MSC, 1970 - - - - Scales
Industr les \
--
1 2 3 4 5 6 7 8 9 10 11 12 Sum
A 15 12 2 25 7 3 6 22 2 4 , 26 11 38 191
---- cales
Industr~i-<
1 2 3 4 5 6 7 8 9 10 11 12 Sum
c 1 Sum
B 10 9 3 21 5 5 1 4 12 12 9 16
--- 107
A 0 07 0.07 0 15 0 07 0 05 0 03 0.08 0.13 0.10 0.12 0 07 0.12 0 08
0 50 0 50 0 67 0 15 0 00 0 69 0 43 0.50 0.63 0 53 0.67 0.50 0.45 B
0.25 0.30 0.17 0.21 0.16 0 15 0.08 0.36 0.27 0.24 0-26 0.36 0 24
----
0.11 0.11 0.08 0.10 0 07 0. 11 0.11 0.15 0.14 0.16 0.15 0.17 0.12
' C
5 2 2 5 0 9 3 1 5 8 12 7 59
Sum -
30
23
7
51
12
17
10
27
41
46
32
61
357
I1
( 4 )
Weights of MSC in the Japanese economy will be shown by the data : (1) proportions of sales of MSC in sectors (valued a t producers' price)
(2) proportions of sales of MSC in final demand sectors.
It is, however, natural that proportions should be accompanied by the sales of MSC valued a t producers' price. This is shown by Table 3. The sales of all MSC total the sum of $19,795 millions. Sectors and their sales a r e the following. Motor vehiclg $8,672 millions, Electrical ap- pliances for home use 4,431, Iron and Steel 1,484, Toilet preparations and dentifrice 667, Confectionery 352, Petroleum refinery products 315, Tire and tube 254, Paper 245, Sash 243, Drinking milk and dairy prod- ucts 211, General machine parts (Bearing etc.) 199, Synthetic detergent 170, Agricultural machinery 163, Camera 162, Prepared feeds for ani- mal and poultry 156, Knitted fabric (Nylon stocking etc.) 100 and so on. The proportion of Motor vehicle and Electrical appliances for home use equals 0 66. The proportion from No. 1 to No. 10 equals 0 86.
Table 4 shows the proportions of sales of MSC in their sectors. Mo- tor vehicle 0 85, Electrical appliances for home use 0 83, Toilet prep- arations and dentifrice 0 77, Camera 0 68, Sewing machine 0 59, Tire and Tube 0 41, Sash 0 40, Synthetic detergent 0 38, BicycIe and rear car 0 26, Photographic sensitive materials 0 25, Agricultural machiner- y 0 21, Rubber footwear 0 20, Confectionery 0 20 and so on. All firms in the highest three sectors have MSC. In the sectors of Sewing ma- chine, Sash and Synthetic detergent, their competitors have no MSC in
( 4 ) The data of MSC given in this section and the next section were
gained by a survey t o all the manufacturing firms owning MSC
conducted by mail or interview from 1971 to 1975 The proportion of
response is 0 91
571 Developments of the Manufacturer's Sales Company - 51 - 1970. Most of f i r m s in t h e sector of Sash, however, possess MSC in 1975.
Table 3 Sales of MSC (valued a t Producers' price), 1970 Number of Manufac- Sectors 1 % millions / M S C turing firms owning
15 9 15 5 4 5 4 3 9 8 14 5 6 6 7 6 5 4 7 4 6 6 3 9 3 7 6 4 172 357 1 Motor vehicle
2 Electrical appliances for home use 3. Iron a n d Steel
4 Toilet preparations a n d dentifrice 5 Confectionery
6 Petroleum refinery products 7 Tire a n d t u b e
8 Paper
9 Sash (of aluminium or steel) 10 Drinking milk a n d dairy products 11 General machine parts(Bearing and
so on)
12 Soap (synthetic detergent) a n d surface active agents
13 Agricultural machinery 14 Camera
15 Prepared feeds for animal and poultry
16 Knitted fabric (Nylon stockings) 17 Ther mo-setting plastic
18. Office machinery (Copying machinery)
19 Metallic furniture a n d fixtures 20 Medicinal preparations
21 Photographic sensitive materials 22 Mining a n d construction machinery
(Construction Machinery) 23 Sewing machine
23. Rubber footwear 25 Watch a n d clock 26 Machine tools 27. Bicycle a n d rear car 28 Writing goods 29 Others
Total
8,672
4,431
1,484
667
352
315
254
245
243
211
199
170
163
162
156
100
97
96
90
89
87
86
71
71
56
54
43
40
1,091
19,795
Table 4 Proportions of sales of MSC in the sectors, greater than 0 1, 1970
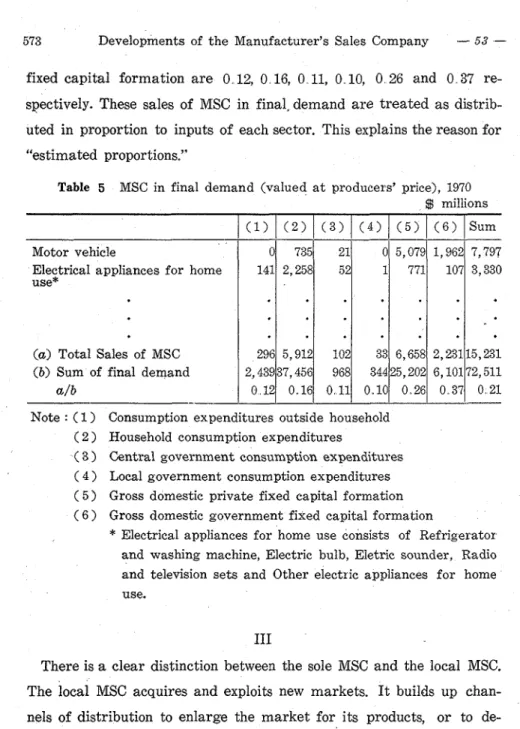
Table 5 shows the weights of MSC in the final demand sectors in
( 5 )
1970 Input-Output Tables of Japan. The proportion of sales of MSC
Sectors I Proportion
(valued a t producers' price) in final demand is 0 21. The estimated 1 Motor vehicle
2. Electrical appliances for home use 3 Toilet preparations and dentifrice 4. Camera
5 Sewing machine 6 Tire and tube
7 Sash (of aluminium or steel)
8. Soap (synthetic detergent) and surface active agents 9. Bicycle and rear car
10. Photographic sensitive materials 11. Agricultural machinery
12. Rubber footwear 13. Confectionery
14. Thermo-setting plastic
15 Office machinery (Copying machinery) 16 Iron and Steel
17 Drinking milk and dairy products 18 Watch and clock
19 Writing goods 20. Paper
21. Metallic furniture and fixtures
22. Prepared feeds for animal and poultry
I
proportions of MSC in Consumption expenditures outside household, 0 85 0 83 0.77 0.68 0.59 0.41
f 0.40 0.38 0.26 0.25 0.21 0.20 0.20 0.17 0.17 0 15 0.13 0.13 0 13 0.12 0.10 0.10
Household consumption expenditures, Central government consumption expenditures, Local government consumption expenditures, Gross do- mestic private fixed capital formation and Gross domestic government
1
( 5 ) 1970 Input-Output Tables Government of Japan, January 1974.
573 Developments of the Manufacturer's Sales Company - 53 -
fixed capital formation are 0.12, 0 16, 0 11, 0 10, 0 26 and 0 37 re- spectively. These sales of MSC in final" demand are treated a s distrib- uted in proportion to inputs of each sector. This explains the reason for
"estimated proportions.''
Table 5 MSC in final demand (valued a t producers' price), 1970 d millions
Note : ( 1 ) Consumption expenditures outside household ( 2 ) Household consumption expenditures
( 3 ) Central government consumption expenditures ( 4 ) Local government consumption expenditures ( 5 3 Gross domestic private fixed capital formation ( 6 ) Gross domestic government fixed capital formation
* Electrical appliances for home use consists of Refrigerator and washing machine, Electric bulb, Eletric sounder, Radio and television sets and Other electric appliances for home use.
- -
Motor vehicle
Electrical appliances for home use*
( a ) Total Sales of MSC (b) Sum of final demand
alb
I11
There is a clear distinction between the sole MSC a n d the local MSC.
The local MSC acquires a n d exploits new markets. It builds up chan- nels of distribution to enlarge the m a r k e t for its products, o r to de- fend its m a r k e t against competitors. Struggles for markets a m o n g manufacturing firms, which means struggles for the paths of distribu
( 1 ) 0 141
296 012
( 2 ) 735 2,258
5,912 2,43937,456 016
( 3 ) 21 52
102 968 0 1 1
(4) 0 1
33 344 010
( 5 ) 5,079
771
6,658 25,202 0-26
( 6 ) 1,962
107
6,101 037
Sum 7,797 3,330
2,23115,231
72,511
0 2 1
tion to retailers that were cleared by dealers, produce the local MSC.
In many cases capitals of manyfacturing firms and of dealers a r e in- corporated into MSC.
The sole MSC has a double function to perform for its parent man- ufacturing firm: as sales agent and as financier. I t sells or markets manufactured products a s the former, while buys them from its parent on its own account as the latter.
The dominance of manufacturing firms in distribution process leads to select channels of distribution, which necessarily results in the ex- clusion of wholesaling firms. This exclusion counterbalances the fi- nancial advantage resulting from wholesaling firms' activities as financier. If manufacturing firms can exclude wholesaling firms with- out offsetting this advantage, it is preferable for them. The role is allotted to the sole MSC.
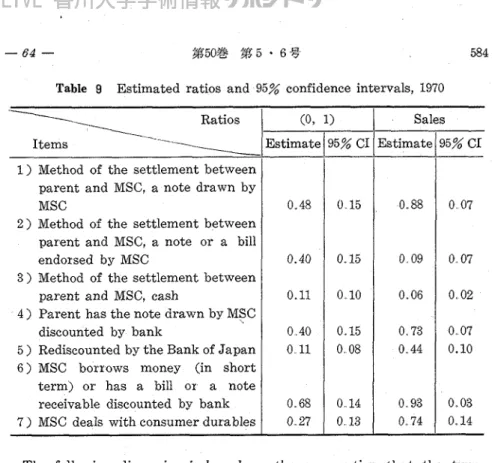
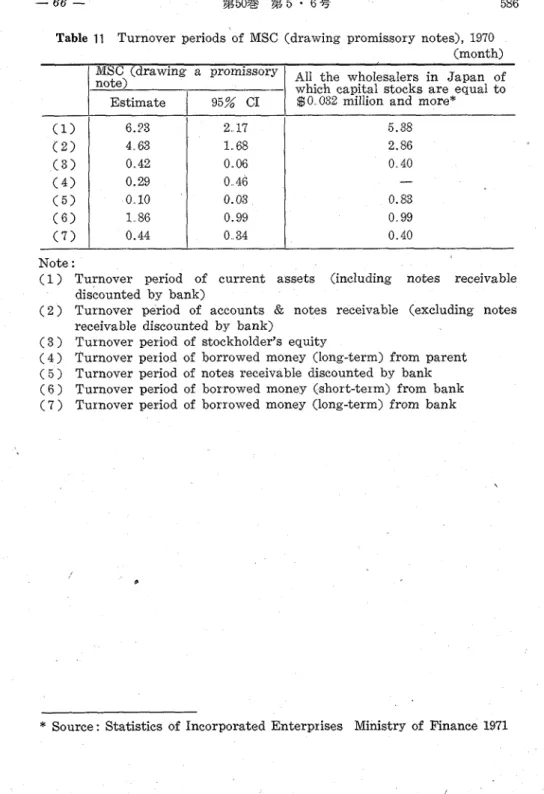
My sample survey shows that 48% (88% in sales weight) of manu- (6)
facturing firms on sole MSC can shorten the turnover period of its own capital put into the production process by 2 23 months in 1970.
The parent manufacturing firms can reach the ordinary level of turn- over, only if the sole MSC exist.
By "MSC system" I mean the channels of distribution which manu- facturing firms marketed their products through MSC. In narrow sense, however, by "MSC system" I mean the channels of distribution which manufacturing firms marketed their products through MSC to which the role a s financier is allotted.
Three stages of economic growth in Japan a r e also the stages of MSC system: the preliminary stage (1945-1955), the primary stage
( 6 ) My sample survey was conducted f o r the period from 1971 to 1972.
See Appendix to this article.
575 Developments oP the Manufacturer's Sales Company - 55 - (1959-1965) and the secondary stage (1966-1974). Three years from 1956 to 1958 a r e in the transition stage. A figure faithfully reflects the above partition. In Figure 1 annual sales of a manufacturing firm, the leader in the Motor vehicle sector, a r e plotted from 1949 to 1974.
The Motor vehicle sector have led the Japanese economy to a growing one together with the sector of Electrical appliances for home use.
Slopes of the plotted date in three stages differ sharply each other.
Before World War I1 there were few MSC in Japan. Let us trace back through successive stages of development of MSC after World War 11.
Preliminary stage (1945-1955)
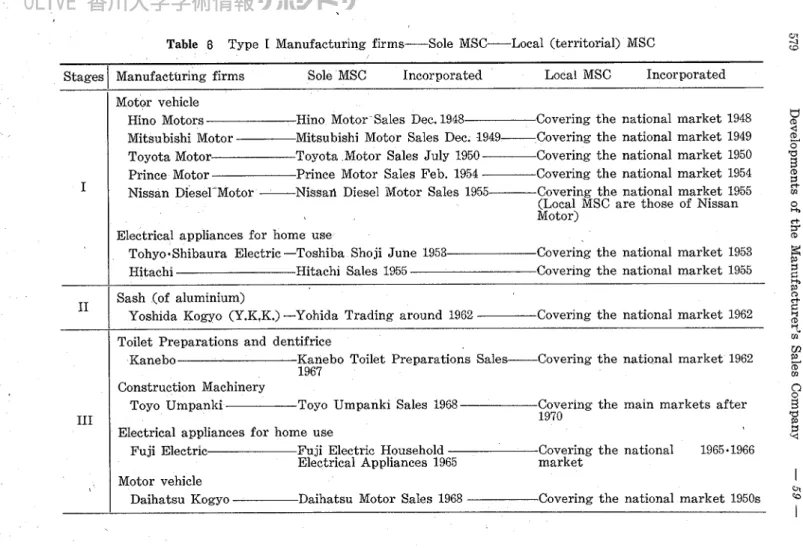
The MSC system in the Japanese economy owed its development to the successful systems in the Motor vehicle sector, the Electrical ap- pliances for home use sector and the Toilet preparations and denti- frice sector. The successful systems in the former two a r e in narrow sense of the MSG system. Before 1950 three manufacturing firms in the sector of Motor vehicle owned MSC. But Toyota Motor Sales Which emerged in 1950 embodied the concept of MSC system in narrow sense in itself.
In 1950 Toyota Motor Sales (TMS) was incorporated for the purpose
of reconstruction of Toyota Motor (TM). The settlement - of trans-
action between TM and TMS is done as follows: On the one hand TM
draws a, bill of exchange which is receive'd by TM itself and which is
accepted by TMS and will be settled after two months. The former is
used to have this bill discounted by bank. The bank which has dis-
counted i t is able to have this bill rediscounted by The Bank of Japan,
if necessary. On the other hand TMS borrows money from bank on
,
54 billion
4-
installment papers drawn by consumers and the bank which lent out money to TMS borrows money on the promissory note, which is drawn by TMS, from The Bank of Japan. TMS settles the above bill with this money a t maturity.
The Bank of Japan hesitated to establish such a mechanism of settlement from the standpoint of the Central Bank in this stage. But it can be said that this resulted in success. This experience was dis.
persed thereafter.
477 Developments of the Manufacturer's Sales Company - 5 7 - Shiseido, the leader in the sector of Toilet preparations and denti- frice, reconstructed the local MSC system from 1945 to 1950 (Table 8). (7)
In 1953 Tokyo-Shibaura Electric incorporated Toshiba Trading for electrical appliances for home use and Hitachi incorporated Hitachi Sales in 1955.
In the sector of Tire and tube intimately related with the sector of Motor vehicle, the capital of the leading manufacturing firm began to be incorporated into local MSC with dealers' capital from 1953 (Table 8).
Transition stage (1956-1958)
Three years from 1956 to 1958 a r e said to be the transition stage in the development from the preliminary stage to the primary stage. At this stage Matsushita Electric Industrial covered the national market by the local MSC system.
The leader in the sector of Tire and tube completed the local MSC system covering the national market. Boom and depression change places a t an interval of one year in this stage. By these local MSC sys- tem the manufacturing firms can cover the national market through the channels of distribution, which were formed by dealers.
Primary stage (1959-1965)
In this stage two cases mark a remarkable contrast: ( 1 ) sectors which cover the national market by the local MSC system and ( 2 ) sectors which incorporate sole MSC in narrow sense.
The sectors of Tire and tube, agricultural machinery, Bearing, -
( 7 ) Shiseido constructed the local MSC system before World War U.
Rubber footwear and Bicycle have no sole MSC, but have local MSC which a r e incorporated with manufacturing firms and dealers' capitals.
These sectors established the local MSC system for the period from 1960 to 1965. The former three cover the national market by the local MSC system (Table 8). Struggles for markets among manufacturing firms produce local MSC. In many cases capitals of manufacturing firms and dealers a r e incorporated into MSC.
Products with which local MSC deal in the sectors of Tire and tube, Bearing and Storage battery (in secondary stage) a r e for replacement.
Sole MSC were incorporated in the sectors of Sash, Construction ma- chinery, Prepared feeds for animal and poultry and so on (Table 7).
The MSC systems in the sectors of the former three belong to narrow sense.
Secondary stage (1966-the depression of 1974)
Networks of local MSC have been spread over the national market by a manufacturing firm in the Bearing sector and by a firm, the leader in the sector of synthetic detergent. Local MSC were also in- corporated in the sectors of Storage battery for the motor vehicle and of Mettalic furnitures and fixturers.
I t is characteristic of MSC a t this stage that big manufacturing firms in the sectors of Petroleum, Paper, Motor vehicle and Electrical appliances for home use incorporated sole MSC to which the role as financier is allotted.
The sole MSC in the sector of Petroleum is a joint MSC incorporat-
ed by three manufacturing capitals. This incorporation is based on the
energy policies of Government of Japan. Ministry of International
Trade and Industry directed i t (Table 7).
Table 6 Type I Manufacturing firms-Sole MSG--Local (territorial) MSC
Stages I Manufacthnng firms Sole MSC Incorporated Local MSC Incorporated
I Motor vehicle
I Hino Motors Hino Motor Sales Dec. 1948 Covering t h e national market 1948
( Mitsubishi Motor Mitsubishi Motor Sales Dec. 1949-Covering the national market 1949 Toyota Motor Toyota Motor Sales July 1950- Covering t h e national market 1950 Prince Motor Prince Motor Sales Feb. 1954 - Covering t h e national market 1954
--