The Cosmic Wheel and the Legacy of the AKARI archive: from galaxies and stars to planets and life 123
O17 - 4 L. V. Toth et al.
Table 2. TheN(H)MWGalactic foreground hydrogen column density; theN(H)GRBintrinsic column density (from Swift XRT spectral fit); and theχ2of the XRT fit for various estimates of the foreground.
HPBW N(H)MW N(H)GRB χ2 [arcmin] [1020cm−2] [1020cm−2] AKARI (calibrated with Planck PR1) 2 4.9 565.2631.5502.6 804.5 AKARI (calibrated with Planck PR2 DL) 2 10.8 538.8605.0476.3 804.3 AKARI (calibrated with Planck PR2 RQ) 2 5.4 563.3629.6500.7 804.5 Smoothed AKARI (calibrated with Planck PR1) 5 4.3 568.2634.4505.5 804.5 Smoothed AKARI (calibrated with Planck PR2 DL) 5 9.5 544.7610.9482.2 804.4 Smoothed AKARI (calibrated with Planck PR2 RQ) 5 4.6 566.6632.8503.9 804.5
Planck PR1 5 4.3 568.1634.4505.5 804.5
Planck PR2 DL 5 9.9 543.0609.2480.4 804.4
Planck PR2 RQ 5 4.7 566.1632.4503.5 804.5
Smoothed Planck PR1 36 4.4 567.5633.8504.9 804.5
Smoothed Planck PR2 DL 36 9.9 542.7608.9480.2 804.5
Smoothed Planck PR2 RQ 36 4.9 565.5631.8502.9 804.5
LAB (from observation) 36 4.0 569.6635.7506.9 804.5
UKSSDC NH (based on LAB) 36 4.5 567.1633.4504.5 804.5
EBHIS 10.8 3.9 569.7636.1507.1 804.5
SFD 7-14 4.1 569.2635.5506.5 804.5
ACKNOWLEDGMENTS
This work was supported by the OTKA NN-111016 grant; the NAOJ ALMA Scientific Research Grant Number 2016-03B; and the Hungarian New National Excellence Program of the Ministry of Human Capacities (TK and IR).
Based on observations with AKARI, a JAXA project with the participation of ESA, and observations obtained with Planck (http://www.esa.int/Planck), an ESA science mission with instruments and contributions directly funded by ESA Member States, NASA, and Canada. This research has made use of the VizieR catalogue access tool, CDS, Strasbourg, France;
and of the data supplied by the UK Swift Science Data Centre at the University of Leicester, and the SIMBAD database, operated at CDS, Strasbourg, France.
REFERENCES
Arnaud, K. A. 1996, in ASP Conf. Ser., Vol. 101, ADASS V, ed. G. H. Jacoby & J. Barnes, 17 Balázs, L. G., Bagoly, Z., Hakkila, J. E., et al. 2015, MNRAS, 452, 2236
Boër, M., Gendre, B., & Stratta, G. 2015, ApJ, 800, 16
Cameron, P. B. & Frail, D. A. 2005, GRB Coordinates Network, 4154 Doi, Y., Takita, S., Ootsubo, T., et al. 2015, PASJ, 67, 50
Elíasdóttir, Á., Fynbo, J. P. U., Hjorth, J., et al. 2009, ApJ, 697, 1725 Fynbo, J. P. U., Jakobsson, P., Prochaska, J. X., et al. 2009, ApJS, 185, 526 Goldstein, A., Veres, P., Burns, E., et al. 2017, ApJL, 848, L14
Horváth, I. 2009, Ap&SS, 323, 83
Horváth, I. & Tóth, B. G. 2016, Ap&SS, 361, 155
Kalberla, P. M. W., Burton, W. B., Hartmann, D., et al. 2005, A&A, 440, 775
Kerp, J., Winkel, B., Ben Bekhti, N., Flöer, L., & Kalberla, P. M. W. 2011, Astronomische Nachrichten, 332, 637 Kouveliotou, C., Meegan, C. A., Fishman, G. J., et al. 1993, ApJL, 413, L101
Murakami, H., Baba, H., Barthel, P., et al. 2007, PASJ, 59, S369 Nakagawa, T., Enya, K., Hirabayashi, M., et al. 2007, PASJ, 59, S377 Planck Collaboration, Abergel, A., Ade, P. A. R., et al. 2014, A&A, 571, A11 Planck Collaboration, Ade, P. A. R., Aghanim, N., et al. 2016, A&A, 586, A132 Schlafly, E. F. & Finkbeiner, D. P. 2011, ApJ, 737, 103
Stanek, K. Z., Matheson, T., Garnavich, P. M., et al. 2003, ApJL, 591, L17
Toth, L. V., Doi, Y., Zahorecz, S., et al. 2017, Publication of Korean Astronomical Society, 32, 113
A look at possible microwave dust emission via AKARI infrared all-sky surveys
Aaron C. Bell,1Takashi Onaka,1Yasuo Doi,2Frédéric Galliano,3Ronin Wu,4Hidehiro Kaneda,5 Daisuke Ishihara,5and Martin Giard6
1Graduate School of Science, The University of Tokyo, Bunkyo-ku, 113-0033, Tokyo, Japan
2Department of Earth Science and Astronomy, The University of Tokyo, 3-8-1 Komaba, Meguro-ku, Tokyo 153-8902, Japan 3Service d’Astrophysique, CEA/Saclay, L’Orme des Merisiers, 91191 Gif-sur-Yvette, France
4LERMA, Observatoire de Paris, PSL Research University, CNRS, Sorbonne Université, UPMC Paris 06, 92190, Meudon, France 5Nagoya University, Furo-cho, Chikusa-ku, Nagoya 464-8602, Japan
6Université de Toulouse, UPS-CNRS, IRAP, 31028, Toulouse Cedex 4, France
ABSTRACT
The anomalous microwave emission (AME) still lacks a conclusive explanation. This excess of emission, roughly between 10 and 50 GHz, correlates spatially with interstellar dust, prompting a “spinning dust” hypothesis: electric dipole emission by rapidly rotating, small dust grains. The typical peak frequency range of the AME profile implicates grains on the order of ~1 nm, suggesting polycyclic aromatic hydrocarbon molecules (PAHs). We compare AKARI/Infrared Camera (IRC), with its thorough PAH-band coverage, to AME intensity estimates from the Planck Collaboration, in theλOrionis region. We look also at infrared dust emission from other mid IR and far-IR bands. The results and discussion contained here apply to an angular scale of approximately 1◦. In general, our results support an AME-from-dust hypothesis. In λOrionis, we find that certainly dust mass correlates with AME, and that PAH-related emission in the AKARI/IRC 9µm band may correlate slightly more strongly.
Keywords: ISM
1. INTRODUCTION
In our efforts to decompose and understand galactic microwave emission itself, there remains a constant antagonist.
Galactic foregrounds had been broken down into three dominant components: free-free emission from ionized regions, synchrotron emission generated by electrons relativistically by the Milky Way’s magnetic field, and the microwave extent of thermal dust emission (Planck Collaboration et al. 2014). Deviations from this understanding began to appear in the early 1990s, with efforts byKogut et al.(1996) andLeitch et al.(1997) to carefully investigate the CMB. They had found a component of the microwave sky which implied unlikely spectral indices for free-free or synchrotron emission. This
“anomalous microwave emission” (AME) generally takes the form of an ‘excess’ continnuum emission source, having a peak somewhere between 10 to 40 GHz. This excess defies predictions for known microwave emission mechansisms.
AME still lacks a concrete physical explanation.
AME has been found to be a widespread feature of the microwave Milky Way (see the reviewDickinson et al. 2013, and an updated state-of-play of AME research by Dickinson et al. in prep). Kogut et al.(1996) andde Oliveira-Costa et al.
(1997) showed that the AME correlates very well with infrared emission from dust, via COBE/DIRBE and IRAS far-IR maps. More recent works, employing the latest IR to microwave all-sky maps, and various ground based radio observations have strongly confirmed a relationship between interstellar dust emission and AME (Ysard & Verstraete 2010;Tibbs et al.
2011;Hensley et al. 2016).
From the observed spatial correlation between AME and dust emerged two prevailing hypotheses:
1) Electric dipole emission by spinning small dust grains or polycyclic aromatic hydrocarbons (PAHs). 2) Magnetic dipole emission, caused by thermal fluctuations in grains with magnetic inclusions, proposed byDraine & Lazarian(1999).
We explore the case that the AME signature arises from spinning dust emission. If the AME is carried by spinning dust, the carrier should be small enough that it can be rotationally excited to frequencies in the range of 10-40 GHz, and must have a permanent electric dipole. Assuming the rotational emission model ofDraine & Lazarian(1998), the
Corresponding author: Aaron C. Bell [email protected]
This document is provided by JAXA.
JAXA Special Publication JAXA-SP-17-009E 124
O18 - 2 A. C. Bell et al.
AME signature (consistent with peaked, continuum emission having a peak between 15 and 50 GHz ) implies very small oscillators (~1 nm). Polycyclic aromatic hydrocarbon family of molecules (PAHs), or nanoscale amorphous carbon dust fit the size criteria. WhileHensley & Draine(2017) claim that AME might also be explained by spinning nanosilicates, only PAHs show both: 1) Evidence of abundance in the ISM at IR wavelengths, (Giard et al. 1994;Onaka 2000), and 2) A predicted range of dipole moments (on order of 1 debye), to produce the observed AME signature (Draine & Lazarian 1998).
TheλOrionis molecular ring, also known as the Meissa Ring, has been strongly highlighted byPlanck Collaboration et al.(2016) for significant AME, and a prime target for testing the spinning PAH hypothesis. The ring contains an HII
region, ionized byλOri itself and its OB associates (Ochsendorf et al. 2015). At approx. 10◦wide, we can see the outline of the structure even in the low (1◦FWHM) resolution PCAME map.
2. ANALYSIS
We have carried out an initial comparison of the AME ofλOrionis in mid to far-IR dust emission. The region is shown in Figure1as it appears in 1◦-smoothed A9 data.
Figure 1. Left: λOrionis as it appears in the AKARI 9µm data. Contours indicate the AME, as given by the Planck PR2 AME map.
The image is smoothed to a 1◦PSF (much larger than the original 10). TheλOrionis star itself is approximately located at the center of the image. Right: TheλOrionis region in the A9 band at near-native resolution. This is a mosaic created from the 3x3 degree all-sky survey tiles by Ishirara et al. (in prep.) Betelgeuse, in the lower left of the image, is bright enough in this band to produce a ring-shaped artifact.
The ring structure itself indicates excess microwave emission attributed to AME. We use 12 photometric all-sky maps.
This includes the two IRC bands (A9 and A18) as well as MIR to FIR data from IRAS (I12, I25, I60 and I100), Planck (P545 and P857), and AKARI/FIS (A65, A90, A140, A160). For the IRC data, we produce mosiacs ofλOrionis from the individual tiles provided in the internal all-sky archive.
Other data are obtained via HEALPix maps. We employ thehealpix2wcsfunctionality provided in thegnomdrizz python package. A9 and A18 images are produced by regridding the images with theMontagesoftware by NASA/IPAC.
Figure1shows a high resolution mosaic of the A9 data before processing.
We apply a pixel mask to the data, to account for outliers and systematic errors in each band. This consists of a point-source mask (mostly due to point source contaimination in the MIR bands), and a “missing stripe error” mask (mostly affecting the AKARI FIS data) mask. The data are smoothed to a common approximately circular Guassian PSF with FWHM 1◦, in order to have a resolution approximating that of the PC AME data.
We estimate an average, flat background level for this region. The background level is determined the mean of pixels in an ‘OFF’ zone. The final images are shown in Figure2, with the full mask applied (masked pixels are indicated in white), and with the OFF zone indicated by the red rectangle on each frame.
We do not expect simple band-by-band intensity correlation tests with the AME to be sensitive to background and foreground emission along the line of sight towards theλOrionis region.
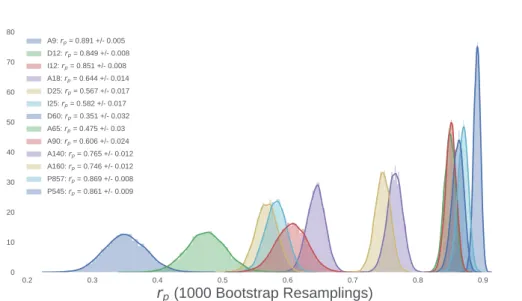
We perform a Bootstrap test of the correlations between the AME and the various IR bands used in this study, to evaluate which dust emisison wavelengths correlate best with AME.
To assess the robustness of the correlation scores, we employ the Bootstrap re-sampling approach, first introduced byEfron(1979). This involves creating random re-sampled sets of the data. We use the ‘with replacement’ approach, meaning that a data point may be selected multiple times in a single re-sampling iteration. The size of the re-sampled set is the same is the input set size. For each random set we run a correlation test, resulting in a distribution of correlation coefficients. This provides an estimate of the error bars for the correlation scores, and serves to de-weight outliers. We carry out bootstrap correlation tests for each IR band’s intensity vs. AME intensity. The data are resampled 1000 times for each test. The distributions of the boostrap resamplings are shown in Figure3.
This document is provided by JAXA.
The Cosmic Wheel and the Legacy of the AKARI archive: from galaxies and stars to planets and life 125
O18 - 2 A. C. Bell et al.
AME signature (consistent with peaked, continuum emission having a peak between 15 and 50 GHz ) implies very small oscillators (~1 nm). Polycyclic aromatic hydrocarbon family of molecules (PAHs), or nanoscale amorphous carbon dust fit the size criteria. WhileHensley & Draine(2017) claim that AME might also be explained by spinning nanosilicates, only PAHs show both: 1) Evidence of abundance in the ISM at IR wavelengths, (Giard et al. 1994;Onaka 2000), and 2) A predicted range of dipole moments (on order of 1 debye), to produce the observed AME signature (Draine & Lazarian 1998).
TheλOrionis molecular ring, also known as the Meissa Ring, has been strongly highlighted byPlanck Collaboration et al.(2016) for significant AME, and a prime target for testing the spinning PAH hypothesis. The ring contains an HII
region, ionized byλOri itself and its OB associates (Ochsendorf et al. 2015). At approx. 10◦wide, we can see the outline of the structure even in the low (1◦FWHM) resolution PCAME map.
2. ANALYSIS
We have carried out an initial comparison of the AME ofλOrionis in mid to far-IR dust emission. The region is shown in Figure1as it appears in 1◦-smoothed A9 data.
Figure 1. Left: λOrionis as it appears in the AKARI 9µm data. Contours indicate the AME, as given by the Planck PR2 AME map.
The image is smoothed to a 1◦PSF (much larger than the original 10). TheλOrionis star itself is approximately located at the center of the image. Right: TheλOrionis region in the A9 band at near-native resolution. This is a mosaic created from the 3x3 degree all-sky survey tiles by Ishirara et al. (in prep.) Betelgeuse, in the lower left of the image, is bright enough in this band to produce a ring-shaped artifact.
The ring structure itself indicates excess microwave emission attributed to AME. We use 12 photometric all-sky maps.
This includes the two IRC bands (A9 and A18) as well as MIR to FIR data from IRAS (I12, I25, I60 and I100), Planck (P545 and P857), and AKARI/FIS (A65, A90, A140, A160). For the IRC data, we produce mosiacs ofλOrionis from the individual tiles provided in the internal all-sky archive.
Other data are obtained via HEALPix maps. We employ thehealpix2wcsfunctionality provided in thegnomdrizz python package. A9 and A18 images are produced by regridding the images with theMontagesoftware by NASA/IPAC.
Figure1shows a high resolution mosaic of the A9 data before processing.
We apply a pixel mask to the data, to account for outliers and systematic errors in each band. This consists of a point-source mask (mostly due to point source contaimination in the MIR bands), and a “missing stripe error” mask (mostly affecting the AKARI FIS data) mask. The data are smoothed to a common approximately circular Guassian PSF with FWHM 1◦, in order to have a resolution approximating that of the PC AME data.
We estimate an average, flat background level for this region. The background level is determined the mean of pixels in an ‘OFF’ zone. The final images are shown in Figure2, with the full mask applied (masked pixels are indicated in white), and with the OFF zone indicated by the red rectangle on each frame.
We do not expect simple band-by-band intensity correlation tests with the AME to be sensitive to background and foreground emission along the line of sight towards theλOrionis region.
We perform a Bootstrap test of the correlations between the AME and the various IR bands used in this study, to evaluate which dust emisison wavelengths correlate best with AME.
To assess the robustness of the correlation scores, we employ the Bootstrap re-sampling approach, first introduced byEfron(1979). This involves creating random re-sampled sets of the data. We use the ‘with replacement’ approach, meaning that a data point may be selected multiple times in a single re-sampling iteration. The size of the re-sampled set is the same is the input set size. For each random set we run a correlation test, resulting in a distribution of correlation coefficients. This provides an estimate of the error bars for the correlation scores, and serves to de-weight outliers. We carry out bootstrap correlation tests for each IR band’s intensity vs. AME intensity. The data are resampled 1000 times for each test. The distributions of the boostrap resamplings are shown in Figure3.
Microwave dust emission and AKARI O18 - 3
Figure 2. Processed data at each wavelgnth forλOrionis. A flat background has been subtracted from each frame based on the mean of pixels within the red rectangle. The pixel width is 0.25◦, with the data PSF smoothed to 1◦spatial resolution. Colorbars indicate the intensity in MJy/sr.
3. RESULTS
This confirms a correlation between the IR and AME. Interestingly though, the correlation strengths with AME show a pattern from short to long wavelengths: A9, P857, and P545 show the strongest correlations, with the correlation weaking from A18 to A90, and again strengthening at longer wavelengths. The overall pattern is for bands dominated by PAH emission, and those which trace Rayleigh-Jeans thermal dust emission are equally good predictors of the AME. Bands dominated by a mixture of very small grains (VSGs), and warm dust emission, show a weaker correlation.
Comparing the images in Figure2, most of the variation in the correlation scores appears to come from the central region ofλOrionis. Because of the known heating present within the ring, from theλOrionis association, and given the brightening of bands between A18 and A90, this variation appears to be due to a temperature increase.
This document is provided by JAXA.
JAXA Special Publication JAXA-SP-17-009E 126
O18 - 4 A. C. Bell et al.
Figure 3. Re-sampled (Bootstrap) correlation tests for IR emission inλOrionis vs. AME. Each band’srp distribution is shown in a different color (the same color scheme for both plots). The width of the distribution indicates the error for the given data in the correlation coefficient.
4. DISCUSSION
InλOrionis we found that accross the whole region, A9 emission and P545 emission were the most strongly correlated with AME. This is apparent both in the photometric band analysis, and in the dust SED fitting. The fact that the correlation strengths of PAH-tracing mission and sub-mm emission are similar is in-line withYsard et al.(2010) andHensley et al.
(2016)— although these two papers are odds as to which relationship is stronger.
The results are consistent with a scenario in which PAH mass, cold dust, and the AME are all tightly correlated. Weaker correlation from 25 to 70 µm may indicate that AME is weaker in regions of warmer dust and stronger radiation fields.
Such an anti-correlation with harsher radiation are consistent with the carriers of AME being destroyed in the central region ofλOrionis. We cannot conclusively identify PAHs at the AME carrier, nor can we rule out nanosilicates.
ExaminingλOrionis in intensity, we find that the A9 intensity correlates more strongly with AME than I12 or D12, the other PAH-tracing bands. In fact, A9 correlates more strongly with AME than any other band. This is consistent with the spinning PAH hypothesis, and taken alone may indicate that the 6.2µm feature emission from charged PAHs, may be a marginally better predictor of AME intensity. This could be consistent with PAH anions surviving in the portions of λOrionis which are emitting the strongest AME.
Future wide-area spectral mapping of theλ Orionis region may be able to conclusively test for increased f PAH+ in regions with stronger AME. Such studies would be strongly aided by higher resolution probing of spatial variations in the AME spectral profile. The ionization fraction of PAHs also may be worth further investigation in the context of AME.
This research is based on observations with AKARI, a JAXA project with the participation of ESA.
REFERENCES
de Oliveira-Costa, A., Kogut, A., Devlin, M. J., et al. 1997, ApJL, 482, L17 Dickinson, C., Paladini, R., & Verstraete, L. 2013, Advances in Astronomy, 2013, 1 Draine, B. T. & Lazarian, A. 1998, ApJ, 508, 157
Draine, B. T. & Lazarian, A. 1999, ApJ, 512, 740 Efron, B. 1979, Ann. Statist., 7, 1
Giard, M., Lamarre, J. M., Pajot, F., & Serra, G. 1994, A&A, 286 Hensley, B. S. & Draine, B. T. 2017, ApJ, 836, 179
Hensley, B. S., Draine, B. T., & Meisner, A. M. 2016, The Astrophysical Journal, 827, 45 Kogut, A., Banday, A. J., Bennett, C. L., et al. 1996, ApJ, 460, 1
Leitch, E. M., Readhead, A. C. S., Pearson, T. J., & Myers, S. T. 1997, ApJL, 486, L23 Ochsendorf, B. B., Brown, A. G. A., Bally, J., & Tielens, A. G. G. M. 2015, ApJ, 808, 111 Onaka, T. 2000, Advances in Space Research, 25, 2167
Planck Collaboration, Ade, P. A. R., Aghanim, N., et al. 2016, A&A, 594, A25 Planck Collaboration, Ade, P. A. R., Aghanim, N., et al. 2014, A&A, 571, A12 Tibbs, C. T., Flagey, N., Paladini, R., et al. 2011, MNRAS, 418, 1889
Ysard, N., Miville-Deschênes, M. A., & Verstraete, L. 2010, A&A, 509, L1 Ysard, N. & Verstraete, L. 2010, A&A, 509, A12
This document is provided by JAXA.