Chapter 4
Evaluation and Influential Factor of Regional Total Factor Energy Efficiency in China
Jing HAN
School of Economics and Resouece Management, Beijing Normal University, China.
Qingxin LAN
Institute of International Economy, University of International Business and Economics, China.
Abstract
There are big gaps in total factor energy efficiency among all regions of China, high in the east to low in the west. The difference between the eastern part and the mid-western part is expanding, while the difference between the middle and western region decreases. In terms of different regions, the total factor energy efficiency in the eastern district greatly diverges, and it continues to shrink in the mid-western part. Technical level, openness and industrialization level of the region play a positive effect on improving the total factor energy efficiency, while the regional ownership structure negatively influences the development of the total factor energy efficiency.
Key Words: the total factor energy efficiency (TFEE), DEA model, evaluation, influential factors.
Ⅰ. Introduction
Energy, an important resource, is vital for the modern economic growth, and plays a dominant role in driving economic development. Since China adopted the reform and opening-up policy, energy has been the important and “dynamic support” for the sustainable and rapid development of China’s economy.
However, along the economic growth, the stress of energy’s extensive consumption to economic development and environmental protection is weighing more and more heavily. And energy efficiency needs to be increased urgently. Thus, it is of great significance to achieve the objective of energy saving and emission reduction by analyzing the energy efficiency in China and the influential factors.
DEA method was widely applied to measure and compare the efficiency of various energy sectors, especially electricity and coal industries, in foreign research (Azadehetal.,2007;Mukherjee,2008). Hu and Wang (2006) made pioneering contribution to the energy efficiency of China energy sectors.
Hu and Wang adopted the constant returns to scale (CRS) model based on DEA, estimating the potential energy inputs of every province from 1995 to 2002, and defining the total factor energy efficiency as the ratio of the potential energy inputs to the real energy inputs. Thus, it founds that the energy efficiency was highest in the east and lowest in the middle. Wei Chu and Shen Manhong (2007), referring to the method of Hu and Wang (2006), indicated that the evolution of China’s energy efficiency tended to be the inverted U-shape.
And the energy efficiency decreased by regions from the north-east old industrial bases to the east to the middle to the west. Shi Fu and Shen Kunrong (2008) enforced the knowledge stock under the production function as input index, attributing the super efficiency DEA method to estimate the total factor energy efficiency among provinces. Shi Dan et al. (2008) set up an analyzing frame of the regional difference of energy efficiency based on the stochastic frontier production function, and calculated the effect of the energy efficiency factors on regional industries of China from 1980 to 2005. The above methods mainly based on the linear programming technique to determine the optimal DMUs. Though it systematically estimated and compared the energy efficiency of all DMUs, there was still room for the improving the energy efficiency evaluation and the influential factors. The paper will adopt the CRS based on super-efficiency DEA model to estimate the energy efficiency of different regions in China from 2000 to 2007, apply the Malmquist index to dynamically evaluate the total factor energy efficiency, and use Tobit method to empirical test on the factors affecting the regional energy efficiency.
Ⅱ. Measure of the total factor energy efficiency
⒈ Research methods
DEA was initially advanced by Charnes, Cooper and Rhodes (1978), named CCR model. It was a nonparametric frontier established by the linear programming method, which was used to estimate the relative efficiency of Decision Making Unit (DMU for short) with multi-inputs and outputs.
CCR model based on DEA divided the DUM into two groups: the effective and the non-effective. As for several effective DUMs, it was hard to make a further evaluation and comparison of the DUMs. To remedy the defect, Andersen and Petersen (1993) established the super-efficiency DEA model, which could compare the efficiency of the relatively effective DUMs. The basic thinking was to evaluate some DUM, and excluded it from the DUM set. It would be reflected in the model to form the following linear programming model:
minθccrs-super
s.t.Σn
j≠kj=1
xλj j-θ< ccrs-superxk
Σj=1n
j≠k
yjλj-y< k
λj-0, j =1, 2, 3…n>
θccrs-super means the efficiency of DMUc.. Based on the input-oriented super- efficiency DEA model, the paper estimated the total factor energy efficiency of China’s 30 provinces, autonomous regions and municipalities from 2000 to 2007.
2. Data extraction
30 provinces, autonomous regions and municipalities of China excluding Tibet ARE chosen as the research project. And the research period is from 2003 to 2010. GDP is regarded as the output variable of the model, and the input variables contain capital, labor and energy. The production function can be represented by:
Y=f (C, L, E) (1)
Capital (C): selecting the investment in fixed assets. To ensure the consistency of input-output variables, the author adopts GDP deflator to converse capital stock into the data based on 2000.
Unit: million yuan.
Labor (L): selecting the employees in the end of year, instead of effective labor time of the total employed people due to lack of statistical data related to the average working hours.
Unit: 10 thousand persons
Energy (E): energy input is represented by the annual energy consumption of all provinces, calculated by adding the consumption of the main consumable energies, including coal, oil, natural gas, hyper-power in the unified units, since the kinds of energy consumption are different in China.
GDP (Y): the output variable is expressed by the real GDP at the constant prices of 2000. The source data originate from China Statistical Yearbook.
Unit: million yuan.
Adopting the input-oriented CRS super-efficiency DEA model, the table 1 reveals the measurement results of the total factor energy efficiency of China evaluated by software EMS-130.
3. Evaluation Results
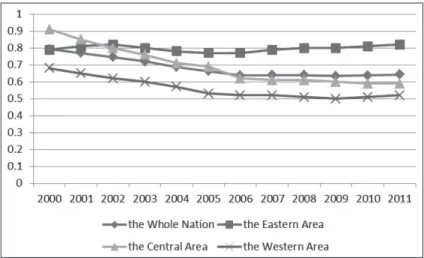
Nationally, the regional total factor energy efficiency fluctuates significantly.
The average energy usage was the highest in 2000, about 0.79, and has been decreased year after year. It reached a low point in 2006, about 0.63. The mean value of China’s total factor energy efficiency was 0.684 from 2000 to 2011.
There was still a great improvement for energy efficiency of China. As for the provinces and cities, the average values of total factor energy efficiency of Shanghai and Guangdong were over 0.9, and have been increasing from 2003 to 2010, which exceeded 1 in 2010. At present, the total energy efficiency of Shanghai and Guangzhou still dominate in China, since they are the undisputed leaders in institutional innovation of China, with strong capacity to learn foreign advanced operation and management philosophy and experience. It also indicates that both places are setting the pace in energy utilization technology.
Besides Shanghai, technological efficiency of Tianjin, Beijing, Fujian and Jiangsu is high as well. Along the east coast, they are advanced in technology with abundant human capital and perfect institutional environment, and which make it better to realize the innovation in operation and management model and the optimized allocation of resources during the economic development and foreign exchange. Moreover, Heilongjiang is outstanding in central China, edged itself in technological efficiency of China. But we should affirm that the total factor energy efficiency of Heilongjiang has been decreasing in recent years.
Comparing the total factor energy efficiency in the eastern, the central and the western areas of China, it is quite distinct from each other. The energy efficiency of the central China reached the highest in 2000, but then it has been trending down. The western area lagged behind the other parts in energy efficiency since 2000, and which increased in 2010 as other provinces and cities.
More efforts needed to save energy and reduce pollutants in central and western areas. The efficiency value of the eastern part peaked in 2002, about 0.82, then begun to peak off in 2003, raised again in 2007, and reached 0.82 in 2011. That it was the first to enter the post industrialization age may have contributed. Simon Smith Kuznets insisted that the amount of industry energy may be considered negligible in the low level economic development. Thus, the industry energy consumption intensity was approaching zero, while it shall be increased noticeably in the peak hours for industrial production. As for the post industrialization age, it might begin to slide along with the economic structure transferring from industry-oriented to service-oriented. The eastern areas, including Beijing and Shanghai, are entering the post industrialization stage.
Figure 1 reveals that the gap on the total factor energy efficiency between the central and the western was about to start shrinking recently, while it enlarged between the eastern parts and the central and western parts.
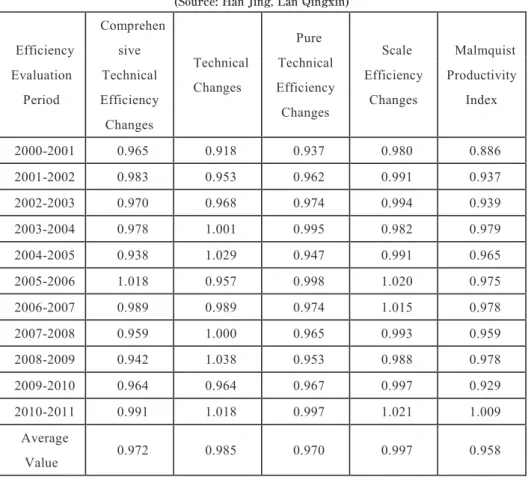
Ⅲ. Dynamic Changes of the Total Factor Energy Efficiency in China To further analyze the dynamic changes of the total factor energy efficiency in China the paper calculated the Malmquist index and the decomposition from 2003 to 2010 according to the statistical data of China’s 30 provinces, autonomous regions and municipalities. The results were shown as followed in table 1.
Table 1 indicates the changes of the total factor energy efficiency and the decomposition of China’s 30 provinces, autonomous regions and municipalities from 2000 to 2011. The total factor energy efficiency looks gloomy in China from time series. Except 2010-2011, Malmquist index of the total factor energy efficiency was below 1, which showed a downtrend curve in most time within 2003-2010. Next, we shall analyze the reason leading to the reduction of Malmquist index by decomposing it into two parts-comprehensive technical efficiency changes and technical changes. Table 1 reveals technical level in energy utilization of China was increasing slowly from 2003 to 2005, but slipped back from 2005 to 2007. Thus, the government put forward to make great efforts in developing circular economy at the Central Economic Work Conference in 2004, which means lightening the pressure on the total resources of China is urgently needed. Hereafter, all areas in China extensively pursued energy saving and pollutants reduction technologies. And the energy technological level was rising at a rapid speed every year. Comparing to the rising technological level, the comprehensive technical efficiency changes were barely satisfactory. And it was descending all the time expect it was higher than 1 during 2005-2006. Obviously, energy management regulation and
Figure 1 Energy Efficiency Comparison of China 2000-2011 (Source: Han Jing, Lan Qingxin)
decision of China have yet to be improved. At present, there were multi- divisions to decentralize the energy administration. The management duties of non-renewable energy, such as coal, electricity, and oil, are distributed among dozens of divisions, with no centralized energy management department. It is incompatible with the requirements of energy supply, storage and safety. In fact, multifarious administrations which make the operation cost high is the main reason leading to the lower energy efficiency. And the backward of the comprehensive technical efficiency drags the Malmquist productivity index.
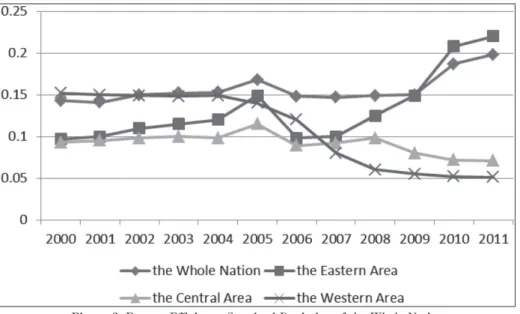
Convergence analysis of the total factor energy efficiency of China is stated as follows. Figure 2 shows the standard deviation of the total factor energy efficiency from the whole nation and areas. Nationally, the total factor energy efficiency σ of China is in the tendency of rising except a sharp decline in 2006 and a small drop in 2007. It is divergent in China’s energy efficiency. In terms of different regions, the tendency of the total factor energy efficiency σ in east coast is similar to the nation. It reveals to be divergent except the convergent
Table 1 Changes and Decomposition of the Annual Malquist Index 2003-2010 (Source: Han Jing, Lan Qingxin)
situation in 2006-2007, and which indicated the large gap on energy efficiency among the different areas in the east. Recently, the industrialization in Liaoning and Hebei is obviously different from the eastern area. Liaoning is one of the old industrial bases with great gaps in internal economies, and some parts have less awareness on energy efficiency. Most part in Hebei is in the central rather than the east, along with lower technical level and poor fluidity in resources. Thus, it cannot adjust the input scale of capital and labor timely, resulting in the lower pace to the perfect efficiency. In addition, the total factor energy efficiency σ in central fluctuates dramatically with the distinct tendency of declining. That means the gap among the central is getting smaller. The total factor energy efficiency σ is decreasing unilaterally with strong convergence. The reason of efficiency convergence in the central and the west is due to imitate the great organization form and management style to improve the efficiency. Provinces and cities in the poor development are stronger in the post-advantages and faster in surpassing others. Therefore, the difference among the provinces and cities becomes smaller.
Ⅳ. Empirical Analysis
The paper analyzes the degree of three variables, including the actual utilized foreign capitals, amount of the technical market and the importation of foreign technologies on the explained variables based on the annual data from 2000 to 2011. It adopts the panel-data analysis method of software Eviews, and which
Figure 2 Energy Efficiency Standard Deviation of the Whole Nation and Different Areas (Source: Han Jing, Lan Qingxin)
is concretely studied by establishing the panel-regression model.
⒈ Analyzing the national data
The paper is to model and analyze based on the whole nation data. The results are listed below:
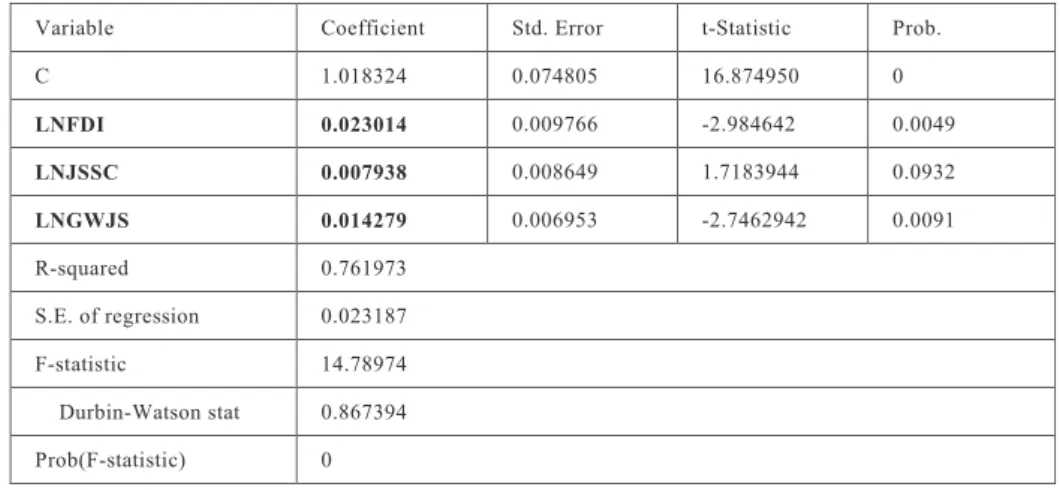
Table 2 Regression Analysis of the Technical Efficiency and the Explaining Variables (Source: Han Jing, Lan Qingxin)
It reveals that though coefficients are low in significance, the model guasi- degree is relatively high. The model is validated on the 10% level.
Table 3 The Regression Coefficients of Explaining Variables on Technical Efficiency Values 2000-2011 (Source: Han Jing, Lan Qingxin)
The coefficients reveal the degree of explaining variables on the technical efficiency values. The larger the coefficient is, the greater contribution it makes on the variables be explained. In terms of the whole nation, the degree of the foreign capitals actually utilized and the amount of the national technical market on the technical efficiency changes reaches the highest. It indicates the technical efficiency is greatly improved by FDI, which is closely related to the technical spillover and institutional innovation. Comparing the national technical transfer and the direct importation of foreign technologies, we find that the former makes more contribution to the technical efficiency than the latter. The
joint innovation has played a role in the technical cooperation among the national enterprises. The desired effect of importing directly from the foreign countries has not been produced since it totally differs from the national situation. We should pay more attention on FDI and technical spillover to further improve the technical transfer efficiency and perfect the national technical market. The absorption problem after directly importing the foreign technologies should be first taken into consideration.
⒉ Analyzing the Provincial Data
Next, the paper studies the relation between the technical efficiency of the eastern and the central areas and the explaining variables. The results are listed below:
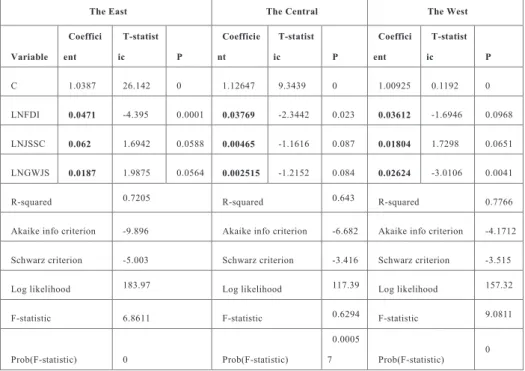
Table 4 The Regression Coefficients of Explaining Variables of the East, the Central and the West on Technical Efficiency Values 2000-2011 (Source: Han Jing, Lan Qingxin)
It shows that the model guasi-degree is relatively high, and passes the test.
Overall, there are totally different in the regression coefficients affecting the technical efficiency of the eastern, central and western areas in China. However, it is basically consistent to the results from the above spatial data analysis.
Namely, the actual utilized foreign capital is an important factor to technical efficiency changes.
As shown Table 5, in terms of different areas, the amount of the national technical market has a great influence on the technical efficiency in the eastern area, since it might have good foundation in technical innovation. As for the central and west, the actual utilized foreign capital is still the major reason for technical changes.
Table 5 The Regression Coefficients of Technical Efficiency Values in the East, the Central and the West 2000-2011 (Source: Han Jing, Lan Qingxin)
Ⅴ. Conclusion
The paper estimates the total factor energy efficiency of China’s 30 provinces, autonomous regions and municipalities from 2000 to 2011, by adopting the DEA super-efficiency method, and studies the factors affecting the regional energy efficiency of China by the means of Tobit. It notices that, first the total factor energy efficiency of China was decreasing, since there were obvious defects in China’s energy management methods and management system. Meanwhile, the technical level in energy utilization was improving year after year; second, there were greatly different in the total factor energy efficiency in China. It was the highest in the east, intermediate in the central, while the west was the- lowest. The gaps of the total factor energy efficiency between the eastern area and the central and western areas were larger, while it become smaller between the central and the west; third, the convergence analysis of the total factor energy efficiency indicates that it became more different in the intro- eastern region, while constantly reduced in the intro-central and western regions; four, TOBIT reveals that the regional technical level, regional openness and industrialization has a significant positive influence on the regional total factor energy efficiency. That is to mean, it needs to improve the technological level of China by further upgrading regional total factor energy efficiency. And it shall be more open with no threaten on regional industry safety. Meanwhile, the resources of industries should be integrated, producing the scale economy effect; five, regional ownership structure has played a significantly negative
role in improving the total factor energy efficiency. It reveals that all areas should deepen the ownership reform and make constant innovation.
Acknowledgement
This paper was supported and assisted by the National Social Science Fund of China“Study on the early warning mechanism and system strategy of Chinese manufacturing industry to address the carbon tariff”(12CJY037).
References
Wei Chu, Shen Manhong. Energy Efficiency and the Influencing Factors: an Empirical Analysis Based on DEA [J], Management World, 2007 (8): 39-49.
Shi Fu, Shen Kunrong, China’s Total Factor Energy Efficiency under Market Segmentation [J], World Economy, 2008 (2):35-43.
Shi Dan et al. Study on Regional Difference of China’s Energy Efficiency and the Factors [J], Management World, 2008 (2): 35-43.
Charnes,A. Cooper,W.W, and Rhodes,E. Measuring the Efficiency of Decision Making Units [J]. European Journal of Operational Research, 1978, 2: pp. 429-444.
Andersen, Per. and Petersen, N. C. A Procedure for Ranking Efficient Units in Data Envelopment Analysis [J]. Management Science, 1993,9, pp. 1261-1264.
Kuznets, Simon. Economic Growth and Income Inequality [J].American Economic Review, 1955, 45 (1) (March), 1-28.
Hu, Jin-Li and Shih-Chuan Wang, 2006, Total Factor Energy Efficiency of Regions in China [J], Energy Policy, Vol 34 (17),3206-3217.
Mukherjee, K., 2008, Energy Use Efficiency in US Manufacturing: A Non-parametric Analysis [J], Energy Economics 30, 76-96.