Experiences with Foreign Workers in Singapore and Malaysia: What are the Lessons for Japan's Labor Markets?
著者(英) Ramstetter Eric D.
journal or
publication title
AGI Working Paper Series
volume 2016‑06
page range 1‑60
year 2016‑03
URL http://id.nii.ac.jp/1270/00000103/
Creative Commons : 表示 ‑ 非営利 ‑ 改変禁止 http://creativecommons.org/licenses/by‑nc‑nd/3.0/deed.ja
Experiences with Foreign Workers in Singapore and Malaysia:
What are the Lessons for Japan’s Labor Markets?
Eric D. Ramstetter
Asian Growth Research Institute and Kyushu University, Japan
Working Paper Series Vol. 2016-06 March 2016
The views expressed in this publication are those of the author(s) and do not necessarily reflect those of the Institute.
No part of this article may be used reproduced in any manner whatsoever without written permission except in the case of brief quotations embodied in articles and reviews. For information, please write to the Institute.
Asian Growth Research Institute
1
Experiences with Foreign Workers in Singapore and Malaysia:
What are the Lessons for Japan’s Labor Markets?
Eric D. Ramstetter ([email protected]) Asian Growth Research Institute and Kyushu University
March 2016 Abstract
Singapore and Malaysia have a long history of relying heavily on foreign, immigrant workers in both high-skilled and low-skilled occupations. Ancestors of large portions of the local population in both countries were also immigrants. Correspondingly, economic policies have been designed to manage high levels of migration and foreign workers. In contrast, Japan limited both immigration and foreign workers quite strictly through the 1980s. Since the 1990s, however, the ratio of the stock of net inward immigrants to total population has grown much more rapidly in Japan than in Singapore or Malaysia, largely because the rapidly aging population and changes in worker preferences have resulted in strong demand for immigrant labor. Since the 1990s, Japanese policies have actively sought to entice highly skilled foreign workers and students to work and/or study in Japan. The primary purpose of this policy-oriented paper is to review the substantial economic literature on experiences with foreign workers in Japan, Singapore, and Malaysia and its implications for Japan’s labor markets and related policies.
JEL Codes: F22, J20, J30, J61, N35
Keywords: Foreign workers, Asia, Employment, Wages, Skilled workers, Construction workers, Health care workers, Domestic workers, Macroeconomics, Adjustment costs, Externalities
Acknowledgement: This paper is one result of the project “Regulations and Systems that Facilitated the Growth of Asia’s Newly Industrialized Economies: Lessons for Japan”, financed by Japan Society for the Promotion of Sciences grant #26285062 in fiscal years 2014-2016; I thank JSPS for this finance. I also thank Erbiao Dai, Evelyn Devadason, Tatsuo Hatta, Linda Low, and Shandre M. Thangavelu, among others for research advice. I-Hui Cheng, Eddery Lam, Feichang Wang and other participants of the Trade and Worker Remittances session at the WEAI’s 12th International Conference in Singapore in January 2016 also provided valuable commets. However, I am solely responsible for the content of this paper, including all errors and opinions.
2 1. Introduction
Singapore and Malaysia have a long history of relying relatively heavily on foreign, immigrant workers. In recent years most foreign workers have been in low-skilled occupations. Ancestors of large portions of the current, local population in both countries were also immigrants, mainly from China, the Indian subcontinent, Indonesia, and other surrounding Asian economies. Correspondingly, economic policies have been designed to manage relatively high levels of immigration and foreign workers. In contrast, Japan limited inward both immigration and employment of foreign workers quite strictly through the 1980s.
Since the 1990s, however, the ratio of the stock of net inward immigrants to total population has grown much more rapidly in Japan than in Singapore or Malaysia, largely because the rapidly aging population and changes in worker preferences have resulted in strong demand for relatively unskilled foreign labor. Japan’s recent policies have also sought to entice highly skilled foreign workers in a number of fields and students to study (and work) in Japan. It is likely that migration and foreign workers will continue to grow relatively rapidly in Japan during the coming decades. Because Singapore and Malaysia have long relied relatively heavily on foreign workers, much more than most other Asian economies, this paper reviews the empirical literature on their experiences, as well as Japan’s, and tries to discern lessons that may be relevant for Japan as it opens up more to foreign labor.
This seemingly simple task is actually quite complex and no single paper can pretend to cover all important, relevant issues. This paper focuses on primarily on labor market effects in the recipient economy and related issues because they are among the most important and controversial effects of foreign workers. After reviewing trends in migration, foreign workers, and related policies in Section 2, the paper reviews literature analyzing on the effects of migration on recipient economy labor markets, particularly employment and wage levels, and the markets for skilled labor, construction workers, and health or domestic workers in Section
3
3. Section 4 then considers related literature on the macroeconomic effects, structural changes and related adjustment costs, and Section 5 summarizes major conclusions.
2. Migration Trends and Policies: The Crumbling of Japan’s Last Formal Barrier?
Japan has often, and usually incorrectly, been characterized as a closed, well protected market. For example, even after Japan’s large economic size is considered, Japan has long had relatively low ratios of imports or foreign direct investment to GDP and restrictions on imports, inward FDI, and other foreign exchange transactions were among the most conspicuous elements of Japanese economic policy in the 1950s and 1960s (e.g., Itoh and Kiyono, 1988). Many of Japan’s other government regulations and procedures, as well as private institutions such as the keiretsu (firm groups) have also been argued to constitute
“barriers to trade and investment” making it difficult for foreign producers to sell in Japanese markets (Encarnation 1992, Lawrence 1991, 1992). Foreign firm shares of Japanese markets have been limited by relatively high factor (particularly land) costs and high adaption costs to what foreign firms often view as a relatively limited market (Ramstetter and James 1993). On the other hand, many foreign firms benefit from Japan’s regulations and participation in institutions like the keiretsu, and most of Japan’s markets have in fact been quite open to competition from abroad since the 1970s.
Although merchandise and capital markets opened up earlier, Japan remained largely closed to foreign workers through the 1980s (Chiba and Yamamoto 2015; Yamada 2010), as did other Northeast Asian economies (e.g., China, Korea, Taiwan). The section first provides a region-wide overview of trends in migration and foreign workers and then discusses related policies and trends in foreign workers in Japan, Singapore, and Malaysia in some detail.
4 2a: Migration and Foreign Workers in East Asia
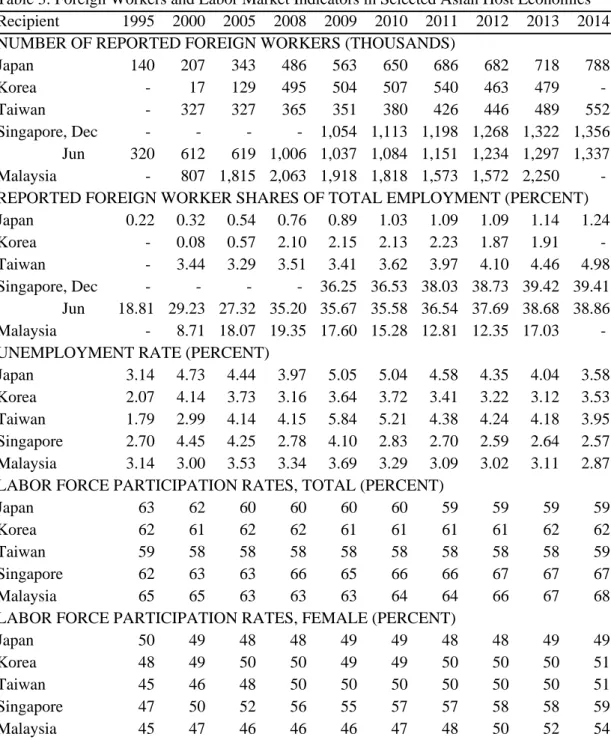
As late as 1990, migrants constituted only 0.9 percent of the Japan’s population, 0.2 percent of Taiwan’s, and 0.1 percent of Korea’s (Table 1). These migrant shares were all much lower than the world average of 2.9 percent, or regional averages exceeding 7 percent in the advanced economies of Northern Europe, Western Europe, North America, and Oceania. In Northeast Asia, only Hong Kong had a high migrant share (38 percent). Migrant shares were low in Southeast Asia as a whole (0.7 percent), but relatively high in Singapore and Malaysia, at 24 and 5.6 percent, respectively.
By 2013, migrant shares of population more than doubled in Japan to reach 1.8 percent, and increased even more rapidly to 2.5 percent in Korea and 2.7 percent in Taiwan (Table 1).
Thus, Japan, Korea, and Taiwan continue to have relatively small migrant shares, but migrant shares have grown very rapidly as more open, transparent policies simplified immigration procedures and requirements substantially. Migrant shares continued to increase in Singapore and Malaysia, rising to 43 and 8.3 percent, respectively, but the growth of the migrant stock has slowed in recent years. If migrant stocks in Japan, Korea, and Taiwan are combined, they amounted to 2.3 million in 1990, 3.7 million in 20, and 4.3 million, respectively. Thus, these three traditionally “closed” Northeast Asian economies have seen migration grow relatively rapidly and joined Hong Kong, Singapore, Malaysia, and Thailand as among the largest destinations for migrants headed to Asia.
Rapidly aging populations are a major economic factor behind increased demand for foreign workers in Japan, and well as Korea and Taiwan. Policy changes in the 1990s also made it easier to hire foreign workers in all economies, and helped create immigration systems that can cope with higher levels of migration. Policies promoting study and internship are primarily responsible for the large migrant share among the student age (15-29) cohorts in Japan (3.7 percent) and Korea (3.9 percent; Table 1). The largest group was the working age
5
(30-64) cohort and it too had relatively high migrant shares, 2.2 percent in Japan and 2.9 percent in Korea. In contrast, migrant shares were relatively low in the young (0-14) cohort (1.3 percent in Japan, 0.8 percent in Korea) and lowest in the old (65+) cohort (0.6 percent in Japan, 0.4 percent in Korea). Migrant ratios were also highest for the student cohort in Malaysia. However, the pattern differed in Singapore with migrant shares being largest for the working age cohort, followed by the student and old-age (65+) cohorts.
Not surprisingly, relatively nearby economies which share linguistic and cultural roots were the largest sources of migrants. In Singapore, Malaysians dominate accounting for 27 percent of the total in 1990 and 45 percent in 2013 (Table 2). Chinese migrants followed with shares of 21 and 16 percent, respectively. No other single source had shares above 7 percent in either year, but the combined share of Indonesia, India, and Pakistan grew conspicuously from 7 percent in 1990 to 18 percent in 2013. In Malaysia, Indonesians were the largest migrant group, 36 percent of the total in 1990 and 43 percent in 2013. In 1990, the Philippines and China were also relatively large sources (13-15 percent), but they were very small in 2013 (1 percent or less).1 On the other hand, Bangladesh’s share grew conspicuously to 14 percent in 2013, while shares of India, Singapore, and Vietnam were modest (3-5 percent).
Neighboring China accounted for large and increasing shares in Japan (14 and 27 percent, respectively) and Korea (46 and 53 percent, respectively). Korea was also a very large source for Japan in 1990 (64 percent), but its share fell to only 29 percent in 2013. On the other hand, increased shares of migrants from Brazil (5 to 9 percent) and the Philippines (5 to 15 percent) were conspicuous in Japan, while rapid growth of migrants from Vietnam (1 to 10 percent) was conspicuous in Korea.
Less than 30 percent of migrants were reported as foreign workers by Japan, MHLW (various years a, various years b). Japan’s ratio of foreign workers in Table 3 to migrants in
1 Malaysia’s migration data apparently exclude substantial irregular workers and migrants from the Philippines; see Section 2d below for more details.
6
Table 1 rose from 12 percent in 2000 to 28-29 percent in 2010 and 2013. These ratios were also relatively low for most years in Korea (7, 53, and 39 percent in 2000, 2010, and 2013, respectively), but higher for Singapore (45, 50, 56 percent, respectively, June estimates) and Malaysia (50, 77, and 91 percent, respectively). In other words, according to official data, substantially larger portions of migrants in Malaysia and Singapore work than in Korea and particularly Japan.
Correspondingly, foreign worker shares of employment in host economies were much larger than migrant shares of population in Singapore (27-29 percent in 2000 and 2005, 35-39 percent in 2008-2014) and in Malaysia (9 percent in 2000, 18-19 percent in 2005-2009, 12-15 percent in 2010-2012, and 17 percent in 2013 (Table 3). In Taiwan, foreign worker shares grew from 3.3-3.4 percent in 2000-2005 to over 4 percent in 2012-2013 and 5 percent in 2014.
In Korea, shares grew especially rapidly in 2000-2008 (from 0.1 to 2.1 percent), but stagnated in 2009-2011, and declined some in 2012-2013. Foreign worker shares were lowest in Japan, but increased rapidly from 0.2 percent in 1995 to 0.5 percent in 2005, 1.0 percent in 2010, and 1.2 percent in 2014.
It is hard to explain the variation in these shares over time. For example, the correlation between the unemployment rate and the foreign share of employment is strong and positive (0.73) in Malaysia (data from Table 3). This correlation makes some sense if the demand for foreign workers increases when the labor market tightens and the unemployment rate increases. On the other hand, strong negative correlations were observed for Korea (-0.71) and Singapore (-0.84, June data), while correlations were negative and weak for Japan (-0.33) and Taiwan (-0.19). Thus, there seems to be little consistent correlation of unemployment and foreign worker shares in this small sample.
The influence of aging is an important explanation for trends in labor force participation rates. In Japan, the total participation rate has slowly declined from 62 percent in 2000 to 60
7
percent in 2005 and 2010, and 59 percent in 2011-2014 (Table 3). After declining slightly in 1995-2000, the female participation rate has been steady but relatively low at 48-49 recent years; in other words, the male participation rate is falling faster than the female and total rates. Total participation rates are also relatively low in Korea (61-62 percent) and Taiwan (58-59 percent) but have not changed much in recent years, while female participation rates increased to slightly higher levels than in Japan (50-51 percent in 2009-2014 for both economies). Through 2011, Malaysia also had a relatively low female participation rate, 48 percent or less, but this jumped to 54 percent in 2014, and fueled increases in the total participation rate from 64 to 68 percent. This large an increase in the female participation rate seems unlikely to have occurred during such a short, 3-year period, but it is likely that female participation rates are increasing relatively rapidly in Malaysia. Among these economies, Singapore usually had the highest total participation rate, largely because the female participation rate was by far the highest in this economy.
2b: Foreign Workers in Japan
Although most migrants were not foreign workers, close to half (43-46 %) of foreign workers had permanent or family visas (Table 4). In other words, close to half of foreign workers came from families with close ties to Japan and who were eligible for support provided to permanent residents, spouses and children, and sometimes other relatives. This is a heterogeneous group, but relatively high income individuals who are often entrepreneurs or formal employees and have assimilated into the Japanese system, along with their families, probably constitute the majority.
Through the 1980s, the primary purpose of Japan’s immigration laws was to manage the legal status of long-time, foreign residents, most of whom were Korean, (Table 2). After 1990, the share of Koreans fell precipitously as most new immigrants came from other economies,
8
most conspicuously China, Brazil, and the Philippines. As mentioned previously, the data in Tables 2 and 4 show that very few Korean migrants in Japan are reported as working (only 34,100 of 699,029 migrants in 2013). In contrast, close to half of Chinese migrants are reported to work (303,866 workers out of 655,480 migrants in 2013). Although it is highly likely that relatively large proportions of Korean migrants do not participate in the workforce because of age and other factors, it seems unlikely that less than 5 percent of Korean migrants work, while close to half of Chinese do. Here it is important to recognize that most Koreans have permanent or family-related visas which allow the migrant to work in any occupation, but that many Korean workers work for or run small (often family-owned) firms that may be missed by the foreign worker surveys.
As pointed out above, the ratio of foreign workers to migrants remains extremely low in Japan, 28-29 percent in 2010 and 2013, for example (Tables 1, 3). Correspondingly, reported foreign workers were 1.2 percent of employment or less in 1995-2014 (Table 3). Although ratios were low, there were two distinct periods of rapid growth in 1995-2000 (65% worker increase) and 2005-2010 (89% increase), and two periods of relatively slow growth in 2000- 2005 (42% increase) and 2010-2014 (21% increase). Changes in compilations of foreign worker data in 2008 also appear to have contributed to the rapid increase during 2005-2010.
As a long-term foreign resident of Japan who arrived in 1976, I have extensive personal experience with an immigration system that was originally designed to minimize Japan’s dependence on foreign workers, but which has changed substantially. As Chiavacci (2012) explains, the first big change came in the 1980s when Prime Minister Nakasone announced plans to internationalize Japan’s higher education and facilitate the study of 100,000 foreign students in Japan by 2000. Visa requirements for students were subsequently relaxed and procedures streamlined when the Immigration Control and Refugee Act was revised in 1990.
These changes resulted in only modest increases in foreign university students, but very large
9
increases in pre-college students in the late 1980s and early 1990s. Moreover, it became easier for students to work, and many students used their student status primarily to facilitate work, not study. This led Japanese authorities to crack down on pre-college institutions and related visa applications in the early 1990s. The number of pre-college students subsequently fell, though the number of foreign students did not increase much until the early 2000s. Data for more recent years show that students accounted for 13-16 percent of foreign workers in 2008- 2014, while others with special visas accounted for another 2-3 percent (Table 4).
Le Bail (2011) and Liu-Farrer (2011, pp. 85-124) document how many Chinese students have been able to remain in Japan after graduation, find relatively skilled occupations, and/or go on to become entrepreneurs. I personally know many students of other nationalities that have also been able to arrange employment or became entrepreneurs after graduation. Thus, although they do not account for a large portion of the Japanese workforce, foreign students who choose to remain in Japan and work after finishing their studies have increased markedly after the policy changes in the 1980s.
The 1990 legal changes also made it possible for Japanese firms to hire interns and trainees on a contract basis, and to hire skilled foreign workers more easily (Yamada 2015). By 2008- 2014, these technical trainees etc. accounted for 19-21 percent of all foreign workers (Table 4). Workers in this category were usually relatively unskilled workers, and usually hired on fixed-term contracts of three years or less. The employment of students and technical trainees,
“has allowed unskilled workers through the ‘backdoor’” (Ducanes and Abella 2008, p. 18), despite the official policy of excluding unskilled foreign workers.
In recent years, the government’s emphasis has been on increasing the relatively small group of specialists and technicians, which accounted for 17-19 percent of foreign workers.
This is a relatively new category which used to be combined with permanent/family visa
10
category through 1997 (Japan, MHLW, various years a), but was distinguished in order to accommodate and promote increased migration of relatively skilled foreign workers.
Since 2008, relatively small plants with 99 or fewer workers have hired over half of all foreign workers (54-57 percent, Table 4). Because relatively small plants tend to use relatively unskilled labor relatively intensively, and have relatively unsophisticated technology, this is another indication that a large portion of foreign workers are relatively unskilled. Data for previous years suggest smaller shares for small plants (26-27 percent), however. As mentioned above, there was a large change in data compilation methodology from 2008 forward, and it seems likely changes in data compilation are closely related to the large jump in the share of small plants.
Similarly, data for 2008-2014 suggest a very different industry distribution of foreign workers than older estimates (Table 4). For example, the share of manufacturing in foreign workers gradually declined from 40 percent in 2008 to 35 percent in 2014, but was much smaller than the 70 percent estimated for 1995 and 2005. Trade and hotel and restaurant services were the large services category, followed by educational services. Neighboring China has been the largest source of foreign workers in 2008-2014, accounting for 40-44 percent of the total. Workers from China were relatively numerous in the trade and hotel and restaurant services industries (56-64 and 59-73 percent, respectively, of each industry total).
In 2008, Brazilian workers were also relatively numerous, accounting for 20 percent of the total. A little over half of Brazilian workers were in manufacturing in all years, but the number of Brazilians declined after 2011, to 12 percent of the total in 2010. The Philippines was the only other source accounting for 10 percent or more of the total (since 2011); by 2014 the numbers of Brazilians and Filipinos were similar.
One important reason for large immigration from Brazil and smaller immigration other economies such as Peru is Japan’s practice of prioritizing visas for descendants of Japanese
11
nationals that emigrated to these economies in the past. Increases in workers from the Philippines have been concentrated in manufacturing, and some of these workers have been admitted under plans related to Japan’s recent agreements with the Philippines and the Association of Southeast Asian Nations (ASEAN).
2c: Foreign Workers in Singapore
Although home to many migrants, Singapore publishes few data on foreign workers in the economy, partially because the government is reluctant to publish information that it views as potentially controversial. Such government secrecy no longer feasible in more open democracies like Japan, Korea, and Taiwan, but remains common in Singapore (and to some extent Malaysia), where autocratic governments have been able to convince their constituents to accept single-party domination and paternalistic attitudes toward economic policy making (Low 2001). And after sharp increases in the number of foreign workers in the late 1990s and again in the mid-2000s, issues related to foreign workers became an increased source of political and social tension in Singapore.
The longest available series covers the aggregate number of resident and non-resident employees. In these data, Singapore’s employed non-residents are defined as foreign workers and employed residents are defined as local workers.2 These definitions underestimate the number of foreign workers because some are Singapore permanent residents, but not citizens.
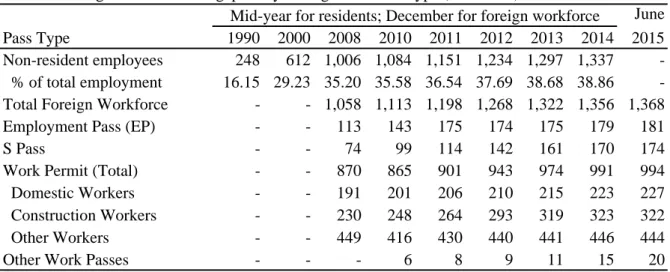
However, the vast majority are non-residents, as illustrated by the fact that the total number of foreign workers exceeded the number of employed foreign non-residents by an average of only 3 percent in 2008-2014 (Table 5). As mentioned above, the share of foreign non-resident
2 The primary source of these data is the Yearbook of Statistics Singapore (Singapore, Department of Statistics, various years), Beginning with the 2007 issue, one can compile a series from 1996-2014. These series are also repeated in ADB (various years) also beginning with the 2007 issue, with 2010 and 2015 issues containing consistently defined data for 1990 and 1995, which are not available from the primary Singapore source.
12
employees in Singapore’s employment grew very rapidly from 16-19 percent in 1990 and 1995 to 27-29 percent in 2000 and 2005, and 35 percent in 2008, before stabilizing at 37-39 percent in 2011-2014 (Tables 3, 5).
In other words, the foreign worker share of employment was over 30 times larger in Singapore than Japan. Singapore has a relatively large number of foreign workers for at least two easily understood reasons. First, despite being a wealthy economy with per capita GDP (measured in either U.S. dollars or at purchasing power parity [PPP]) exceeding Japan’s in recent years, key industries such as construction, sea transport and other entrepôt-related industries, domestic work, and some manufacturing remain relatively unskilled-labor intensive, creating strong demand for relatively cheap foreign labor. Second, being a relatively small city-state, Singapore’s pool of resident workers is much more limited than Japan’s. As result, Singapore’s labor market was tighter than Japan’s with higher labor participation rates and lower unemployment rates in every year listed in Table 3. Recognizing the dependence of key industries on foreign workers, Singapore’s government has tried hard to avoid excessive restrictions on the use of foreign workers.
Because a very large number of workers are foreign, Singapore’s immigration system is designed to be as simple to administer as possible. This is first evidenced by the primary criterion for the employment pass (EP, designed for skilled workers) or the S Pass (designed for semi-skilled workers) eligibility, which is simply the level of income a foreign worker earns ($3,300 or S$2,200 per month, respectively, in recent years; Table 6). In recent years, the share of workers with EPs grew from 11 percent in 2009 to a peak of 15 percent in 2011 and then fell back to 13-14 percent. The S Pass share grew relatively rapidly, from 8 percent in 2009 to 13 percent in 2014-2015. Like Japan, Singapore’s policies have also emphasized attracting skilled workers, especially since the late 1990s (Ito 2003; Low 2001), but skilled workers remain a relatively small portion of all foreign workers.
13
Rather, relatively unskilled workers in construction constituted the largest published category of foreign workers in 2010-2014, slightly under one-quarter of the total (Table 5).
Predominately unskilled domestic workers accounted for another 16-18 percent. The heterogeneous group of “other workers” with work permits was actually the largest, accounting for 33-37 percent of all foreign workers during this period. Although Singapore does not publish more details by industry or nationality, in a 2014 parliamentary reply, Manpower Minister Tan Chuan-Jin said the “bulk of them [foreign workers] work in the construction and marine sectors” (Tan 2014). This statement could imply that the number of workers in the marine sector exceeds the number of domestic workers, and is close to the number in construction; on the other hand, domestic workers are often considered separately, so the reply may refer to work pass holders and exclude domestic workers, which might imply a substantially lower number in the marine sector. Most marine sector jobs are probably in the large marine transport industry and related logistics industries. The key point is that the vast majority of most work permits, which accounted for 82 percent all foreign workers in 2008 and 73-75 percent in 2010-2015, were for relatively unskilled workers.3
The government is aware of the pressures the presence of unskilled and semi-skilled foreign labor puts on local workers, especially those who are relatively unskilled.
Correspondingly, it discourages use of unskilled foreign labor through levies. Levies and
“dependency ceilings” which define foreign workers shares at which various levy rates kick in, vary among industries and skill classes. They are relatively low for highly skilled workers and in industries where local workers are thought to be relatively scarce; they also depend on the number of foreign and local workers in a firm (Yap 2014, pp. 234-237). Quotas have also been used to regulate the number of foreign workers, though the government usually prefers
3 According to Yap (2014, p. 223), data from the 2000 population census “show that most foreigners (75%) work in three unskilled and semi-skilled occupations: cleaners, laborers and related workers; plant and machine operators and assemblers; and production, craftsmen and related workers categories” (see also Table 2 on p. 224).
14
price signals (e.g. levies) over than quotas. Levies, dependency ceilings, and quotas are all adjusted periodically to reflect changes in economic conditions.
2d: Migration and Foreign Workers in Malaysia
Malaysia shares a colonial history with Singapore and a brief period as part of the Federation of Malaya in 1957-1965. Correspondingly, Malaysia’s political institutions and economic policies are similar in important respects. Malaysia also shares a history of large immigration from surrounding Asian economies. However, in contrast to Singapore, Malaysia is a geographically vast economy, with important differences between the relatively small, resource-based economies of Sabah and Sarawak and the large economy of Peninsular Malaysia where manufacturing and modern services are more important.4 The migration and foreign worker situation is particularly different in Sabah, where borders with Indonesia and the Philippines are porous, and irregular (including illegal) migration remains relatively prevalent (Kanapathy 2008).
Agriculture, plantation agriculture in particular, is an important employer of foreign workers, accounting about one-quarter of regular foreign workers in 2000-2009 and 28-29 percent in 2011-2013 (Table 7). Many of these workers probably come from Indonesia to work in Sabah and Sarawak, which border Indonesian provinces on Borneo (Kalimantan in Indonesian). However, most foreign workers, probably including most Indonesian workers, are employed in Peninsular Malaysia.
As mentioned above, Indonesia accounted for very large, but declining shares of regular foreign workers in Malaysia, three-fourths in 2000, two-thirds in 2005, and 44-53 percent in
4 In 2010, for example, agriculture and mining accounted for 27 and 24 percent, respectively, of GDP in Sabah, as well as 14 and 26 percent, respectively, in Sarawak. In contrast these shares were only 8.8 and 0.3 percent, respectively, in Peninsular Malaysia (Malaysia, Department of Statistics 2015, p. 10, Table 3). Note also that the Peninsula accounted for 76 percent of the sum of state GDP in this year, Sarawak 11 percent, and Sabah 7.7 percent (another 7.6 percent is from mining that cannot be allocated to any particular state).
15
2008-2013 (Table 7). Indonesia is also the largest source of the large number of irregular foreign workers, more than 70 percent according Kanapathy (2008, p. 2). By 2010-2011, the number of irregular workers was estimated at approximately 2 million 2010-2011 (World Bank 2013, pp. 3-4), which is larger than the corresponding number of regular foreign workers reported in Table 7. Irregular migration from Indonesia is large because many Indonesians want to work in Malaysia to earn higher incomes, many Malaysian firms want to hire relatively cheap Indonesian workers, the costs associated of violating Malaysian immigration laws have been relatively low for both employers and workers (i.e., legal enforcement has been lax). Indonesians share common ethnicity, language, and religion, with many Malaysians and it relatively easy for them to remain inconspicuous. Indeed, irregular migration from Indonesia was tacitly allowed in the 1950s and 1960s, partially in order to increase the ethnically Malay population and its electoral influence (Kanapathy 2008, p. 1).
Most irregular workers are not authorized to work in Malaysia and many entered the country illegally. However, there are many refugees who have been issued official identification documents (renewable annually) and are allowed to work, but who have no official migration or foreign worker status under Malaysian law. According to Kanapathy (2008, pp. 4-5), the largest group (68,000) includes refugees who came from Mindanao in the southern Philippines to Sabah in the early 1970s to escape civil war, and whose children were born in Malaysia.5 There were also about 50,000 refugees in Peninsular Malaysia and about 40,000 registered with the United Nations’ High Commission for Refugees (20,000 Acehnese, 10,000 Muslim Rohingyas from Myanmar, and 10,000 other minorities from Myanmar).
Although agriculture is large, the largest number of legal foreign workers are employed by manufacturers, its share of the foreign worker total fluctuating from 38 percent in 2000 to 32 percent in 2005, 35 percent in 2008-2009, 39 percent in 2012, and 33 percent in 2013 (Table
5 According to World Bank (2013, p. 3), the number of refugees from the Philippines was about 60,000 in 2009.
16
7). There were fewer foreign workers in construction and services, but they grew relatively rapidly in 2000-2009, from 8 to 16 percent and 7 to 11 percent of the total, respectively. On the other hand, the share of domestic workers has decreased more or less continuously from 22 percent in 2000 to 14 percent in 2008, and 9 percent in 2013.
After Indonesia, Nepal or Bangladesh were the second and usually the third largest sources of regular foreign workers (Table 7). Nepal’s share was zero in 2000 but jumped to 11 percent in 2005, after a bilateral agreement allowed Nepalese to apply for employment passes;
Nepal’s share then increased to a peak of 19 percent in 2012, but fell back to 17 percent in 2013. Bangladesh was the source of large shares in 2000, 2008-2010, and 2013 (14-20 percent), but much smaller shares in other years. Shares of Myanmar and India rose from 0 and 2 percent, respectively, in 2000 to 7-9 and 5-6 percent, respectively, in 2008-2013.
Despite being a neighboring economy and a large source foreign workers in other host economies, the Philippines accounted for small shares of regular workers (1-3 percent) and limited estimates of irregular workers (1.9 percent) for 2004-2005 by Kassim et al. (2014, p.
242).6 However, if all irregular workers in Sabah are included, the Philippines was probably one of the larger sources of foreign workers in Malaysia according to World Bank (2013, p. 5).
The nationality distribution of regular foreign workers reflects conspicuous immigration policy biases. For example, Indonesian males are currently not allowed to work in manufacturing and females from the Philippines are not allowed to work in any industry (Malaysia, Immigration Department 2015). Prior to 1987 Indonesians were also barred from working in agriculture (Athukorala and Devadason 2013, pp. 251-254). More generally, Malaysia’s migration policy is heavily influenced by bilateral agreements with supplying economies. At present, foreign workers are only allowed from one of 15 approved source
6 Estimates of the number of irregular workers by Kassim et al (2014) are much smaller than corresponding estimates by World Bank (2013).
17
countries, and restrictions on worker activities, as well as various fees and levies, depend on a worker’s nationality, industry, and sex (World Bank 2013, pp. 233-235).
Similar to Singapore, Malaysia also uses both levies (and other fees) and quotas to influence the level of foreign workers. However, partially because Malaysia is larger and less centralized than Singapore, the legal structure for regulating foreign workers is less unified than in Singapore. For example, immigration laws are administered by the Immigration Division of the Ministry of Home Affairs, while labor laws are implemented by the Ministry of Home Affairs. This division of authority is similar to Japan’s, for example. On the other hand, Malaysia does not recruit skilled workers from abroad as actively as Japan or Singapore, partially because Malaysia’s economic policies have long emphasized allocating high-paying jobs to ethnic Malays rather than to other local ethnic groups and foreigners.
3. Labor Markets Effects
This section summarizes existing literature on the labor market effects of foreign workers in Japan, Singapore, and Malaysia, making comparisons to related literature for other economies as relevant. The focus is on the extent to which foreign workers substitute for or complement local workers, because the degree of substitution determines the direction and size of many relevant effects. As Borjas (2003) and Borjas et al. (2011) emphasize, to the extent that foreign labor substitutes for local workers, increases in foreign labor are likely to lead to lower employment and wages for competing local workers. On the other hand, there is also substantial empirical evidence that foreign workers complement local workers and can contribute to increases in employment, productivity, and wages for the local firms and workers involved (Dadush 2014; Kerr and Kerr 2011; Ottaviano and Peri 2008; Peri 2012).
Most direct estimates of labor market effects focus on wages, using modified Mincer equations, which postulate that wages are largely determined by an individual’s experience
18
(usually squared) and human capital investments (including education and training). However, because many analyses are conducted using data at the plant, firm, industry, and/or region level, but not observations on individual workers or their households, this basic formulation often has to be modified, creating the potential for missing variable bias.
3a. Employment Effects
World Bank (2013) is a detailed study of the effects of foreign workers on Malaysia. It focuses first on evaluating the effects of migration on local employment using panels of worker data taken from Malaysia’s labor force surveys over the last two decades. Instrumental variable estimates are used to account for endogeneity and “the main result indicates that 836 new full-time jobs and 169 part-time jobs are created for Malaysian workers for every 1,000 new foreigners that enter a given sector in a given state” (p. 42).
When separate estimates are performed for agriculture, manufacturing, and services, results indicated that “on average 671 jobs are created in agriculture and mining, about 193 jobs in manufacturing, and 741 jobs in the services sector, if an additional 1,000 foreigners enter each of these sectors, but that “the effect in manufacturing is not statistically significant while it is so in the other sectors” (World Bank 2013, p. 44). When age groups are distinguished, “an additional 1,000 foreign workers in an average sector have no affect on 15 to 19 year-olds, but 207 new jobs are created for 20 to 29 year olds, 303 new jobs for 30 to 44 year olds, and 340 new jobs for those over 45 years of age” (p. 45). When worker gender and type are distinguished, “an additional 1,000 migrants in a given economic sector increases overall male employment by 604 workers but the effect on women is only an increase of 205 people”
(p. 47); effects on part-time work were much more even, however, 91 men versus 80 women.
When workers are grouped by educational level, the effects were positive and largest for those with post-secondary education (STPM), with 100 new foreign jobs generating 366 new
19
jobs (p. 48). Positive and significant effects were also large for workers with lower secondary education (PMR, 320 new jobs), and upper secondary education (SPM, 182 new jobs), but smaller and or insignificant for workers with certificates or diplomas and for university graduates. In contrast, the effects were negative and significant (a loss of 114 jobs) for workers with primary education or no education. According to the authors, this result was expected because workers with primary education or less “are directly competing with foreign workers who also have very low levels of education”.
3b. Wage Effects
The only study I know that examines the effects of foreign workers on Japanese labor markets is Nakamura (2010), which summarizes results from a more detailed, Japanese language study. He (pp. 71-73) first asks if average wages for four classes of workers (high school and college graduates distinguished by sex) in a region in 1991, 1996, and 2001 were affected by the ratio of foreign workers to Japanese workers in the previous year, after controlling for employee attributes such as age, tenure, and educational attainment of enterprise employees, as well as firm attributes such as size, the gender ratio of workers, and the share of manufacturing firms in the total. Results (Table 8, items 1a, 1b) indicate that the foreign labor ratio had no significant effect on wages for female high school graduates, but there was a weakly significant (at the 10 percent level) negative effect for female university graduates, which became stronger in 1996 and 2001. For male high school graduates, there was a significant positive effect which was weaker in 2001 than in the first two years. For male university graduates, coefficients were usually insignificant, though there was some indication significantly positive effects for 2001.
Nakamura (2010, p. 73) interprets these results as indicating that “the introduction of foreign workers can serve to boost wages for males more or less and to lower wage or have no
20
effect for females”. It is also important that the effect of foreign worker presence on regional wages is generally weak, with significant, positive effects for male high school graduates and weakly, significant negative effects for female college graduates being exceptions. Moreover, these results, especially for high school males, could be considered counterintuitive in view of the evidence showing that many foreign workers are likely to be relatively unskilled competitors for jobs occupied by high school graduates in Japan. Similarly, the result for female college graduates can be considered counterintuitive if this group is considered to be relatively skilled. On the other hand, the result may reflect the fact that Japanese firms often relegate even relatively well-trained females to relatively unskilled occupations. Another possibility is that skilled and unskilled groups of foreign workers are both large, making it difficult to sort out the effects of foreign labor without grouping foreign workers by skill.
Nakamura (2010, pp. 73-75) then estimates starting wages of plants by educational level, occupation, and sex as a function of factors affecting demand for new workers and the number of new university graduates in the prefecture to capture supply influences.7 A dummy variable identifying plants hiring foreign workers is added, and estimates were performed using ordinary least squares (OLS), random effects, and Tobit estimators. Results of all estimates were qualitatively similar, yielding positive and highly significant coefficients on the foreign worker dummy (Table 8). In other words, establishments that hired foreign workers tended to pay more than plants without foreign workers. The size of this effect was largest for male college graduates in production jobs, followed by female college and junior college, graduates in non-production jobs, and then both male and female high school graduates in production jobs.
7 The factors affecting demand for new workers were the number of regular employees, the ratio of overtime hours to regular worker hours, the average age of employees, the ratio of regular employees, and the ratio of full-time employees in the previous period. As the author points out, this model is inappropriate if labor markets are perfectly competitive. However, Japanese firms have probably exercised substantial market power when hiring new graduates, especially during the period studied (the post-bubble period of 1993-2003).
21
Although he doesn’t estimate overall employment effects, Nakamura (2010, pp. 74, 76-77) does estimate the effect foreign worker presence has on local, male worker decisions to relocate to regions with relatively low foreigner shares. In this model, the dependent variable is a dummy identifying workers that moved to regions where the share of foreign residents was lower than the prefectural average within five years of the observation. The influences of individual (age, age-squared) or household characteristics (number of household members) were accounted for, as were regional characteristics (with region dummies). A fixed effects estimator is also used to control for unobservable, time-invariant characteristics of workers.
Because there are a large number of long-term (Zainichi) South and North Korean residents, two measures of foreign resident shares were used, one including these long-term residents and one excluding them.8 Perhaps not surprisingly, the results are much stronger when the foreign resident share excludes these long-term residents. When measured five years previous to the year of relocation (because relocation is costly and takes time), an increase in the foreign resident share in a region leads to a significant decline in the number of local workers for university and junior college graduates and for junior high and high school graduates.
When the foreign share is measured contemporaneously, this effect remains significant for junior high and high school graduates but not for university and junior college graduates.
Nakamura (2014, 78-80) also estimates a version which includes interaction of the foreign worker share and average years of education. The coefficient on this interaction term was generally negative and significant, indicating that “wage disparities among workers with different education levels are narrower with the introduction of more foreign workers” and that “wages for relatively less skilled workers are higher”. In all estimates, the coefficients on the interaction term were indeed negative and significant.
8 Note that the data on Korean residents and workers in Tables 2 and 4 only include South Koreans, who constitute the vast majority of all Koreans.
22
For Singapore, the only known statistical analyses of the effect of foreign workers on wages are simplistic. For example, Abella (2013, pp. 19-21) emphasize that a simple correlation of wage growth rates and foreign worker growth rates for 1990-2000 in 8 major sectors, which was negative (-0.64) and weakly significant at the 10 percent level. Similarly, Tat and Toh (2014, pp. 8-9) use a simple graph to argue that the “falling wage share has been associated with periods of strong economic growth”. However, these assertions are not robust because they rely on observations from small samples at high levels of aggregation and fail to account for other influences on wage growth rates or the wage share. More rigorous analyses of worker-, plant-, or firm-level data that account for other influences on wage determination could easily yield substantially different results, but I know of no such studies.
Thangavelu’s (forthcoming, Table 3) provides a more rigorous analysis of productivity effects in a disaggregated industry-level panel of manufacturing industries and includes data indicating that foreign workers accounted for 38 percent of employment in sample industries in 1998-2002, 42 percent in 2003-2008. However, the average wage for foreign workers remained unchanged between the two periods (at S$1,993-S$1,995), while the average wage for local workers increased 19 percent (to S$4,189 in the latter period). In short, although foreign worker shares increased and foreign worker wages stagnated, local worker wages continued to rise. On the other hand, this evidence does not indicate whether local wages would have risen more rapidly if there had been fewer foreign workers.
There is a growing number of studies that evaluate the effects of foreign workers on wages of Malaysian workers (Athukorala and Devadason 2011, 2013; Tham and Liew 2014; World Bank 2013). Rather than estimate wage effects directly with Mincer-type equations, World Bank (2013) uses recent (2007-2010) labor force data to estimate the effects of foreign workers on wages indirectly by calculating how migration-induced changes in employment affect wages in Malaysia. The main conclusion of this exercise is that “changes in
23
employment caused by increases in immigration to a specific region and industry do not lead to changes in the wages of Malaysian workers” (p. 50). In other words, “results suggest that a sufficient number of Malaysian workers are highly mobile across industries (and possibly also regions) so as to allow wages to rapidly equalize”.
However, as with employment effects, wage effects differ somewhat among subgroups.
First, “increases in demand for Malaysian workers due to immigration do not result in changes in relative wages across industries” but “they do increase the overall wage level in Malaysia”, with positive effects “most apparent when foreigners work in low-skilled services and agriculture”. When workers are distinguished by personal characteristics, results suggest increased immigration increases male wages but has a very small effect on women’s wages (p.
51). Likewise, wage elasticities were large and positive for workers with post-secondary and lower secondary education, but negative for workers with primary education, and small but positive in other education groups.
Although their primary focus is estimation of foreign worker effects on labor productivity and unit labor costs, Tham and Yiew (2014) also use plant-level data from Malaysia’s manufacturing censuses and surveys for 2000-2006 estimate the effect of foreign worker shares on plant wages.9 Their specification contains only basic plant-level controls: capital- intensity, capital size, and dummies for (majority-) foreign plants, plant age, market concentration, and competitiveness (whether a plant had negative profits or not). Most notably, the estimates don’t account for the influence of worker education, which Ramstetter (2014) shows is an important determinant of wages when using the same data for 2000-2004. On the other hand, Tham and Yiew (2014) have the important advantage of access to two alternative measures of foreign worker presence: (1) the foreign worker share of total workers and (2)
9 Note that Tham and Yiew (2014) and Athukorala and Devadason (2012, 2013) discussed below mistakenly refer to these as firm-level data or their industry-level compilations of firm- level data. However, they are actually plant-level data and the distinction is important in Malaysian manufacturing, because many industries are dominated by large, multi-plant firms.
24
foreign shares of six alternative occupations.10 Models are estimated by instrumental variables, using industry- and plant-level fixed effects.
Results of the first specification suggest that the coefficient on the total foreign worker share was negative and highly significant (at the 1 percent level; Tham and Liew 2014, p.
151), but results from the disaggregated specification indicate that the foreign share of only one occupation, plant and machine operators and assemblers employed through contracts, was negative and significant at the standard 5 percent level. The coefficient on the foreign share of directly employed plant and machine operators and assemblers was also negative and weakly significant at the 10 percent level. On the other hand, on the foreign shares of the other four occupations, which generally demand higher worker skills, were not significant determinants of wages. In other words, results suggested that increased shares of relatively unskilled operators and assemblers led to decreases in average plant wages, as would be expected if foreign labor substituted for local workers in these occupations.
Athukorala and Devadason (2012, 2013) use industry-level compilations of the same plant- level data to estimate the effects of foreign worker shares on average wages in alternative industry-level panels covering 1992-1999 (excluding 1998 for which the manufacturing survey was not published) and 2000-2008 or 2000-2005.11 Estimates for 2000-2008 control for industry size (real value added), capital intensity, skill intensity (the share of professionals and managers in employment), average firm size (employees per plants), foreign ownership (share of majority-foreign plants), the share of exports in gross output, industry concentration, and a dummy identifying industries where national trade union membership is prohibited.
Instrumental variables estimates using random effects or fixed effects are used, and alternative estimates are made for the average wage of all workers as a function of the total foreign
10 This removes a potentially important missing variable problem in estimates by Ramstetter, who used a dataset from which data on foreign workers were redacted.
11 Results in Athukorala and Devadason (2012) cover through 2008 and are the focus here.
25
worker share and the average wage of unskilled workers as a function of the foreign share of unskilled workers.
All estimates indicate that the coefficient on the foreign share was negative and highly significant (Athukorala and Devadason 2012). In other words, wages tended to be lower in industries and years with relatively high foreign worker shares, after the influences of the controls are accounted for. Similar results are obtained using a more limited set of controls for 2000-2008, but not for 1992-1999, when the foreign worker share was a significantly negative determinant of unskilled worker wages, but not wages of all workers. Correspondingly, the authors conclude “We do find a statistically significant negative impact of foreign worker dependency on real manufacturing wages, but the magnitude of the impact is small. Real manufacturing wages seem fundamentally embedded in the structure and performance of domestic manufacturing, with the influx of foreign workers having an impact only at the margin” (p. 1508).
Both plant- and industry-level results from the manufacturing data by Tham and Liew (2014) and Athukorala and Devadason (2012, 2013) thus suggest foreign workers contributed to lower plant- or industry-level wages in manufacturing plants, but analysis of the labor force data by World Bank (2013) suggest that foreign workers usually contributed to increased wages of local workers. Although apparently opposing results, they are not necessarily inconsistent for at least two reasons. First, the measure of the wage effect differs. In the manufacturing data, the analysis focuses on the effect of average plant- or industry-level wages, while analyses using the labor force data focus more precisely on the wages of different classes of local workers. In this respect, the labor force data analyses are probably more informative. Second, as Athukorala and Devadason point out, the manufacturing data include small plants in census years (1993, 2000, 2005) only; this manufacturing sample is thus rather different from the manufacturing sample in the labor force data, which presumably
26
includes foreign workers in many small plants. This difference is important because, as in Japan, relatively small plants may account for relatively large shares of foreign workers.
3c. Productivity Effects
In addition to analyzing wage effects, Tham and Yiew (2014) also analyze the effects of foreign worker shares on unit labor costs and labor productivity in Malaysia’s manufacturing plants (pp. 148, 150). Their results first suggest that the total foreign labor share had a negative and significant effect on plant-level labor productivity. On the other hand, foreign shares are not significant at the standard 5 percent level when disaggregated by occupation.
Coefficients on foreign shares were weakly significant at the 10 percent level and negative for two relatively unskilled occupations (directly employed plant and machine operators and assemblers; clerical and related workers), but positive for managers, professionals, and executives. On the other hand, foreign shares were negative and significant determinants of unit labor costs in the aggregate specification and for technicians and professionals in the disaggregate specification, but positive and significant for directly employed plant and machine operators and assemblers and for clerical and related workers. Combining these results and results of their wage equation estimates described above, the authors conclude that
“the negative impact on labor productivity is smaller than the negative impact on total wages and salaries for all workers”, which suggests “that the use of foreign workers has helped improve the competitiveness and profitability in Malaysian manufacturing” (p. 155).
World Bank (2013, pp. 61-66) also uses census data for 2000, 2005, and 2010 to analyze the effects of the number of migrants on total factor productivity (TFP) in different size cohorts of plants in manufacturing, plantation agriculture, and construction. In manufacturing, the effect of migrants was positive and significant in large plants with 50 or more workers, but insignificant and negative in medium-sized plants with 20-50 employees. This pattern was
27
reversed in plantation agriculture with the insignificant, negative effects in medium-sized group and positive, significant effects in large group. In construction, the effect was positive and significant in large plants, but negative and weakly significant in medium-sized plants.
Finally, estimates for all plants with 5 or more workers suggested insignificant foreign worker effects in information and communications technology and in accommodation.
For Singapore, Thangavelu (forthcoming) estimates production as a function of capital, local labor, and foreign labor in a disaggregated industry-level panel of manufacturing industries covering 1998-2008. The major finding is that local workers contributed more to productivity than foreign workers (e.g., 15-27 percent versus 3-7 percent, if estimated by fixed effects, Table 4).12 Second, he found that the ratio of the contribution of local workers to the contribution of foreign workers was much larger during 1998-2002, when capital grew rapidly. This ratio was much smaller during 2003-2008 when capital grew more slowly, but still substantially larger than one, indicating a greater contribution by local workers.
In addition to examining several wage effects described above, Nakamura (2010, pp. 80- 82) examines how foreign labor affects the probability firms existed in both 1991 and 2001 or exited the sample during this decade. He finds that when Zainichi Koreans are excluded, the foreign share has a positive and significant influence on firm survival in this cross section; the effect is not significant if they are included in the foreign share. When terms interacting the foreign worker share with two factor intensities (ratios of unskilled to skilled labor and of labor to capital) are included, the direct effects of changes in the foreign share are positive and significant when the share excludes Zainichi Koreans but not when they are included. On the other hand, when the foreign share includes this group the interaction terms become positive
12 Qualitatively similar results are also obtained if a differenced production function is estimated or a GMM estimator used (Thangavelu, forthcoming, Tables 5-6). Noor et al., estimate a similar equation in time series for total Malaysian manufacturing in 1972-2005 and find that the output elasticity of local labor was larger than that of foreign labor. However, their sample is very small and results suggest that the output elasticity of capital was significantly negative, which basic economic theory suggests is unrealistic.
28
and significant (for labor intensity) or weakly significant (for the unskilled labor ratio), even though direct effects are insignificant.
3d. Construction Workers
As described above, Malaysia and Singapore rely very heavily on foreign labor in construction. In Malaysia, the number of foreign workers in this industry increased rapidly from 68,000 in 2000 to 282,000 in 2005, and then fell to 235,000 in 2010 (Table 7). Because the total number of construction workers increased slowly (20 percent) in 2000-2005 but much more rapidly (77 percent) in 2005-2010 (Malaysia, Department of Statistics 2013), the increase and subsequent decline of the foreign worker shares in this industry were even more pronounced: from 15 to 51 percent and then back down to 24 percent. Because 2005 and 2010 were census years but 2000 was a survey year, these data may overstate the growth in early period but measure growth in the latter period relatively accurately. According to the World Bank study (2013, pp. xvi-xvii), Malaysia’s construction industry “is largely dependent on foreign workers, most of them are low to medium-skilled, and many acquire their work knowledge when they are hired by assisting more experienced workers”.
In Singapore, the number of foreign construction workers grew 7.9 percent in 2008-2010, between 6.6 and 11 percent annually in 2011-2013, but only 1.2 percent in 2014 to 323,000 (Table 5). However the number of resident construction workers declined in 2008-2010 and annually thereafter except in 2012 when there was a small increase (Singapore, Department of Statistics, various years). If the total is estimated as the sum of foreign and resident workers, the share of foreign workers in construction employment grew from 69-70 percent in 2008 and 2010 to 73-74 percent in 2011-2012 and 76-77 percent in 2013-2014.13 Because the number of local workers is very small in Singapore (98,200 in 2014, down from peaks of
13 The sum slightly overestimates the total (resulting in slight underestimation of the foreign share) because a few workers are both foreign and residents, and thus double-counted.
29
105,500 in 2008 and 104,500 in 2012) foreign worker shares in construction were much larger in Singapore, grew relatively steadily in Singapore, and fluctuated in a wide range in Malaysia, growing rapidly in 2000-2005 before falling back precipitously in 2005-2010.
In contrast, the number of foreign workers was much smaller in the Japanese construction industry, 20,560 in 2014, up from an average of 13,140 in 2010-2012 and 8,360 in 2008 (Table 4). Because Japan’s construction industry is much larger than construction in Malaysia or Singapore, foreign workers shares were well under 1 percent, but more than doubled in 2008-2014, from 0.15 to 0.39 percent.14 Thus, it seems likely that many Japanese construction firms could reduce costs considerably by hiring more foreign workers at wages that could benefit those workers.15
On the other hand, the costs of using foreign labor are likely to be a bit higher than in Singapore or Malaysia because of differences in language, human resource management peculiarities, and government regulation. To work effectively, the foreign worker has to learn Japanese and how fellow workers and bosses interact with each other. Because learning Japanese is a costly process, someone (usually both the employer and worker) have to bear the cost (Chapple 2014). Language is also important to understanding interpersonal relationships in Japan, and Japanese firms, labor markets, and policy bureaucracies are often organized somewhat differently than elsewhere, which can create additional adjustment costs, most of which have to be borne by the foreign worker. It is also necessary to consider several potential externalities, particularly those related to safety, which affect the construction industry particularly severely.16 In short, the organization and regulations of the construction
14 The total number of construction workers is taken from February 2016 labor force survey estimates for October: http://www.stat.go.jp/data/roudou/longtime/zuhyou/lt01-c30.xls.
15 Job-applicant ratios presented by Ganelli and Miake (2015, pp. 7-8) suggest that worker shortages in Japan are particularly severe for construction engineers, civil engineers, general construction workers, and electrical construction workers.
16 For example, severe public injury or death could result if safety codes are violated and the resulting building becomes unable to withstand strong earthquakes or other such
30
industry seems substantially more complex than in Singapore or Malaysia, or most English- speaking economies, for example, and this creates relatively large adjustment costs.
Intuitively, the story in the construction industry also reflects several important principles discussed above. Foreign and local workers are much more likely to substitute for each other than workers in most other industries. Because there is a need to maintain quality and meet safety standards, it is important for all workers to be able to perform similar tasks to similar standards; in other words, the industry seems to value skill homogeneity among its workforce more than others. Skill homogeneity also reduces the costs and increases the potential benefits of unions to workers and union opposition to the use of foreign labor has been an important reason that foreign workers are not numerous in Japanese construction. This opposition seems likely to continue for the foreseeable future.
The Singaporean case is analytically similar because local labor is now so expensive that decreasing reliance on foreign labor would most certainly impose substantial costs on its construction industry and Singaporean consumers of its products and services. However, Malaysia, local labor is not that expensive and there is a substantial literature questioning the extent of the benefits of foreign workers in the industry. For example, based on structure interviews, Abdul-Rahman, et al. (2012) identify (1) “over-dependence on foreign workers”, (2) “increment in criminal activities or social problems”, and (3) “existence of illegal workers”
as the major negative impacts of foreign workers in Malaysian construction. However, these are three general problems with workers in many other industries.
3f. Skilled Workers
In recent years, Japanese policymakers have tried to facilitate increased use of foreign labor in relatively skilled occupations such as healthcare, engineering, and other professions. It is calamities. On the other hand, there have been well-known cases of construction firms abusing their foreign workers in one way or another.
31
also probably important to emphasize that it has always been relatively easy for qualified foreign workers to get permission to work in Japan if the foreign worker can convince an employer to help him or her meet three simple, but sometimes difficult to fulfill, criteria: (1) secure employment in a properly registered firm, (2) help the worker to complete the necessary paperwork for a work visa application, and (3) find an appropriate guarantor for the worker.17 It is also much easier for applicants if they have full (e.g., 4-year) university degrees.
Because these basic requirements remain unchanged, recent changes in the visa system are to some extent cosmetic. Correspondingly, as Oishi, (2014, p. 422) emphasizes, for several decades now, “Japan adopted quite an open policy for highly skilled migrants for some time compared with other industrialized countries”.
The more conspicuous, recent changes to the system include the adoption of a point system which took effect in 2012 and prioritizes foreign workers for various special permissions and expedited processing, for example. As Oishi (2014, p. 421) emphasizes, the point system
“does not serve as an entry-screening mechanism” but rather as a “prioritizing mechanism for special incentives”. Moreover, as Oishi also emphasizes, Japanese efforts to promote use of skilled foreign workers began in the early 2000s and have evolved gradually since. Unless basic visa or professional requirements are changed, Oishi is probably correct that these policy developments will have only limited, marginal effects on the number of skilled immigrants, but they do represent an important policy change in favor promoting the use of foreign labor, perhaps for the first time in Japanese history.
One of the more difficult problems many skilled foreign workers in Japan face is how to get their foreign credentials recognized by the Japanese authorities. Some of the most obvious differences are in the legal and medical fields, but similar difficulties are present in many
17 Some qualified foreign workers have difficulty finding a guarantor in Japan. Guarantors in Japan can be held financially liable for losses resulting from a foreign worker’s actions, for example. Hence, becoming or finding a guarantor is a costly process.
32
professions. To some extent, there is certainly scope for harmonization of Japanese standards and credentials with more standard regulations used abroad (Ducanes 2013). In other cases, it is less clear whether such harmonization is practical or beneficial, especially when Japan’s safety and health standards, which are often relatively strict, might be compromised.
The fact that many skilled workers produce services that must eventually be communicated or supplied in the Japanese language can create substantial costs for the foreign worker, his/her Japanese employer, and/or the predominantly Japanese consumer. In this respect, Japanese employers often find it most efficient (least costly) to hire foreign workers with Japanese language ability, even though this is a rather small pool of workers. Alternatively, if the firm is large enough to warrant the expense, it may hire foreign students after they graduate from university and train them to assist foreign specialists in various fields.
When considering markets for skilled workers, the key economic point is that markets are rarely perfectly competitive, because both firms and workers can often exercise substantial market power. As a result, market structure can resemble bilateral monopoly or bilateral oligopoly, with both employers and workers having relatively few alternatives as well as the ability to influence the terms of any work contract or arrangement. Market heterogeneity is amplified by substantial differences in the nature of skills relevant to various labor markets, and corresponding differences in regulations among these markets. Correspondingly, it is far from clear if free competition will lead to an optimal outcome. On the hand, competition is often severe enough that regulators are not usually able to improve outcomes by interfering in the market place (i.e., poor regulation could easily raise costs but create no benefits).
In this respect, Oishi (2014) points out that one of the more important contributions of the 2012 point system and related documents as the clarification of the definition of (foreign) skilled labor as follows (p., 429):
1. Those who are in a complementary relationship with domestic labor force and capital, and cannot substitute them;