: An international comparative research
based on field survey
Chief Editor,
XUE JUN(薛せつ
軍
ぐん
)
Introduction ……… Xue ( 1) Chapter1 Re-Thinking of Middle Income Trap:
Sources of Economic Growth ……… Xue (11) Chapter2 Economic Growth in the Philippines:
An Analysis of Middle Income Trap ……… Umali (41) Chapter3 Economic Growth in Brazil:
from the Brazilian Miracle to BRICs through
Lost Decades ……… Fujino (71) Chapter4 Rise of Korea:
Model or Exception? ……… Ohara (85) Chapter5 The plight of China's Economic Growth:
Overcapacity ……… Wang (99)
Chapter6 Expanding Domestic Demand in China:
Opportunities and Prospects ……… Xue (125)
Postscript ……… Xue (141)
執筆者リスト
監修者:薛軍 執筆者一覧:
薛軍 長崎大学教授 Introduction、Chapter1、
Chapter6、Postscript
Celia L. Umali 長崎大学教授 Chapter2
藤野哲也 長崎大学名誉教授 Chapter3
小原篤次 長崎県立大学准教授 Chapter4
王晋之 長崎大学博士 Chapter5
Introduction
1.Imagery of Middle Income Trap and its fundamental
reasonFor the concept of the middle-income trap, its proposition, definition, con- notations and so on, see Chapter1.In short, the middle-income trap is not a very rigorous academic concept, but refers to a kind of objective phenomen- on. When the economic growth and per capita income of countries reach the middle-income level, many of them remain stagnant; the typical case is the Latin American countries. Therefore the middle-income trap is also called the Latin American disease .Of course there are economies which have crossed the growth trap stage smoothly. The typical case is Korea and Tai- wan.
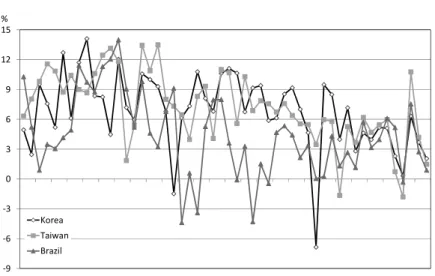
Figure1shows the most typical case for economies in the world. From the figure we can see that the growth of Korea and Taiwan continued to increase, and obviously they changed from low-income countries into middle-income countries successfully, then crossed the middle-income trap smoothly, and entered into the ranks of high-income countries. In contrast, Brazil, South Africa and Philippines which once were considered by the world as countries with a lot of potentials bogged down in the middle-income trap inextricably due to various reasons for a long time. Brazil's per capita income was US$
1400in1965and its economy grew9%annually for more than ten years. Af- ter the per capita reached US$4600in1979,the growth ceased abruptly. By 2005,the per capita income is only US$5000;meanwhile the annual growth rate for1979‑2005was only0.3%.
Why did so many promising economies bog down into the middle-income trap inextricably at the end? Why have economies such as South Korea, Taiwan which have small territories and scant natural resources performed
extraordinarily? On the surface, the causes of the middle-income trap vary, for example, the disorder in the economic and social transformation, the gap between rich and poor, the defects of the financial system and capital market, disappearance of population bonus, and social unrest. In fact, each country has its own shortcomings and difficulties. The above examples are the phenomenon rather than the cause of the middle-income trap. What is the root cause?
When the World Bank praised the East Asian miracle, Krugman did not regard it as right. He pointed out that the East Asian miracle is not a miracle, but just a growth that relies on a large number of inputs of capital and labor.
It is similar to the Soviet Union's growth model that is not sustainable and will collapse eventually. Although his prediction is not accurate, Krugman's hypothesis is economically reasonable.
The economic operation model of an economy which depicts change from the rank of the original low-income country into the rank of middle-income
Figure1.Levels of Per Capita GDP in5countries,1950‑99 (1990 international Geary-Khakis, US$)
Source: Angus Maddison, The World Economy: A Millennial Perspective (Development Centre Studies),OECD(June12,2001)
country successfully may not be suitable for leaping from middle-income to high-income level. When the marginal benefit of labor and capital begin to decline a great deal, the contribution of innovation of knowledge and technol- ogy to economic growth will improve a lot. Various case analysis and studies have proven that total factor productivity(TFP)is the key point to success- fully move across the middle income trap(see Chapter1).
2.
China's economic growth: Yifu Lin's optimism and Krugman's2
propheciesSo far, China has made remarkable achievements. Although in the past 30years, China has crossed the poverty trap, but we cannot guarantee that it will succeed again in crossing the middle-income trap. We presented this question based on the following two-point argument.
1)In the first chapter I will elaborate that the original motivating factors of economic growth are labor, capital, technology and system. Entering into the middle-income stage, disappearance of population bonus and decreasing ef- fect of capital gains have gradually become prominent and growth momen- tum began to shift relying on technology and system. But now China just lacks these two strengths.
2)Regardless of resources and environmental problems, currently in China, the trouble is that it is at an awkward stage of losing its competitive advan- tage. That is to say, on one hand, the World Factory is now gradually losing the advantage of low cost due to the rapidly increasing labor cost. On the other hand, there is a considerable gap between China and the developed countries in the field of high value added products.
As to whether China can cross the middle income trap or not, the key point is to see whether it can further exploit its comparative advantages and deepen reform, especially reform of the system(see Chapter1).
2‑1 Representative of China's economic optimism: Professor Lin, Justin Yifu
Discussion on the trend of China's economy has been very heated. There are a variety of views about whether China will fall into the middle-income trap and inextricably bog down. Lin and Krugman are the two representative scholars.
Professor Lin, Justin Yifu who once served as the chief economist of the World Bank is a representative of the optimistic perspective. Lin(2012)1 presents the theoretical framework in a state of endowments, comparative advantage, viability, strategy and economic development transformed and developed out of his New Structural Economics that is referred to as the anal- ysis framework of NSE. This method is intended to provide a theoretical ba- sis of the economic development for all developing countries including China.
When China's economic growth rate has been falling, on various occasions Professor Lin said that China could maintain8%per year of growth potential in the next20years. The possibility of rapid growth comes from what he called Subsequent Advantage Theory.
Lin(2013)2thought that continuous innovation in technology and upgrad- ing of industry are the deciding factors for modern economic growth. But different from developed countries, the technology and the existing industry used in developing countries belong to a part of the world's technology and in- dustrial chain, so that the technological innovation and industrial upgrading can be achieved by imitation, introduction and integration, etc. Therefore, the risk and cost in developing countries are much lower than R&D in the de- veloped country. This is the so-called Subsequent Advantage .If China can continue to deepen reform, eliminate all kinds of structural defects, and 1 Justin Yifu Lin,New Structural Economics: A Framework for Rethinking Development and
Polic, The World Bank,2012 2 www.ftchinese.com,2013.8.28
develop the economy in line with its comparative advantage to make full use of the subsequent advantage, China can make the8%growth potential into real growth rate.
But there are also many experts who point out that Professor Lin's theory is based on many if's .Professor Sen Wei(2013)3of Fudan University points out that the NSE framework is actually institutions free ,and that only in a modern constitutional democracy, the New Structural Economics framework of Yifu Lin could be really implemented and used. However, Professor Sun Di(2013)4of the School of Business in California State Univer- sity Long Beach has raised suspicion to this optimism. He stressed that Sub- sequent Advantage as the support of China's economic growth is constantly being depleted.
2‑2 Prediction of economics authority: Professor Paul Krugman In1994,when the world is optimistic about the Asian economies, Profes- sor Krugman, the former Nobel Prize winner, criticized that the East Asian model focused on the quantity expansion but contempt of innovation of tech- nology that is the so-called built on loose sand East Asian miracle .But only half of his prediction is right, because his prophecy is built up in a limit- ed supply of labor .The other half of the prediction about China is wrong, because of not considering the existence of a large number of infinite labor supply at that time in China.
Coincidentally, this year in July, Professor Krugman published an article in the New York Times(2013.7.20)5,putting forward the arrival of the Lewis point ,that is with the end of an unlimited supply of labor era, the Chinese model is about to hit it's Great Wall .Not only that, less than a 3 www.ftchinese.com,2013.7.10
4 www.ftchinese.com,2013.9.23
5 Paul Krugman,Hitting China's Wall,2013.7.20
week ago, Professor Krugman has published the second article in the New York Times(2013.7.25)6.By quoting George Orwell'sPolitics and the En- glish Language he ridiculed the Chinese economy and government. As a Chinese, although I feel very uncomfortable with the sarcastic words of Chinese wall Ponzi bicycle and fascist Octopus song ,I do think that China should make a timely serious introspection. Especially in the last sen- tence of his article, the current Chinese government isn't that bad;but not as bad as Stalin is not, exactly, an inspiring slogan. After all, the in- efficiency, unfairness and corruption in the former Soviet Union as the representative of the State Capitalism Model ultimately ended in failure.
Professor Krugman believes that China has reached the Lewis point . Simply to say, China's rural surplus labor is decreasing. His prescription to China is that consumer spending must rise substantially to replace the posi- tion of investment, because no matter what the government does investment will sharp decline. Then he came to the conclusion that if consumption does not increase fast enough, China will experience a serious economic downturn.
About whether the Chinese Lewis point has come or not is no controversy.
However, I cannot agree completely to Professor Krugman's point view on the relationship between China's consumption and investment. I think, at present in China, consumers are important, but investment is still the driving force for economic growth, and this power can still let China maintain a steady growth rate in the future for at least10years. This is the main reason that I cannot agree with Professor Krugman's conclusion that the Chinese economy is waiting for a serious recession. The details on investment and how it will continue to lead China's economic growth will be discussed in chapter6,Expanding domestic demand: China's opportunities and prospects.
6 Paul Krugman,China's Ponzi Bicycle Is Running Into A Brick Wall,2013.7.25
3.Structure of the paper
In2011when we designed the structure of this paper, China's economy suffered serious dilemmas such as excess capacity and diminishing return on capital, etc. We attempt to analyze the success and failure of some countries experiences in order to discuss the development trend of China's future. We chose Philippines, Brazil and South Korea as comparative case studies to Chi- na. In the crossroads of the middle income trap, the performance of each country is very different. South Korea has successfully crossed it, however Philippines and Brazil suffered different fates, and their economies have inex- tricably bogged down for decades.
Before starting to write this paper, I had the feeling that it will be an analy- sis of the causes of economic growth rather than a discussion of the road map of restarting for China. At last, about whether China can cross the middle-in- come trap did not elicit a positive answer, but I still agree with the views of Professor Lin. Of course, my co-authers, Professor Fujino(Chapter3)and Professor Umali(Chapter2),may have not delved into this, while Mr. O- hara(Chapter4)who is familiar with the Chinese economy even holds differ- ent views.
To pursue a happy life is the common aspiration of people, but each coun- try doesn't have the same path of development. Now, when you go to any corner of the world, you could almost feel the presence of South Korea, just as in the past, Made in Japan was in demand everywhere. I admire great- ly Korea which has a population of only45million. It only took half a century to ascend and become an OECD member from a poor and backward agricul- tural country. In fact, lucky countries such as South Korea are not many. On the contrary, many developing countries who were expected to enter the ranks of developed countries could not realize their dreams due to economic stagnation, poverty, political chaos, corruption, and even wars and so on.
This paper consists of the introduction, chapter1 ‑6and postscript.
In the introduction, the author puts forward the core problem discussed in this paper that is why so many promising countries such as Brazil and Philip- pines finally have inextricably bogged down in the middle-income trap. While South Korea, Taiwan etc. have small territory and lack natural resources and yet can span the middle-income trap into the ranks of high income countries.
Then, the author quoted the point of view about the Chinese economic growth, discussed by two famous scholars, Lin and Krugman, put forward the question and the research subject of representation and the Sources of the middle-income trap.
Chapter1,Re-Thinking of the Middle Income Trap: Sources of Economic Growth first explains the proposition, definition and connotation of the con- cept of the middle-income trap. Then, the sources of economic growth such as labor, capital, materials and technology(i.e. total factor productivity, TFP),system are considered and analyzed one by one. According to the author, when a country's economic development reaches a certain level, a valid separatrix will arise between labor supply and capital amount, referred to as Lewis point .When the turning point is traversed population bonus will gradually disappear and capital diminishing returns will appear grad- ually. Here, the economy should maintain sustainable economic growth only by improving TFP. But generally speaking, the level of TFP reflects the rela- tive merits of an economic system. In this paper, by analysing the case of Chi- na the author considered that only continous deepening reform and opening- up can keep stable and sustainable economic growth.
Chapter2,Economic Growth in The Philippines: An Analysis of theMid- dle-Income Trap assesses the economic growth of the Philippines amid the in- dustrial restructuring in the country. Like many countries in Latin America, after World WarⅡ,the Philippines had remarkable achievements. Unfor-
tunately, due to various reasons, it has failed to escape the middle-income trap. The growth of the Philippine economy can be attributed for one to FDI
−led industrialization and export oriented growth strategy. The economy of the country has improved substantially but could not progress beyond the middle−income status. In this regard, this section studies why the country is held captive in the middle−income level and looks at factors that can help the country escape from this trap.
Chapter3deals with the subject of Economic Growth in Brazil: From the Brazilian Miracle to BRICs through Lost Decades .Brazil had al- ready achieved a high GDP growth rate of11%or more from1968to 1973 (Brazilian Miracle),then it experienced the lost decades (Foreign Financial Crises, Hyper Inflation etc.)Thus, Brazil is not a Newly Emerg- ing Market like other BRICs countries. After the economic reform in the 1990s, the Brazilian economy has been revitalized and begun to grow rapidly.
This time, the engine for growth is the creation of Middle Income Class through economic policy of cash transfer and continuous rise of minimum wage in more than ten years. But, investment for infrastructure is not enough, and this might make Brazil to face the Middle Income Trap issue.
Chapter4,Korea's Economic Success Experience: from Hangang Mira- cle to OECD Membership ,will try to answer the question which has troubled many people for a long time, namely, whether Korea is a model or an exception for economies to succeed in escaping middle-income trap. Post World War II, rapid growth has allowed only few economies to advance from relatively low level to high-income level, especially among relatively large population economies. The Korean economy is one exception. When we con- sider population and2010GNI,13economies have population of more than 20million and GNI per capita more than US$12,276in2010.The Chapter reviews the Korean economy using statistics.
Chapter5,The Plight of China's Economic Growth: Overcapacity−Anal-
ysis the Comparison between China's Steel and Port Industries with Japanese Steel and Port Industries−.Overcapacity generated in the emerging indus- tries and capital-intensive industries which are the existing leading industry resulted in a negative impact on the health-wise sustained growth of the Chinese economy, and currently, has become a bottleneck in the industrial structure adjustment of China's economy. In other words, currently over- capacity problem is a major issue in the Chinese economy but we can learn how to resolve the problem from the past Japanese industrial overcapacity ex- periences. In this chapter, with reference to the experience of Japan, we recommend strategies for industrial structure adjustment to overcome the problems of overcapacity in the Chinese steel and port industries.
Chapter6,Expanding Domestic Demand in China: Opportunities and Prospects, mainly analyses how the present China rely on domestic demand to spur economic growth. Relative to consumption, the author still believes that the continued high rate of investment is the main impetus to Chinese growth. According to the author, as in past Japan, high rate of investment is a necessary stage for the economic development of China. In addition, the author also thinks that raising the proportion of the service industry and im- proving per capita income are guarantees for expanding domestic demand.
Chapter1
Re-Thinking of the Middle Income Trap:
Sources of Economic Growth
(Typical Chinese Village: 2012.3in Anhui Province)
1.Per capita Gross National Income and Middle
Income Trap1‑1 What is per capita Gross National Income?
According to the per capita gross national income, the World Bank ranks the levels of economic development of countries all over the world. Gross na- tional income(GNI)refers to the gross domestic product(GDP)plus foreign factor income minus foreign elements of expenditure.
The formula is:
GNI=GDP+(Income factor from abroad
−Expenditure of foreign elements) Among them, income factors from abroad refer to the income of resident getting from abroad such as wages, interest, dividends etc.
Per capita gross national income refers to the gross national income divided by annual average population, which is equal to per capita gross national product(GNP),and roughly equal to the per capita gross domestic product (GDP).
Gross national income is the total of original income, which includes labor
wages, total production subsidies, tax, depreciation of fixed assets, operating surplus and the original property income that all country residents gain in a certain period of time(usually1year).
Per capita gross national income includes enterprise income and govern- ment income, as well as personal income of residents. But per capita income only includes the personal income of residents.
1‑2 Income grouping criteria based on country by the World Bank
The World Bank uses the Atlas Method to calculate the GNI and per capita GNI to classify economies. The so-called Atlas Method uses the3‑year- moving average exchange rate of the domestic currency to the U.S. dollar. The world is divided into three groups, namely low-income countries, mid- dle-income and high-income countries by the World Bank. The middle in- come countries are divided into lower middle-income countries and upper middle-income countries. But the above standard is not fixed, but is continu- ously adjusted with economic development. According to data released by the World Bank, the income grouping criteria in2011are: less than $1005for low-income countries, between $1006and $12275for middle-income coun- tries, and more than $12276for high-income countries. The per capita GNI of lower middle-income countries is between $1006and $3975,while that of the upper-middle income countries is $3976to $12276.
Table1‑1 Per capita Gross National Income grouping criteria by the World Bank
Per capita gross national income groups Classification standard
Low-income countries less than $1005
Middle-income countries
Lower middle-income countries Upper middle-income countries
$1006〜$3975
$3976〜$12275
High-income countries more than $12276
According to this standard, in the215economies in the World Bank statis- tics, there are35countries in the low income group,110in the middle-in- come group and70in the high-income group. In the middle-income group, lower middle-income countries and upper middle-income countries number 56and54,respectively. Most of the low income economies are concentrated in the Sub-Saharan Africa .
The 70economics high-income club ,can be roughly divided into6cate- gories.1)The developed countries in Europe and America.2)Some of the islands managed by or closely related to the developed countries in Eu- rope and America, such as Guam, Greenland, the Cayman Islands, French Polynesia.3)Oil rich countries, including Saudi Arabia, the United Arab Emirates, Kuwait, and Brunei.4)Central and Eastern European transition countries, including Poland, Hungary, Czechoslovakia, Estonia, and Slove- nia.5)Some successful East Asian economies, including Japan, South Korea, Singapore, Hong Kong and Macao(Taiwan is not included).6)Is- rael.
Middle income economies are mainly distributed in4regions, that is Latin America and the Caribbean, Europe and Central Asia, mainly in the former Soviet Union and Eastern European countries, East Asia and Pacific, Middle East and North Africa.
1‑3 Putting forward and defining the concept of Middle Income Trap
The author believes that either the index of GDP or GNI can define the middle-income trap. According to the GDP per capita, the so-called middle-in- come trap assumes that if GDP per capita reaches between $5000to $12000,
GDP growth will slow down, economic development will lose its power, and the economy will enter a slow growth track.
According to the measure of per capita gross national income(GNI),the
middle-income trap refers to the situation that when middle-income countries achieve the upper middle-income level(see Table1‑1),economic develop- ment will enter into a period of instability, needing a huge change(reform)of the development model once more. If this change is successful, the economy can maintain sustainable development and the country can smoothly enter the ranks of developed countries. On the contrary, if the change is not successful, the economic growth will not be sustainable. Then the development of the state would be hindered and it will still hover as developing country and remain stagnant even experience a long recession. Then, we believe the coun- try has entered into the middle-income trap. As shown in Figure1‑1,accord- ing to the World Bank's new standard of per capita gross national income (GNI),the author sets the interval of $3976‑$12275as middle-income trap.
Middle-income trap means the economies of middle-income nations rarely enter the high income level successfully, because these economies tend to fall into a period of economic growth stagnation. They can not only compete with
Figure1‑1 The Conceptual graph of Middle-Income Trap
NOTE:In accordance with the standards of the World Bank on per capita GNI, mid- dle-income countries are divided into lower middle-income countries($1006〜
$3975)and upper middle-income countries($3976〜$12275).
low income countries with respect to low cost such as labor wages, but also with rich countries in terms of technology innovation.
After World War II, many developing economies had experienced rapid growth in a certain period of time, but when quite many economies reached the middle income level, the growth rate slowed down, and hovered at the gates of the high-income club. The most typical example is Argentina a representative of some Latin American countries.
According to statistical data, Argentina reached the middle-income levels in1975,Chile in1962,Uruguay in1973,Mexico in1974,Brazil in1975,
Columbia in1979 (figure1‑2),but they have not become high-income coun- tries so far. Malaysia(figure1‑3)and Syria(figure1‑4)reached the middle- income level in1977and1978respectively, but still they remain middle in- come countries nowadays.
Figure1‑2 Levels of Per Capita GDP in8Latin American Countries, Annual Estimates,1950‑98(million1990international Geary-Khamis dollars)
Source: Angus Maddison, The World Economy:A Millennial Perspective (Development Centre Studies),OECD(June12,2001)
Figure1‑3 Levels of Per Capita GDP in ASEAN4,1950‑99(1990 international Geary-Khamis dollars)
Source: Angus Maddison, The World Economy: A Millennial Perspective (Development Centre Studies),OECD(June12,2001)
Figure1‑4 World Per Capita GDP by Regions, Annual Estimates,1950‑98 (million1990international Geary-Khamis dollars)
Source: Angus Maddison, The World Economy: A Millennial Perspective (Development Centre Studies),OECD(June12,2001)
A similar situation can be seen in other parts of the world as in the case of Morocco and South Africa(figure1‑5),as well as the former Soviet Union and Eastern Europe.
Figure1‑5 Levels of Per Capita GDP in3others Countries,1950‑99 (1990international Geary-Khamis dollars)
Source: Angus Maddison, The World Economy:A Millennial Perspective (Development Centre Studies),OECD(June12,2001)
But whether in theory or in practice, the Middle Income Trap is not a necessary phenomenon which must appear during the economic growth and development process.
If we observe nearly two hundred years of economic history, Britain, Con- tinental Europe and the United States have successfully experienced the in- dustrial revolution, starting from the low growth and low-income state of traditional agricultural society, passing the middle-income level and finally becoming a rich high-income Society.
So the developed countries in Europe and America underwent a dynamic, but very continuous process without having to stay in the so-called middle in- come level.
It is generally believed that Japan and the East Asian NIEs4 are suc-
cessful economies which have stridden over the Middle Income Trap. They completed the transformation from low-income to high-income level(figure1
‑6).Per capita GDP of Japan was close to $3000in1972and $10000by 1984.That of South Korea was more than $3000in1987and $11469in1995.
It took Japan about12years while South Korea took8years to cross from a middle-income country to a high-income country.
However, some scholars consider that Japan has completed the industriali- zation and entered the high income countries through the Meiji Restoration before World War II. So Japan is out of the issue.
After30years of rapid growth, the pace of development in China has slowed down and many problems have emerged. People begin to worry about whether China will fall into the trap just like former Latin America countries.
Figure1‑6 Levels of Per Capita GDP in NIEs4and Japan,1950‑99 (1990international Geary-Khamis dollars)
Source: Angus Maddison, The World Economy: A Millennial Perspective (Development Centre Studies),OECD(June12,2001)
2.
Economic growth2‑1.Source of economic growth and its restrictive factors Source of economic growth
In macroeconomics, the source of economic growth is usually studied using the production function.
The concept of economic growth as discussed by Adam Smith will be used as the starting point in this paper. Labor, capital and land are considered as output sources by Adam Smith and Ricardo. The production function can be represented as follows:
Y=f(L, K, N) (1)
In the formula, Y represents the output, the variables L, K, N represent the inputs of labor, capital and land, respectively. The land N is fixed invariably, so it is generally simplified as:
Y=f(L, K) (2)
Technical condition is often connected to the economy's output and production elements in the macro production function. The macro production function is:
Y=Af(L, K) (3)
Technology is represented as A.
If the human capital is inputted as a factor, the production function can be written as:
Y=Af(L, K, H) (4)
In this paper, source elements of economic growth will be considered as fol- lows:
Labor, capital, material, technology(i.e. Total Factor Productivity, TFP),and institution are represented as L, K, M, A, I, respectively. The production function can be described as the following:
Y=f(Labor, Capital, Material, Technology, Institution)or
Y=f(L, K, M, A, I) (5)
Restricting factors of economic growth
If we know the source of promoting economic growth, we will also under- stand the restrictive factors of the economic growth. According to the produc- tion function formula(5),we can assume that economic growth is limited by the following aspects by reverse thinking.
(1)Labor and capital restrictions. The quantity and quality of labor and capital should be first included, respectively. There is a dividing line between the relationship of the quantity of labor supply and the amount of capital, which is Lewis turning point .If this point is not reached, population bo- nus will be often mentioned, whereas if the turning point is passed through,
capital diminishing returns will appear.
(2)Resource restrictions, including natural conditions and natural resources. For countries such as China, resources can be imported and the en- vironmental management objectives of the government might also be com- pleted, but to solve the climate warming and the shortage of water resources will not be an easy job.
(3)The Total Factor Productivity(TFP)restrictions. Its important con- tribution to the GDP is undoubtedly above suspicion. The allocation of resources and technology innovation often is the key to the problem.
(4)Institutional restrictions. The institution provides people's mode of labor, labor organization, circulation of material and commodities, income al- location etc. It provides the boundary of the economic behavior. Its contri-
bution to GDP is easy to see, but it is difficult to quantify. People often put production efficiency enhanced by the institutional arrangements into the total factor productivity(TFP).Generally, total factor productivity(TFP) reflects the quality of the institution.
2‑2 Contribution of labor and capital
High investment rate and the decrease of marginal efficiency of capital
As mentioned above, both Smith, the originator of economics and Ricardo considered labor and capital as sources of output.
The production function can be expressed as:
Y=f(L, K) (3)
From the nearly30years of Chinese economic reform, we can learn that, 1)Firstly, there is a large number of surplus rural labor, that means there is infinite supply of labor force in China's economic growth;2)Secondly, there is sustained high investment rate, that is the rapid growth of China's economy has long relied on high capital investment.
We often talk about consumption, investment and export as the three car- riages that drive GDP growth. In fact, these three carriages are derived only from the expenditure approach,i.e. talking about GDP from the perspective of total demand.
If you look at the demand side,30years of Chinese economic reform strategy can be described as investment-led strategy (Figure1‑7).
Although this strategy has led to China's rapid development making it the se- cond biggest economy in the world in terms of GDP, today we doubt whether this mode of economic development is sustainable.
In the Chinese expenditure structure of GDP in2008,consumption ac- counted for 48.59%,of which35.32%can be attributed to resident con-
Figure1‑7 China's GDP by expenditure approach,1978‑2012
Source:China Statistical Yearbook2013
sumer, government consumption stood at13.27%;capital formation ac- counted for43.54%,of which fixed capital formation was41.13%,the in- crease in inventory was2.4%;net exports accounted for7.86%.In the same year, the corresponding figures of India were as follows. Consumption was66% (private consumption,55%,government consumption,11%),
capital formation was39% (fixed capital formation34%,inventory increase 5%),and net export was‑5%.By comparingthe expenditure structure of China with that of India, we can see that, capital formation and net exports occupied a dominant position in China while in India it was consumption.
We can know from table1‑2,compared with other economies in high growth period, the proportion of China's investment was still the highest.
In western economics, there is a saying that the rate of marginal efficiency of capital shows a decreasing trend.
China however has maintained a high rate of investment for economic de-
Table1‑2 Comparison of capital coefficient Investment ratio
(Proportion of GDP,%) a
Growth rate (%) b
Capital coefficient
a/b China 1991‑1995
1996‑2000 2001‑2007 2008‑2011 (1991‑2007) (1991‑2011)
39.0 36.6 40.9 46.9 39.1 42.2
12.3 8.6 10.2 9.6 10.3 10.4
3.2 4.3 4.0 4.9 3.8 4.1
Japan (1961‑1970) 32.6 10.2 3.2
Korea (1981‑1990) 29.6 9.2 3.2
Taiwan(1981‑1990) 21.9 8.0 2.7
Source: Guan Zhixiong(2008),China Statistical Yearbook2012
velopment in the past30years. Why hasn't this law played a role? The an- swer is in the supply of labor.
This law is based on a limited supply of labour force. But in China, after the economic reform, a lot of surplus labor is released from the countryside. It formed an unlimited supply of labor force in China's economic growth. So for a long time, marginal efficiency of capital has not shown any decreasing trend.
Today's question is, whether this phenomenon will be sustainable. Will the unlimited supply or surplus labor be sustainable? The answer is no.
From2004to2005,the situation in China has reversed. In some industrial concentration areas along the southeast coast, the so-called shortage of migrant workers has emerged. At that time, many experts predict that China's Lewis turning point has become apparent. Lewis turning point usually appears with the disappearance of Population bonus .
Lewis turning point and Population bonus
Lewis turning point is the turning point in which supply of labor turns from
surplus to shortage. It means that during the process of industrialization, along with the gradual transfer of surplus rural labor force to non-agricultural industries, the surplus rural labor force gradually will be reduced, and finally exhausted. This was proposed by W. Arthur Lewis, a Nobel Laureate in Eco- nomics.
As early as2007,a report from the Chinese Academy of Social Sciences (CASS)warned that labor force in China is shifting from surplus to the short- age. The point will appear in The11th Five-Year Plan period, the exact time may be in2009.In2007,Labor Shortage emerged from the Zhujiang River Delta to Yangtze River Delta in China's eastern coastal area.
Corresponding to the concept of Lewis turning point is Population bo- nus .The increasing cheap labor force which is due to the increasing num- ber of young population, provided a cheap price for the elements of economic development. For many developing countries, cheap labor is an important factor in economic development. This situationis obviously seen in the cur- rent mode of economic growth in China. It is generally believed that China has begun to enter the Lewis turning point period in2004,and by 2015the Population bonus will end.
There seems to be a positive correlation between Lewis turning point and Population bonus .The appearance of the former is often a precursor for the gradual disappearance of Population bonus .Various studies show that China's Population bonus is disappearing. The2010census revealed that Chinese juvenile dependency ratio had fallen even faster than the previ- ous prediction. Chinese labor population will begin to decline around2015,
the disappearance of the Population bonus will be confirmed then.
The number of children a woman gives birth to in her lifetime is called Total Fertility Rate(TFR).It is generally believed that2.1is the lowest level of population replacement, while the average level in developed coun- tries is1.6.TFR in Japan is1.3,NIES, South Korea, Taiwan and Hong
Kong all are1.1and Singapore is1.2.As a result of the one-child policy in China, the population growth rate and fertility level of the population have greatly decreased. China's fertility rate has dropped substantially since the 1980s, and after the2010national census it is generally considered to be1.4‑
1.5.It is not only lower than the average level in developing countries and lower than the world average, but also even lower than that of developed countries(1.6).We can say that the fertility level in China has been low for many years.
As table1‑3shows, together with South Korea, Taiwan, Hong Kong, and Singapore, also known as NIES, China will come to the end of the Popula- tion bonus in the years2010‑2015.This is a huge challenge for China who has just entered the ranks of middle-income countries. That is also called
age before it gets rich in China.
Prof. Cai Fang of the Chinese Academy of Social Sciences(CASS),veri- fied the relationship between population change and economic growth and
Table1‑3 Population bonus in Asia
period per capita GDP
start end 2012(US$)
China 1965‑70 2010‑15 6,091
NEIS South Korea Taiwan Hongkong Singapore
1965‑70 1960‑65 1965‑70 1965‑70
2010‑15 2010‑15 2010‑15 2010‑15
22,590 23,113 36,796 51,709 ASEAN
Thailand Malaysia Indonesia Philippines Vietnam
1965‑70 1965‑70 1970‑75 1965‑70 1970‑75
2010‑15 2035‑40 2025‑30 2040‑45 2020‑25
5,474 10,381 3,557 2,588 1,596
Japan 1930‑35 1990‑95 46,720
India 1970‑75 2035‑40 1,489
Source: Oizumi(2007),World Bank, China's National Bureau of Statistics
made a schematic diagram(Figure1‑8)according to the database of the World Development Indicators of the World Bank. The diagram reveals the relationship between the Population bonus and economic growth, as fol- lows:
1)When the total fertility rate is at a high level, the economic growth rate is also at a very low steady-state level(assuming no population change and technical progress);
2)With decreasing fertility rate, the productive population age structure will gradually be formed, the economic growth rate will accelerate, thus the
Population bonus will be obtained;
3)When the fertility rate continues to drop to a lower level, the aging degree will be increased; the economic growth rate will drop to a low steady- state level.
Capital investment is the material capital, but it is closely related to Popu- lation bonus .In the early days of China's one-child policy, low birth rate led to fewer children(dependency ratio decrease),that means China's working Figure1‑8 Relationship between fertility rate and economic growth
Source: Cai(2011) Population bonus is embodied in almost all sources of economic growth, especially in the labor input and capital input.
population(15‑65years old)ratio has increased. By analyzing the relation- ship among the personal income, savings and consumption in the life cycle, increasing the labor population ratio brought about by fewer children can also be understood as a means of increasing national savings rate. While high sav- ing rate represents high investment rate, it is an important source of econom- ic growth.
In addition, surplus labor from the countryside in China has provided the infinite supply of labor force for China's economic reform.
This explains why China's capital input did not produce the phenomenon described in economics textbooks on the decrease of marginal efficiency of capital until the early 21st Century. Now, Lewis turning point has emerged in China, and this point means that the effect of this kind of ef- ficiency appears.
This also means that, even if a high investment rate is artificially main- tained continuously in the future, with the decrease of marginal efficiency of capital, the situation of pulling GDP growth will not be sustainable only by in- putting high capital investment.
2‑3 Total factor productivity in the economic growth
Solow Growth Model, since the1960s, is also known as the new classical economic growth model, or the exogenous growth model. The new classical theory is based on the independent variable of labor input and capital input to establish a growth model by Cobb-Douglas production function. In this model the technological progress is explained as exogenous factor to economic growth. Thus it comes to the conclusion that the long-term economic growth will stop when factor income appears to decrease progressively.
The new economics ,the Theory of Endogenous Growth, formed in the early1990s, explains the long-term growth rate by the endogenous factors.
That is to say, labor input contains the human capital formed by formal edu-
cation, training, on-the-job learning, etc., while the physical capital accumula- tion contains the technical progress formed by R&D, invention, etc. Techni- cal progress factors are considered endogenous, namely the existence of fac- tor earnings of technological progress will increase progressively, and come to such conclusion that the long-term growth rate will be positive.
Of course, many economists, such as Schumperter(1934),Schulz(1990),
Becker(1989),have found out the role of human capital and technology progress on economic growth very early, however, they have always regard- ed them as exogenous factors. Although Solow Growth Model regards tech- nological progress as exogenous, it is also sure that technological progress can lead to permanent growth of per capita output.
However, the endogenous growth theory considers that a country's long- term economic growth is determined by human capital, knowledge or techni- cal progress and other endogenous variables, among which the endogenous technical progress is the decisive factor to ensure sustained economic growth.
And it also considers that only these endogenous variables can avoid the decrease of capital efficiency rate stated in the new classical growth model.
As we mentioned in the previous section, in China, now that long-term un- limited labor supply is over, the growth of China's economy is faced with the decrease of marginal efficiency of capital .For further improvement in output, technical progress is the only way.
Total factor productivity(TFP)generally refers to the efficiency of de- velopment and utilization for resource, including human, material and finan- cial resources. From the perspective of economic growth, inputs of capital, labor and productivity etc. are all contributing to economic growth. From the perspective of efficiency, productivity is equal to the ratio of output in the na- tional economy and various resource elements of total input within a certain period.
TFP is an index used to measure the production efficiency. It has three
sources: the first is improvements in efficiency; the second is the technology progress;the third is the scale effect. In the calculation, it is a residual re- moved from the labor, capital investment, land and other elements. So far, there have been differences on the definition of total factor productivity in the academic field. TFP, in this paper, refers to the increase of output led by technical progress and ability achieved beyond the input elements, such as capital and labor. It is a residual ,not included in the contribution arising from input elements. It was proposed first by Solow(1957),so it is also called the Solow's residual.
Let us first analyze the differences between Labor productivity and TFP.
Labor productivity is an index which only focuses on labor factor among the production factors put into production, while TFP is an index which does not only focus on labor factor but also in consideration of capital and raw materi- als, etc. Therefore the improvement of TFP is considered to be the improve- ment of production efficiency that does not depend on the material input, that is to say it is an indicator of technological innovation and operational efficien- cy improvement.
Labor Productivity=Production/Labor input Total Factor Productivity(TFP)=
Production/All production factors input Here, taking the case of Japan and South Korea, as well as the Latin Ameri- can region, let us illustrate the function of TFP and its contribution to eco- nomic growth.
As shown in the table1‑4below, we can find that, the low TFP of Japan is the cause of the so-called lost20years of the Japanese economy after the eco- nomic bubble burst in1990.
In Figure1‑9,looking at the growth rate of the whole industry TFP and manufacturing industry TFP at different time periods in each country, except
Table1‑4 Contribution of each element of economic growth in Japan 1974 1975‑79 1980‑84 1985‑89 1990‑94 1995‑99 2000‑04 2005‑09 GDP growth
rate ‑0.4 4.4 3.9 4.6 2.0 0.9 1.4 ‑0.4
Contribution of
working hours ‑1.7 0.7 0.8 0.4 ‑0.3 ‑0.4 ‑0.4 ‑0.5
Contribution of (quality)Labor configuration
0.7 0.3 0.6 0.3 0.1 0.3 0.3 0.3
Contribution
of capital 2.7 1.8 2.0 2.3 2.2 1.2 0.6 0.5
Contribution
of TFP 2.2 1.6 0.5 1.6 ‑0.1 ‑0.2 0.8 ‑0.6
Source:METI White Paper on International Economy and Trade2013
for the first half of the2000s, TFP growth rate in Japan has been inferior to other countries consistently since1990.
The most notable is South Korea. Since1980,it's TFP rate of increase has consistently maintained a higher level compared to the other countries.
Qi and Zheng(2012)considered that only by analyzing the two factors of production of labor and capital, and the gap of human capital, cannot make a
Figure1‑9 Productivity comparison of all industries
(1)whole industry TFP (2)manufacturing industry TFP
NOTE:In the Figure, Nationality mark in order from left to right respectively is Japan, USA, Germany, Britain, France and South Korea.
Source:METI White Paper on International Economy and Trade2013