1 Introduction
India has achieved remarkable economic growth and become a key destination for foreign direct investment at the beginning of the 21st century. The country has attracted increased attention as a huge potential market since the pro-business government led by Narendra Modi came into power in 2014. Yet India’s underdeveloped infrastructure, especially its unreliable power supply, is still widely expected to remain a significant bottleneck for economic development. The OECD (2014) has emphasized the negative impact of unreliable power supply as a “big constraint” for the country. To realize further industrialization and economic growth in the coming years, India urgently needs to improve the quality of its infrastructure, especially in the power sector. The power sector reform launched in the early 1990s and revision of power tariffs have become critical targets toward this end. Most Indian states set electricity tariffs for the agricultural sector far under supply costs, which worsens the financial status of the power utilities and state governments and hampers investment and maintenance expenditure.
The tariff structure in India’s industrial sector also has a significant bearing.
Industrial and commercial tariffs have been set over costs, providing surpluses for use as cross-subsidies to partly offset the deficits. By worsening the business environment for industrial and commercial consumers, the distorted tariff structure may ultimately compel consumers to set up their own captive power plants to reduce the consumption of grid power (Dubash and Rajan 2001). Note, however, that power subsidies to the agricultural sector can be seen as a driver of social and economic development, especially in rural areas (Shah 2009). The power tariff policy in India has been recognized as an instrument of social policy
1.
In this paper we assess the cost of India’s power tariff policy with a focus on the impact on firm performance in the manufacturing sector. The tariff structure is thought to potentially affect firm performance through (a) the policy of charging higher tariffs in the industrial sector well above costs increases the input cost and (b) the financial deterioration of the power utilities and resulting power outages and other quality problems with the power supply.
To conduct a firm-level empirical analysis, we use firm-level panel data from the Indian Annual Survey of Industries (ASI) from the years 2003-04 to 2007-08. A firm’s performance is measured by its total factor productivity (TFP). Taking transmission and distribution (T&D) losses as proxy for the quality of the power supply, we investigate
1 Briner et al. (2007) suggest that a free power policy is less costly to launch since it requires no
“implementation by the bureaucratic apparatus.”
2
the impacts on firm performance. Our estimates show that the unreliable power supply has significant adverse impacts on TFP, while the industrial tariffs do not. These estimates are consistent with the situation observed, where the worsening financial status of the power utilities due to free power does not necessarily result in industrial tariff hikes for cross-subsidization. In other words, our estimates suggest that if an agricultural state can realize a reliable power supply, the tariff structure itself has no effect on firm performance. The firm performance may, however, be indirectly hindered through channels such as the misallocation of resources among sectors or the deterioration of state finances due to subsidies.
The remainder of this chapter is organized into four sections. In section 2 we briefly sketch the issues facing the Indian power sector, describe relevant background factors, and analyze the financial costs of the distorted tariff policy for the power utilities and state governments. In section 3 we empirically assess how the corporate and regulatory governance impacts the quality of the power supply. In section 4 concludes this chapter.
2. Cost of power tariff policy
2.1 Financial status of power utilities
Several surveys of investors from around the world have singled out poor power infrastructure as the biggest hurdle to investment in India. The most commonly mentioned symptoms of the problem are frequent power outages, high transmission and distribution losses, persistent power deficits, and delays in rural electrification. The first of these symptoms, frequent power outages, poses a direct obstacle for business.
FICCI (2013), for example, estimates that power outages in 2012 cost the Indian economy as much as 68 billion dollars, or 0.4 % of the country’s GDP. Frequent power outages and voltage fluctuations push industrial firms to invest in generators and stabilizers to mitigate damage, while medium and small companies unable to afford these expenses are left defenseless. According to data from the World Bank, the average loss of sales directly related to power outages is equivalent to 3.2 % of total sales in India’s industrial and service sector
2. Allcott et al. (2014) estimate that damage due to power outages in India’s textile industry reaches 5 % of output.
The impact from the deteriorated financial status of the state power utilities is the most crucial background factor underlying this situation. Tight fiscal constraints hamper investment in the establishment, operation, and maintenance of facilities, which in turn weakens the quality of power supply service. The total commercial loss
2 See Fukumi (2016a), table 5.
3
borne by the state power utilities in 2013 reached 7,127 crore rupees, or 0.63% of India’s GDP. Figure 1, which plots the commercial loss of state power utilities as a percentage of GDP, shows improvement, but huge commercial losses persist. From Figure 2 showing the relationship between the financial status of power utilities and commercial loss of firms due to power outages, we also see that the financially deteriorated utilities can damage firm performance through power outages (Fukumi 2016a).
Why do such huge commercial losses persist in the Indian power sector? The very high transmission and distribution (T&D) loss is clearly a core component. From Figure 3 showing the state-wise status of T&D loss, we can see that the T&D loss has declined in all states but Bihar and Haryana, and that the national average has decreased from 31.3% in 2004 to 23% in 2012. The status is still worse, however, if we compare it with the world average 8.2 % in 2012
3.
Meanwhile, a very low cost-recovery ratio constrains power utility financing. Figure 4 outlines the major composition of the power supply cost and revenue and how its changes over the two periods. The tariff revenue grows, but not enough to offset the rises in the cost for power purchase and generation due to hikes in coal prices. The gap between cost and revenue has expanded. The recovery ratio declined from 91% in 2004 to 79% in 2012 even after subsidies were received from the state governments.
The low recovery ratio stems from the tariff structure, which granted preferential electricity tariffs for agricultural users while setting industrial and commercial tariffs over costs. While the surplus from industrial and commercial sectors has been used as cross-subsidy, it falls far below the level necessary to offset the deficit from the agricultural sector. This tariff structure has thus been criticized for hampering the business environment through (a) industrial sector tariffs set far above costs and (b) low-quality power supply (e.g., frequent power outages) resulting from the financial deterioration of the power utilities and state finances. Tariff hikes and unreliable electricity supply appear to have increasingly induced industry to invest in captive generation, instigating a process that potentially reduces the revenue of state power utilities. In addition, low-cost electricity has encouraged wasteful consumption and triggered environmental problems such as groundwater depression (Dubash 2007). This
“distorted” tariff structure was originally launched in the late 1970s in Tamil Nadu (Dubash and Rajan 2001) and later adopted in other states. Electricity became a crucial input for agriculture with the shift from diesel to electricity as the main power source for irrigation pumps in the 1970s. Electric power policy was highly politicized in ensuing decades, leading to a widespread adoption of power subsidies as tools to win the
3 From World Development Indicator (WDI) database.
4
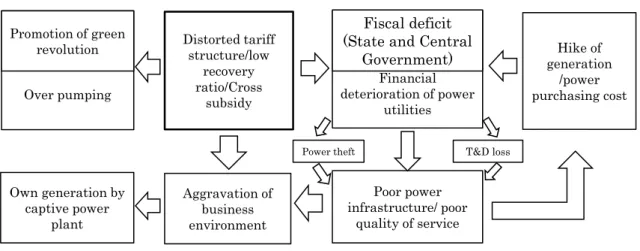
votes of farmers (Ruet 2005). While many argued that the tariff structure served as a form of political patronage, power subsidies can also be recognized as drivers of social and economic development, especially in rural areas. Shah (2009) proposed that power subsidies accelerated the Green Revolution by reducing the cost of irrigation with electric pumps. Irrigation by tubewells serviced by electric pumps started spreading in the 1970s, just as agriculture’s share of electricity consumption was rising. The diagram in Figure 5 illustrates how the abovementioned issues fit together in relation to the power tariff structure.
2.2 Cost of the power tariff policy
From table 1 showing the revenue per unit by consumer category, we can see the average cost, revenue, and cross-subsidy structure in each state. By comparing the power supply cost among the states in column 1, we find that Rajasthan and Tamil Nadu bear the highest costs. The power plants in these two states are thus assumed to be disadvantaged in terms of their capacities, modes, ages, plant load factors, and other factors that determine power supply costs. While the cost and revenue levels differ among the states, the average revenue falls below the power supply cost in all of the states but Delhi. In the breakdown of revenue by category, we observe a cross-subsidy structure in which the payments from agriculture consumers fall below the power supply costs
4while payments from industrial and non-domestic consumers exceed the costs. Punjab and Tamil Nadu provide electricity to agricultural consumers for free, while Delhi, West Bengal, Gujarat, and Bihar show relatively high recovery ratios even though they collect only around 60 % of the average supply costs. Judging from the recovery ratio from industrial consumers of high-voltage electricity, we see that Madhya Pradesh and Chhattisgarh charge tariffs in excess of 1.7 times the supply costs, followed by Gujarat (1.59), and Orissa (1.54). In terms of revenue, however, Madhya Pradesh still takes in the highest amount (8.7), followed by Delhi (8.3) and Uttar Pradesh (7.4).
As discussed above, this tariff structure brings about huge commercial losses for the power utilities. Table 2 shows the commercial profit/losses in 2013 by consumer category. Commercial losses from the agricultural sector were the largest in Punjab in terms of SDP
5, followed by Andhra Pradesh, Rajasthan, Haryana, and Tamil Nadu. We also find that industrial and non-domestic consumers were charged tariffs in excess of
4 The recovery ratio is the ratio of revenue to the average cost of supply. A value of less than one means “subsidized,” or paying below the cost, while a value exceeding one means “subsidizing,” or paying over the cost.
5 According to CEA figures, the total number of pumpsets energized in 2013 was 1,216,336. The total agricultural power subsidy in Panjab was 4,827 crore rupees, or approximately 40,000 rupees per tubewell.
5
the costs in all but a few states for cross-subsidy, while the total collected amounts fell far below the levels required to offset the huge commercial losses in the states of Andhra Pradesh, Tamil Nadu, Rajasthan, Punjab, Uttar Pradesh, and Madhya Pradesh. In Punjab, for example, the total profit from non-domestic and industrial consumers reached 2,728 crore rupees, far less than the loss incurred in the agricultural sector, 4,827 crore rupees. The Punjab state government provided 4,695 crore rupees as subsidy to power utilities, or 1.48 % of the SDP, the highest subsidy paid in any state and half of the Gross Fiscal Deficit. This huge financial support from state finances resulted in a profitable year for the power utilities in Punjab, bringing in a surplus of 642 crore rupees. This contrasted sharply with most of the other state governments, which provided subsidies too small to recover costs. The power utilities in states such as Uttar Pradesh, Tamil Nadu, and Rajasthan therefore report huge commercial losses even after receiving state subsidies.
These two tables thus demonstrate that the power utilities generally incur massive losses, though the levels of loss vary according to the cross-subsidy schemes and financial support from the state governments. Note also that the states that provide power at very low tariffs for agricultural consumers and incur huge commercial losses do not necessarily charge higher tariffs in their industrial and non-domestic sectors.
Figures 6 and 7 respectively show the revenue-per unit relationship and profit/loss relationship between the agricultural and industrial sectors. Negative relationships are difficult to identify at a glance.
3. State tariff policy and firm performance 3.1 Firm-level electricity expenditure
To assess the impact of tariff policy on firm performance, we use firm-level panel data from the Indian Annual Survey of Industries (ASI) from the years 2003-04 to 2007-08. The original data are collected from census statistics on all enterprises employing more than 100 workers. The survey provides information on the basic characteristics of factories such as their employees, capital, and the net and gross values, as well as data on electricity consumption and expenditure
6. The expenditure on grid electricity per unit is used as a proxy for the electricity tariff.
Table 3 shows the average expenditure for grid electricity per unit by state and by industry in 2007
7. The colored values in the table are the highest and second highest
6 We start our analysis from 2003-04, the first year when data on the electricity consumption of firms are reported.
7 Firm level data is aggregated at the 2-digit level from the National Industrial Classification.
6
values among the industries in each state. Firms in Madhya Pradesh pay the highest tariff, followed by firms in Karnataka and Gujarat. The tanning and dressing of leather (NIC code 19) is the highest-paying industry, followed by the manufacture of wearing apparel (NIC code 18)
8. The table gives us an overview of the state and industry tariff levels resulting from the state tariff policy. Note, however, that the electricity expenditure per unit is determined by the firm’s contract with the power grid, which depends upon factors such as the amount of electricity consumed and voltage. To extract the difference in tariff policy among states, we therefore run a simple OLS estimation at the firm level by regressing the expenditure for grid electricity per unit to the amount of electricity consumed and industrial and year dummy variables
9. We employ the residuals from this estimation as a proxy for state tariff policy, since the effects of the consumption level and industry characteristics, factors potentially related to the power supply contract, are removed from the original data on the per unit expenditure for electricity.
Table 4 reports the average expenditures per unit by states and industries due to the “state tariff policy.” We see that the rankings by industry change slightly after the effects of firm-specific factors on electricity expenditure are excluded. The figures show that states such as Madhya Pradesh, Karnataka, and Gujarat impose unfavorable tariff policies for industrial sectors. We also find, meanwhile, that the agricultural states providing electricity at very low rates or for free, such as Punjab, Tamil Nadu, and Andhra Pradesh, offer preferential tariffs to industrial sectors. This finding is consistent with what we reported in the previous section.
3.2 Impact of tariff policy on firm performance Model specification
To analyze the impact of tariff policy on firm performance, we employ the log of total factor productivity (TFP)
10as a dependent variable. As the first explanatory variables, we employ 𝑇𝑎𝑟𝑖𝑓𝑓𝑝𝑜𝑙𝑖𝑐𝑦
𝑖𝑡residuals from the OLS estimation mentioned above. The tariff hike is expected to have a negative impact on firm performance since it directly increases the input cost. Second, to investigate the impact of the quality of power supply, we employ 𝑇&𝐷 𝑙𝑜𝑠𝑠
𝑗𝑡, the ratio of transmission and distribution losses to the energy input in state j. 𝑇&𝐷 𝑙𝑜𝑠𝑠
𝑗𝑡is expected to have negative
8 Most firms in these two industries use less electricity than firms in other industries, which increases the per unit payment because a preferential tariff is granted to mega consumers in general.
9 The estimation result is reported in Appendix (a).
10 Appendix (b) provides details on the estimation method, as well as the total factor productivity by state and by industry.
7
impact since it relates closely to the frequency of power outages, as demonstrated in Fukumi (2016b). Third, on the assumption that unstable power supply will be more harmful for firms that are more dependent on grid electricity, we employ 𝐸𝑛𝑒𝑟𝑔𝑦 𝑖𝑛𝑡𝑒𝑛𝑠𝑖𝑡𝑦
𝑖t, defined here as the ratio of electricity consumption (kWh) to the value of real output, as a proxy for the firm’s electricity dependence
11. 𝐸𝑛𝑒𝑟𝑔𝑦 𝑖𝑛𝑡𝑒𝑛𝑠𝑖𝑡𝑦
𝑖tserves as a form of interaction term with 𝑇𝐷 𝑙𝑜𝑠𝑠
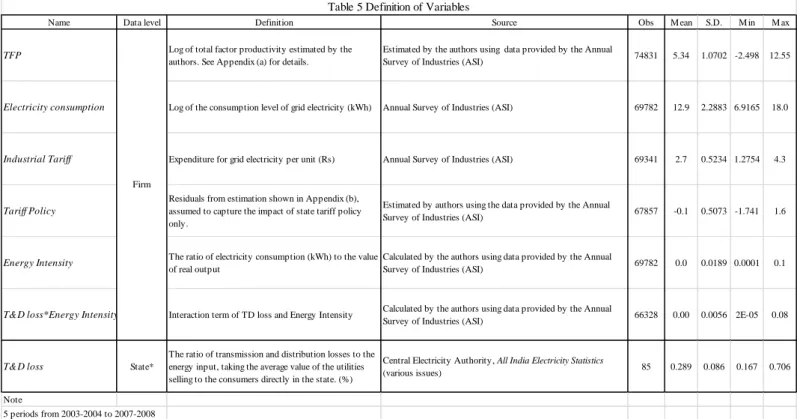
𝑗𝑡with the expectation of negative impact. Table 5 presents the definitions and descriptive statistics of the variables included in the empirical model.
Estimation results
Table 6 gives the estimation results of the fixed effect model on the impact of tariff policy. The first noteworthy finding is that 𝑇𝑎𝑟𝑖𝑓𝑓𝑝𝑜𝑙𝑖𝑐𝑦
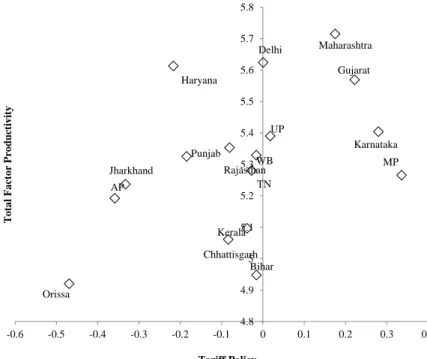
𝑖𝑡has a positive sign but is not statistically significant in Eqs. (1) and (2). Though it turns significant with a negative sign, it would be safer to assume there is no stable relationship between tariff policy and firm performance. Counter-intuitively, we can say that these unstable estimation results are consistent with the finding in Table 4, where forward states attracting investment from all over the world, such as Gujarat, impose relatively unfavorable tariff policies on industrial sectors. On this point, the picture in Figure 8 more clearly suggests that no negative relationship can be found between the state-level averages of tariff policy and TFP in 2007.
Turning to the impact of 𝑇𝐷 𝑙𝑜𝑠𝑠
𝑗𝑡in Eqs. (2) and (3) and its interaction term with 𝐸𝑛𝑒𝑟𝑔𝑦 𝑖𝑛𝑡𝑒𝑛𝑠𝑖𝑡𝑦
𝑖tin Eq.(3), we see negative and significant impacts on firm performance. These results suggest that a poor-quality power supply disturbs firm performance and that mega consumers of grid electricity suffer more from the negative impact. To explore the impact of the power supply quality on firm performance, we calculate the impact of the reduction of T&D losses in a hypothetical scenario where all states have reduced the T&D losses to 15% of the 2007 level by March 2016, as targeted by the central government. From Table 7 reporting the impact on TFP by state and by industry, the backward states in terms of T&D losses, such as Orissa, Bihar, and Jharkhand, enjoy bigger gains, which means that they suffer the most in the real world.
The table also shows that electricity-intensive industries such as basic metal industry (NIC code 27) gain a lot in this scenario.
Our estimation results thus imply that the quality of the power supply is the main channel through which state tariff policy affects firm performance. This impact is especially serious for backward states characterized by financially deteriorated utilities
11 Appendix (c) provides state- and industry-wise statistics on this variable.
8
and poor-quality power supply. More important, the tariff policy in the agricultural states that provide electricity at very low rates or for free, such as Punjab, Tamil Nadu, and Andhra Pradesh, harms the manufacturing sector not by charging higher tariffs on industrial sectors in cross-subsidization schemes, but through unreliable power supply.
If the power utilities in these states could supply better-quality power to reduce the adverse impacts of their tariff policies on industrial sectors, their policies could be more readily evaluated as instruments of social policy to some degree.
4. Concluding remarks
The target of this paper is to assess the cost of India’s power tariff policy with a focus on the impact on firm performance in the manufacturing sector. Our estimates show that unreliable power supply has significant adverse impacts on TFP, while industrial tariffs do not. These estimates are consistent with the situation observed from the data on the financial status of power utilities, where a worsening financial status does not necessarily result in industrial tariff hikes, as the utilities depend heavily on state subsidies. In other words, our estimates suggest that if an agricultural state can realize a reliable power supply, the policy of subsidizing the agricultural sector does not in itself adversely impact firm performance. Now that the power supply is getting more stable, this finding could be important in evaluations of the cost of subsidizing policy. Readers should note, however, that firm performance may be indirectly hindered through channels such as the deterioration of state finances or the misallocation of resources among sectors.
Before closing this paper we should point out parts of our analysis in need of
further refinement. First, we include no analysis on self-generation even though
investigations often suggest that the spread of captive power plants is a crucial outcome
of poor-quality grid power. The level of self-generation should be included to our
analysis, given that it relates closely to the consumption of grid power as well as firm
performance,. Second, we assume that energy intensity is constant through our analysis,
even though firms can presumably change their production technology to adapt to
changes in the business environment, including the cost and quality of electricity. The
cost of tariff policy should be further explored, given the possibility that we
underestimate it here. All of these matters are left for further study.
9
Reference
Allcott, Hunt, Allan Collard-Wexler, and Stephen D. O’Connell (2014). “How Do Electricity Shortages Affect Productivity? Evidence from India, ” NBER Working Paper No. 19977
Birner, R. Gupta, S. and Sharma, N. (2011), The political economy of agricultural policy reform in India: fertilizers and electricity in India , IFPRI Research Monograph 174,IFPRI、 Washington D.C.
Central Electricity Authority (various issues). All India Electricity Statistics, New Delhi: Ministry of Power, Government of India.
Dubash, Navroz K.. and S. C. Rajan (2001), “Power Politics Process of Power Sector Reform in India,” Economic and Political Weekly , September 1:3367-3390.
Dubash, Navroz K. 2007. “The Electricity-Groundwater Conundrum: Case for a Political Solution to a Political Problem”, Economic and Political Weekly, 42-52, December 29.
Fukumi, A. (2016a). “Power Sector Reform in India: Current Status and Issues,” School of Economics, University of Hyogo, Discussion Paper No.88
Fukumi, A. (2016b). “Power Sector Reform and Blackout in India,”
Federation of Indian Chambers of Commerce & Industry (FICCI) (2013). Power Transmission The real Bottleneck: An overview of the Indian power transmission sector, its challenges, and recommendations.
OECD (2014), OECD Economic Surveys: India 2014 , OECD Publishing, Paris.
Ruet, Joel. (2005). Privatising Power Cuts?: Ownership and Reform of State Electricity Boards in India , New Delhi : Academic Foundation
Reserve Bank of India (2015). Handbook of Statistics on Indian Economy 2014-15 , Mumbai: Reserve Bank of India.
Shah, Tushaar. (2009). Taming the Anarchy: Groundwater Governance in South Asia , New Delhi : Routledge
Planning Commission, Government of India. (2012), (2014). Annual Report on the Working of State Power Utilities and Electricity Departments, New Delhi, Planning Commission , Government of India .
Power Finance Corporation Limited. (2008). Report on the Performance of The State Power Utilities for the Years 2004-05 to 2006-07 , New Delhi: Power Finance Corporation Limited.
Power Finance Corporation Limited (2014). The Performance of State Power Utilities
for the years 2010-11 to 2012-13 , New Delhi: Power Finance Corporation Limited.
10
0.00 0.20 0.40 0.60 0.80 1.00 1.20 1.40
0 1000 2000 3000 4000 5000 6000 7000 8000 9000 10000
1985 1986 1987 1988 1989 1990 1991 1992 1993 1994 1995 1996 1997 1998 1999 2000 2001 2002 2003 2004 2005 2006 2007 2008 2009 2010 2011 2012 2013
Figure 1 Commercial loss (without subsidy) of state power utilities
Commercial loss
% of GDP (Right axis)
Source: Author calculation based on data from Power Finance Corporation (2008) , Planning Commission (2012, 2014), and Reserve Bank of India (2015)
Crore Rs. %
AP Bihar
Chhattisgarh Delhi
Gujarat Haryana
Jharkhand
Karnataka
Kerala
MP
Maharashtra Orissa Punjab
Rajasthan
TN
UP
WB
0 2 4 6 8 10 12
-160 -140 -120 -100 -80 -60 -40 -20 0 20
Commercial loss of firms due to power outage(%)
Pprofit/loss margin of power utilities (%)
Figure 2 Financial status of utilities and commercial loss of firms due to power outage
Source: Fukumi (2016). Data on commercial loss due to power outage is calculated by using World Bank Enterprise Survey.
%
%
11
31.25
23.04
0 10 20 30 40 50 60
Andhra Pradesh Bihar Chhattisgar Delhi Gujarat Haryana Jharkhan Karnatak Kerala Madhya Pradesh Maharash Orissa Punjab Rajasthan Tamil Nadu Uttar Pradesh West Bengal All India
2004 2012
Figure 3 State wise Transmission and Distribution loss in 2004-2005 and 2012-2013
Source Central Electricity Authority (various issues)
0 1 2 3 4 5 6 7 8
Rev Cost Rev Cost
2004-2005 2012-2013
Other costs Employees cost
Generation cost Power purchase cost
State subsidy Other income
Tariff revenue
Figure 4 Composition of Power Supply Cost and Revenue per kWh
Rs
Source: Calculated by the author from PRC (2008), (2014) Note
*Data on utilities directly selling electricity to consumers only.
**"Other costs" include cost for Employees, O&M, Interest, Depreciation, and Admi. and General expenditure.
12
Financial deterioration of power
utilities
Fiscal deficit (State and Central
Government)
Poor power infrastructure/ poor
quality of service
Power theft T&D loss
Distorted tariff structure/low
recovery ratio/Cross
subsidy
Hike of generation
/power purchasing cost Over pumping
Aggravation of business environment
Figure 5 The impact of tariff policy in Indian power sector
Source: Author Promotion of green
revolution
Own generation by captive power
plant
Average Cost of
supply
Andhra Pradesh 4.8 3.9 (0.81) 3.2 (0.66) 8.8 (1.82) 0.3 (0.06) 6.5 (1.34) 7.0 (1.46)
Bihar 5.0 3.0 (0.59) 3.2 (0.64) 6.9 (1.37) 3.0 (0.59) 6.3 (1.25) 6.2 (1.24)
Chhattisgarh 3.4 3.2 (0.92) 2.7 (0.78) 4.0 (1.16) 1.8 (0.53) 5.8 (1.7) 5.4 (1.57)
Delhi 5.8 6.0 (1.02) 5.9 (1.02) 10.2 (1.76) 3.9 (0.67) 8.3 (1.42) 8.8 (1.51)
Gujarat 4.2 4.1 (0.97) 4.7 (1.11) 5.1 (1.22) 2.4 (0.57) 6.7 (1.59) 6.1 (1.45)
Haryana 5.3 3.5 (0.66) 4.6 (0.87) 5.9 (1.11) 0.5 (0.09) 5.5 (1.03) 5.9 (1.1)
Jharkhand 6.2 3.4 (0.54) 1.4 (0.23) 7.5 (1.2) 0.7 (0.11) 5.6 (0.9) 7.9 (1.26)
Karnataka 4.4 4.0 (0.91) 4.3 (0.97) 7.9 (1.79) 2.6 (0.6) 5.9 (1.35) 5.9 (1.35)
Kerala 5.4 5.4 (0.99) 3.1 (0.57) 9.8 (1.8) 1.8 (0.33) 6.4 (1.18) 5.9 (1.08)
Madhya Pradesh 4.9 3.2 (0.66) 4.6 (0.94) 5.4 (1.1) 1.5 (0.31) 8.7 (1.77) 6.3 (1.29)
Maharashtra 5.3 5.2 (0.98) 5.5 (1.03) 10.6 (1.98) 3.2 (0.6) 7.1 (1.32) 5.7 (1.07)
Orissa 3.8 3.7 (0.96) 3.5 (0.91) 6.5 (1.69) 1.5 (0.39) 5.9 (1.54) 6.4 (1.67)
Punjab 4.7 3.7 (0.79) 4.2 (0.9) 7.0 (1.47) 0.0 (0.00) 6.4 (1.35) 6.3 (1.34)
Rajasthan 6.5 3.6 (0.56) 3.8 (0.58) 6.1 (0.93) 3.3 (0.51) 5.6 (0.86) 4.5 (0.69)
Tamil Nadu 6.5 4.1 (0.63) 2.6 (0.4) 8.1 (1.24) 0.0 (0.00) na na 5.6 (0.87)
Uttar Pradesh 6.1 3.3 (0.54) 2.8 (0.46) 6.6 (1.08) 1.7 (0.28) 7.4 (1.21) 6.2 (1.02)
West Bengal 4.9 4.9 (1.00) 5.3 (1.07) 6.8 (1.39) 3.0 (0.61) 7.1 (1.45) na na
Note
The recovery ratio of each category is reported in parentheses Source: Author calculation using data from Power Finance Corporation 2015
Table 1 Consumer Category-wise Revenue per Unit (Rs./kwh) in the year 2013-14
Average revenue Domestic Non Domestic Agricultural Industrial HT Industrial LT
13
% of SDP % of SDP
Andhra Pradesh -1119.3 2685.5 3160.1 603.2 -9929.0 1.16 48352 55055 -720 -7026 6306 0.74 24490
Bihar -148.7 151.2 193.3 33.4 -67.3 0.02 4510 7533 -367 -3023 2656 0.77 8770
Chattisgarh -89.3 64.8 1255.1 100.0 -367.6 0.20 10274 11378 -1317 -1317 0 0 5150
Delhi 66.4 2517.5 126.5 733.3 -5.3 0.00 23921 22882 692 692 0 0 -2060
Gujarat 9.4 19.0 3880.6 1731.0 -2714.8 0.35 67118 67454 583 -516 1099 0.14 20500
Haryana -193.7 165.7 129.2 78.1 -3975.5 1.02 23996 32288 -3314 -8295 4981 1.28 8980
Jharkhand -144.0 37.4 -107.2 19.2 -33.3 0.02 2339 4816 -1511 -2477 966 0.56 4090
Karnataka -80.5 2063.8 1311.4 280.6 -2972.8 0.48 32740 34555 -215 -1785 1570 0.26 17450
Kerala -499.9 937.7 392.5 51.9 -111.7 0.03 11394 11283 111 111 0 0 11870
Madhya Pradesh -75.2 122.0 2240.0 140.3 -4262.6 0.98 24208 33164 -6947 -9141 2194 0.50 12220
Maharashtra 89.0 3096.5 4068.1 293.3 -4423.5 0.29 74378 72705 1534 1532 2 0.00 24120
Orissa -48.2 385.1 1235.7 87.0 -43.4 0.02 16627 18203 -1642 -1642 0 0 5950
Punjab -148.8 674.4 1599.1 454.3 -4827.5 1.52 18302 22251 642 -4053 4695 1.48 9260
Rajasthan -880.8 -136.8 -612.7 -611.6 -5646.2 1.09 32215 49666 -15926 -17451 1525 0.29 13020
Tamil Nadu -3301.4 1306.1 na -525.1 -8020.3 0.94 34488 52150 -12744 -17662 4918 0.58 22940
Uttar Pradesh -1549.1 236.9 1338.2 44.6 -4385.2 0.51 71752 94550 -17680 -22853 5173 0.60 23910
West Bengal 114.5 596.9 1552.5 na -228.5 0.03 26350 25755 466 466 0 0 13410
Profit on subsidy received
basis
Profit without subsidy
Subsidy from state Gross Fiscal Deficit
Source: Author calculation using data from Power Finance Corporation 2015 Non
Domestic
Industrial HT
Industrial
LT Agricultural
Total Income - excluding subsidy
Total Exp
Table 2 Consumer Category-wise commercial profit/loss in the year 2013-14 (Crore. Rs.) Domestic
AP
Bihar
Chhattisgarh
Delhi
Gujarat Haryana
Jharkhand
Karnataka Kerala
MP
Maharashtra Orissa
Punjab
Rajasthan TN
UP
0 1 2 3 4 5 6 7 8 9 10
0 0.5 1 1.5 2 2.5 3 3.5 4 4.5
Revenue per unit from industrial consumers
Revenue per unit from agricultural consumers (low-voltage)
Figure 6 Relationship of the revenue per unit from agricultural and industrial consumers in 2013
Source: See table 2 Rs
Rs
14
AP
Bihar
Chhattisgarh Delhi Gujarat
Haryana Jharkhand Karnataka
Kerala MP
Maharashtra Orissa
Punjab
Rajasthan TN UP
-1000 -500 0 500 1000 1500 2000
-25000 -20000 -15000 -10000 -5000 0 5000
Profit/loss from industrialconsumers (low voltage)
Profit/loss from agricultural consumers
Figure 7 Relationship of the proft/loss between agricultural and industrial in 2013
Source: See table 2
Crore Rs
Crore Rs