Doctoral Dissertation
STUDY OF DEFECT INSPECTION SYSTEM FOR
CONCRETE TUNNEL LINING BASED ON IMAGE
PROCESSING TECHNIQUES
(
)
NGUYEN KIM CUONG
Division of Environmental Science and engineering
Graduate School of Science and Engineering
Yamaguchi University
ABSTRACT
The number of deteriorated concrete infrastructures has increased dramatically in many countries due to rapid aging. Therefore, the maintenance and management of existing concrete structures have become a major social concern worldwide. Concrete defects are important indicators reflecting the safety of infrastructure. To keep concrete components at good condition under all circumstances, the inspection plays an important role in the maintenance of infrastructure. Defect detection on concrete tunnel lining surface is one of the basic tasks of the inspection. One of the most frequently adopted inspection techniques is visual inspection, which is carried out by inspectors. It has a number of limitations, such as the high labour costs associated with carrying out tasks, and inaccuracy due to subjectivity, slow inspection speed and disruption to traffic.
A large number of researches have been considered to develop automated inspection eld of civil engineering, a number of inspection systems have been developed to utilise inexpensive technologies based on digital videos and cameras. Examples of these systems include crack detection method such as Yamaguchi and Hashimoto 2006, Miyamoto et al 2007, and systems to allow the fast acquisition of video data Ukai et al 2000, Yu et al 2007. However, none of these systems offer
required to create an automatic inspection system that can be adopted by the industry. The advantage of image processing techniques offers the possibility of creating an automatic inspection system. This thesis describes a system, which is based on state-of-the-art image processing techniques, to aid the visual inspection of tunnel lining. The system uses multi standard digital cameras mounted on a steel framework which is capable of sliding from side to top of the inspecting vehicle to shoot the full surface of the tunnel lining. The device is cheap compared to other technologies, such as MIMM-R or infrared cameras.
This research proposes an image acquisition system with a simple and effective structure that obtains sufficient image data for objective and precise quantification.
Furthermore, image stitching software was developed to create a full view of the tunnel wall surface image automatically.
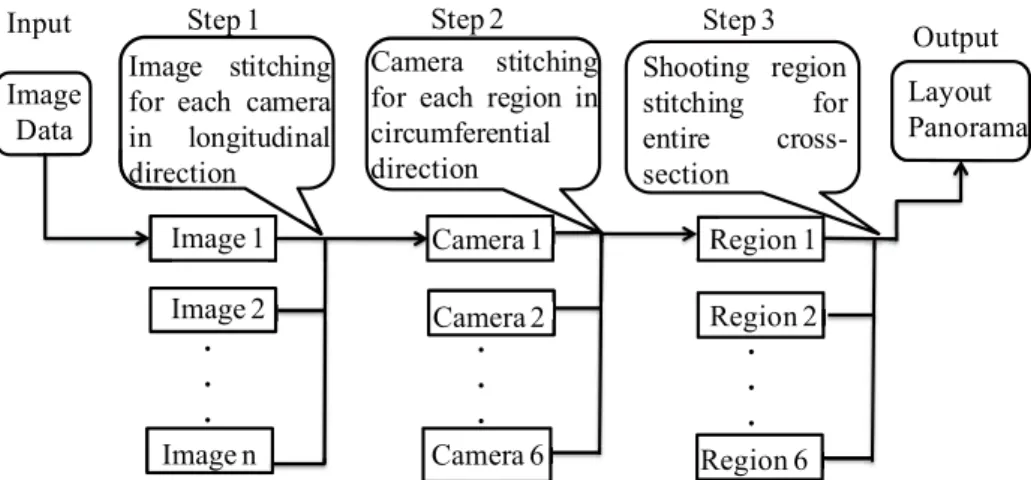
The first contribution of the inspection system in this research is to create the extended panoramic images in both longitudinal and circumferential directions to assist inspectors who have a wider field of view or an enhanced visualisation of large area the tunnel lining. To achieve this, a mosaicing technique consisted of image matching and stitching methods is proposed. In that, image matching method is detail presented in similarity and curvature metrics to find correct matching points. Moreover, a global and local correction method is presented that adjusts image matching error in the automatic image stitching according to the tunnel longitudinal direction. Moreover, in the curvature metric, median filter is used for refinement to smooth image motion quantity (IMQ) in the consecutive image stitching process.
Accordingly, an image stitching software is developed based on the proposed algorithm to create a layout panorama of the tunnel lining surface for assisting defect inspection. Moreover, experimental results for an actual tunnel demonstrate that the curvature measurement can match consecutive images accurately.
The second contribution of the inspection system is to present a prototype software based on image processing technique and an interactive genetic algorithm (iGA) with touch screen helps inspector easily detect the cracks (defects) from various concrete surface images.
The algorithm for accurate crack detection has composed of three major process parts. The first part was image input part which included image input and grayscale image transformation. The second part was crack enhancement part which included the following pre-processing steps: median filter, subtraction, binarization. The final part was noise removal part, comprising two steps: labeling and linear degree determination. Moreover, the optimized parameters are adjusted by iGA. Namely, the size of median filter is expressed by 6 bits, the binarization is expressed by 8 bits and the linear degree is expressed by 6 bits. Three parameters are combined to create a represented chromosome for solution candidates in a population.
Furthermore, to improve the capacity of the thin crack detection in the various complex environmental conditions, an image processing technique based on mathematic
dilation-erosion transformation, labelling and linear degree. The optimum parameters of IPT are also adjusted by genetic algorithm.
The crack detection results of the proposed method are compared to the ones of other methods to demonstrate that the proposed method has possibility of extracting crack with reasonable accuracy and working time.
TABLE OF CONTENT
LIST OF TABLES ... ix
LIST OF FIGURES ... xi
LIST OF SYMBOLS AND ABBREVIATIONS ... xv
CHAPTER 1INTRODUCTION ... 1
1.1 BACKGROUND ... 1
1.2 RESEARCH OBJECTIVES ... 4
1.3 ORGANIZATION OF DISSERTATION ... 5
CHAPTER 2 LITERATURE REVIEW ... 7
2.1 INTRODUCTION ... 7
2.2 TUNNEL INSPECTION METHODS ... 8
2.2.1 Strength based method ... 9
2.2.2 Sonic and ultrasonic methods ... 10
2.2.3 Magnetic method ... 10
2.2.4 Infrared Thermography ... 10
2.2.5 Ground Penetrating Radar (GPR) ... 11
2.2.6 Visual inspection methods ... 11
2.3 CRACK DETECTION BASED ON IMAGE PROCESSING TECHNIQUES ... 12
2.3.1 Threshold techniques-based methods ... 13
2.3.2 The edge-detection based technique... 14
2.3.3 Model-based technique ... 14
2.3.4 Pattern recognition based technique ... 14
2.4 LAYOUT PANORAMA CONSTRUCTION FOR TUNNEL LINING INSPECTION... 20
2.4.1 Review of using different image acquisition technique ... 20
(1) Image acquisition system by single camera ... 20
(2) Image acquisition system by stereo cameras ... 20
(3) Image acquisition system by multipe cameras ... 21
2.5 PROPOSED DEFECT INSPECTION FOR TUNNEL LINING ... 23
CHAPTER 3 AN IMAGE MATCHING METHOD BASED ON THE CURVATURE OF COST CURVE FOR PRODUCING TUNNEL LINING PANORAMA ... 27
3.1 INTRODUCTION ... 27
3.2 EXISTING METHOD ... 30
3.2.1 Image acquisition device ... 30
3.2.2 Procedure of tunnel lining image mosaic construction ... 31
3.3 PROPOSED METHOD ... 32
3.3.1 Image matching procedure ... 32
(1) Similarity metric ... 33
(2) Curvature metric with full search method ... 36
(3) Curvature metric with search strip method ... 38
3.3.2 Refinement technique... 41
(1) Refinement technique based on dual threshold ... 41
(2) Refinement technique based on median filter ... 41
3.4 EXPERIMENTAL WORK ... 42
3.4.1 Case study ... 42
3.4.2 Image motion quantity (IMQ) results ... 43
3.4.3 Accumulative IMQ results ... 48
3.5 PERFORMANCE EVALUATION ... 50
3.5.1 Evaluation of image matching error based on the parameters of the video acquisition system ... 51
3.5.2 Evaluation of image matching error based on the ground- truth (G-T) ... 53
3.5.3 Evaluation of the length of tunnel based on accumulative IMQ ... 55
3.5.4 Evaluation of the computational time ... 55
3.5.5 Creating panoramic images ... 56
3.5.6 Evaluate of the working time for panorama generation sofware ... 58
3.6 CONCLUSIONS... 59
CHAPTER 4 A STUDY ON SEMI-AUTOMATIC CONCRETE CRACKS DETECTION USING INTERACTIVE GENETIC ALGORITHM ... 63
4.1 INTRODUCTION ... 63
4.2 PROPOSED METHOD ... 65
(1) Part1 (Image input part) ... 66
(2) Part2 (Crack enhancement part) ... 66
(3) Part3 (Noise removal part) ... 68
4.2.3 Application of iGA to the image processing parameters optimization... 69
(1) Generating initial population randomly ... 69
(2) Evaluation of each individual ... 71
(3) Stopping criterion ... 71
4.3 PROTOTYPE SOFTWARE DEVELOPMENT ... 71
4.3.1 STEP1 (Input image)... 72
4.3.2 STEP2 (Adjustment of parameters) ... 72
4.3.3 STEP3 (Crack extraction) ... 72
4.3.4 STEP4 (Noise removal) ... 75
4.3.5 STEP5 (End determination) ... 75
4.4 EXPERIMENT ... 75
4.4.1 Sample test ... 75
4.4.2 Working time measure ... 76
4.4.3 Crack extraction accuracy measure ... 78
4.5 EVALUATION AND DISCUSSION ... 81
4.5.1 Evaluation method ... 81
4.5.2 Discussion ... 81
4.6 CONCLUSIONS... 82
CHAPTER 5 A CRACK DETECTION METHOD FOR CONCRETE INFRASTRUCTURES BASED ON IMAGE PROCESSING TECHNIQUE AND GENETIC ALGORITHM ... 85
5.1 INTRODUCTION ... 85
5.2 PROPOSED METHOD ... 87
5.2.1 Overview ... 87
5.2.2 Image processing technique ... 87
(1) Morphological filter ... 88
(2) Structuring element design ... 89
(3) Contrast Enhancement ... 89
(4) Binarization ... 90
(5) Dilation ... 90
5.2.3 Application of GA to the optimization of image processing parameters ... 91
(1) Represented chromosome design for solution candidates ... 91
(2) Genetic algorithm ... 91
5.3 EXPERIMENT ... 94
5.3.1 Sample test ... 94
5.3.2 The dilation and erosion transform experiment ... 95
5.3.3 Performance evaluation based on loss and noise ratio ... 95
5.3.4 Performance evaluation based on ROC curve analysis ... 100
(1) Receiver Operating Characteristic Curve (ROC) definition... 100
(2) Experiment ... 100
5.3.5 A chosen specific parameter set for full automatic crack detection ... 102
5.3.6 Comparison of performance between semi-automated method and fully automated method ... 104
5.3.7 Performance comparison for working time ... 105
5.4 Experiment of maximum crack width determination ...105
5.5 CONCLUSIONS...106
CHAPTER 6 CONCLUSIONS ...109
6.1 SUMMARY...109
6.2 CONTRIBUTION OF THE RESEARCH ...111
6.3 DISCUSSION ...113
LIST OF TABLES
Table.2.1 General image processing technique ... 13
Table.3.1 Specifications of the camera system. ... 43
Table.3.2 The results of IMQ error rate and running time of six cameras before correction technique... 45
Table.3.3 Parameter values of the imaging system. ... 51
Table.3.4 Criterion 1 based image matching error result (unit %) before refinement. ... 52
Table.3.5 Criterion 1 based image matching error results (unit %) after refinement. ... 52
Table.3.6 Comparison results of the curvature metrics. ... 53
Table.3.7 Criterion 2 based image matching error (unit %)... 54
Table.3.8 Comparison of the length of tunnel based on a.IMQ. ... 56
Table.3.9 Average computational time for parallel running implementation for 6 cameras ... 56
Table.3.10 The comparison of working time for panorama generation between manual method ... 60
Table.4.1 Properties of parameter. ... 70
Table.4.2 Characteristic feature of the original images. ... 76
Table.4.3 Average working time of 3 users. ... 77
Table.4.4 Average evaluation values of three users. ... 80
Table.4.5 Result of the accuracy analysis of wavelet transform, the proposed method and the noise removal function of the crack detection software. ... 82
Table.5.1 Properties of parameter. ... 92
Table.5.2 The comparison results of three methods. ... 99
Table.5.3 Comparison in unit pixel between Ground-truth image (G) and processed image (P). ... 100
Table.5.4 Accuracy evaluation of proposed method. ... 104
Table.5.5 Comparison of working time between Semi-automation and full automation... 105
LIST OF FIGURES
Fig.1.1 Image acquicsition system using MIMM-R. ... 3
Fig.1.2 Scheme of this research. ... 5
Fig.2.1 Components of Schmidt hammers. ... 9
Fig.2.2 Inspection using an impact hammer. ... 9
Fig.2.3 Inspection result using the infrared cameras. ... 10
Fig.2.4 Automatic crack detection for the tunnel wall procedure. ... 16
Fig.2.5 Image acquisition system for subway tunnel monitoring. ... 16
Fig.2.6 Diagram of development of VWMS on a train. ... 17
Fig.2.7 Crack detection procedure of this system. ... 17
Fig.2.8 Image of tunnel wall obtained by two dimensional CCD Camera. ... 18
Fig.2.9 Mobile tunnel inspection system. ... 19
Fig.2.10 The tunnelling system sensor structure. ... 20
Fig.2.11 Overall graphical representation of the robotic platform for tunnel lining inspection. ... 21
Fig.2.12 The vision measurement principle. MSVS, multi-cameras and structured-light vision system. .. 22
Fig.2.13 Image acquisition procedure. ... 23
Fig.2.14 Proposed defect inspection system for tunnel lining. ... 25
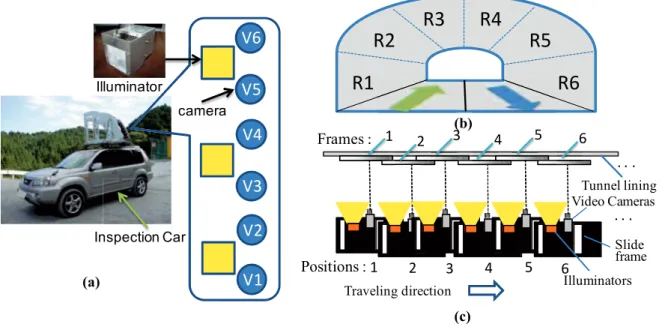
Fig.3.1 (a) Structure of image acquisition system; (b) Setting imaging regions for each pass; The full cross-section of the tunnel consists of six regions (R1-R6) with forward three times and backward three times; (c) Continuous video recording method. ... 31
Fig.3.2 The panoramic image stitching procedure for the entire tunnel. ... 32
Fig.3.3 Searching process of image-matching location. ... 33
Fig.3.4 Cost space of SAD metric for a (31-312) pair in camera V1. ... 37
Fig.3.5 The correct matching point using direct curvature metric in the cost space. ... 38
Fig.3.6 The incorrect matching point using direct curvature metric in the cost space. ... 39
Fig.3.7 The search strip for extracting the candidate matching-points. ... 40
Fig.3.8 3D map of cost space in Fig.3.4. ... 41
Fig.3.9 The results of the initial IMQ using MSM metric. ... 44
Fig.3.10 Comparison of similarity measurement between SAD and SSD. ... 46
Fig.3.11 The results of CNP metric using SAD. ... 46
Fig.3.12 Test of matching points on the cost curve using MSM and CNP metrics... 47
Fig.3.13 Some represented pairs of input frames. ... 48
Fig.3.16 The results of accumulative IMQs using CUR. ... 50
Fig.3.17 The results of accumulative IMQs using CNP. ... 50
Fig.3.18 The IMQ results of G-T and proposed method (120 images). ... 54
Fig.3.19 The image stitching results of the first three of segments using MSM and CNP metrics ... 57
Fig.3.20 The represented results of consecutive image stitching for each camera in the longitudinal direction. ... 58
Fig.3.21 A represented result of camera stitching in the circumferential direction. ... 58
Fig.3.22 The first segment generation by software. ... 59
Fig.3.23 The first segment generation by manual. ... 59
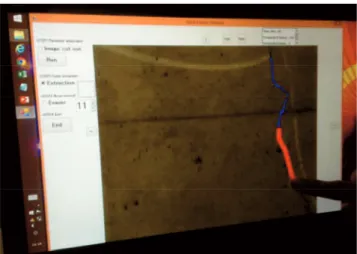
Fig.4.1 Crack extraction on the touch screen . ... 65
Fig.4.2 Operation procedure of the software. ... 66
Fig.4.3 Image processing technique. ... 66
Fig.4.4 An example of pre-processing steps. (a) Original image. (b) Result of median filter and subtraction. (c) Result of binarization after median filter and subtraction. ... 67
Fig.4.5 Result of the proposed method after parameter adjustment. (a) and (b) background images with t=1 and t=2, respectively, where t is iteration number of the parameter adjustment. (c) Final result image after using "Crack extraction" and "Noise rem ... 68
Fig.4.6 iGA procedure. ... 70
Fig.4.7 Coding presentation of a solution candidate. ... 70
Fig.4.8 Input image window. ... 71
Fig.4.9 Parameter adjustment window. ... 73
Fig.4.10 The image result using the software. ... 73
Fig.4.11 Tracing crack on background image. ... 74
Fig.4.12 Crack extraction image. ... 74
Fig.4.13 Original image. ... 75
Fig.4.14 Benchmark image. ... 76
Fig.4.15 Loss rate-Test number. ... 78
Fig.4.16 Noise rate-Test number. ... 79
Fig.4.17 Crack extraction results. ... 80
Fig.4.18 Visual comparison. (a), (b) Original images. (c), (d) Results by the HWT method. (e),(f) Results by parameter adjustment of the user (background images). (g), (h) Final result images... 83
Fig.5.1 Image processing procedure. ... 88
Fig.5.2 A designed structuring element with combination of four directions and (7x7) pixels ... 89
Fig.5.3 The illustrative results of image processing procedure. ... 90
Fig.5.4 A represented chromosome for solution candidates... 92
Fig.5.6 Target image based fitness evaluation. ... 93
Fig.5.7 The effectiveness of the dilation and erosion transformation. ... 95
Fig.5.8 The crack detection results of proposed method and our previous method. ... 96
Fig.5.9 Comparison of the accuracy of crack detection methods. ... 97
Fig.5.10 Comparison of the loss of crack detection methods. ... 98
Fig.5.11 Comparison of the noise of crack detection methods. ... 98
Fig.5.12 Comparison of the ROC curve among three methods. ... 101
Fig.5.13 Comparison of the ROC curve for Orig. image36. ... 101
Fig.5.14 Optimum parameter adjustment for training data. ... 102
Fig.5.15 The results of the training test using the specific parameter. ... 103
Fig.5.16 Comparison of the accuracy between Semi-automation and full automation. ... 104
LIST OF SYMBOLS AND ABBREVIATIONS
SYMBOLS MEANING
(k,l) The coordinates of search point
S1 the estimated change in position
x the speed (m/s) of the inspection car
y frame rate (fs).
z imaging resolution
mi the ithIMQ before the correction
Mi the ithIMQ after the correction of Step 1
the IMQ threshold value corresponding to an inspection car speed of 5 km/h (T1= 100 pixel)
parameter of the speed variance
V1-V6 Six cameras of the image acquisition device
R1-R6 Scanning six regions of the image acquisition device
i score deviation value
Si Score for a measurement of similarity as well as curvature
Savg, Smax, and Smin Average, maximum, and minimum scores of the metrics
ABBREVIATIONS
CNP Curvature of cost curve at the nearest pixels as well as the pixel being processed
GA Genetic algorithm
iGA Interactive genetic algorithm
IMQ Image motion quantity
IMQx Image motion quantity via the longitudinal direction (X-Axis) IMQy Image motion quantity via the circumferential direction (Y-Axis) IML Image matching location
IPT Image processing technique
MSM Maximum value of the Similarity Measurement NCC Normal-cross correlation
POI Point of interest
SAD Sum absolute difference SSD Sum standard difference
ZNCC Zero-mean Normal-cross correlation
CUR(SAD), CUR(SSD), CUR(NCC), and CUR(ZNCC) Curvature metric using matching cost function SAD, SSD, NCC, and ZNCC, respectively
CHAPTER
1
INTRODUCTION
1.1 BACKGROUND
The main aim of this research is to provide an effective inspection system of the tunnel lining based on the simple image-acquisition equipment and image processing technique. The results presented in this thesis assist inspectors in two areas of the inspecting works: (1) A layout panorama production enlarges field of view of the full tunnel lining surface. (2) A semi-automatic crack detection method for inspecting regions which are not able to detect crack automatically. This method is relied on image processing techniques (IPTs) and interactive genetic algorithm based. (3) A fully automatic crack detection method for the inspecting regions where crack pixels are easily detected by IPTs and genetic algorithm. This introductory chapter provides a background to the problems related to the current field and motivation for this study. A brief overview and the contributions of the proposed system are presented. The structure of the rest of the thesis is outlined at the end of the chapter.
Civil infrastructure has large-size components which limited field of view of human eye is not able to contact at close distance. Therefore, image processing techniques has become a powerful tool for infrastructure inspection and evaluation with wide applications. For example, the light illumination of the tunnel will result in distractive image background which will influence the tunnel lining crack assessment. The limitations of infrastructure environment are considered in image process and analysis technologies.
Following road statistic annual report 2017, in Japan there are 10,102 tunnels. Whereas the over 50-year existing tunnels have about 2000 tunnels in 2015 with
proportion 20%, and ten years later, in 2025, this proportion is 34% with respect to 3,000 the over 50-year tunnels. Most underground infrastructure was constructed more than half a century ago and is now deteriorating Stajano et al1).
However, periodic work of inspection in the local government is every 5 years for one time. If abnormalities or defects in these structures (cracks, leakage, spalling, cavity, etc) are not addressed as soon as possible for maintenance, repair, and rehabilitation, they easily deteriorate and are prone to damage or influence to safety human and prosperities. For example, Asakura et al2) On June 27, 1999, an electric power failure occurred inside the Fukuoka Tunnel along the Sanyo Shinkansen line and the Hikari train came to a stop. The investigation indicated that a pantograph of the 12th car was broken.
Moreover, On November 28, 1999, a freight train in the Rebunhama Tunnel of the Muroran Main line spotted something unusual on the tracks and applied the emergency brake. It was too late to avoid the object, however, and the train hit it and derailed. From the investigation, it was found that five pieces of concrete blocks, as large as several tens of centimeters, lay on the track and that those blocks had fallen from the tunnel arch. Therefore, effective maintenance strategies are urgently required in order to an age underground infrastructure properly to assure public safety while at the same time meeting usage demands Chaiyasarn et al3).
Furthermore, conventional inspection approaches are often subjective and time-consuming and expensive because these methods require many inspectors, labor and traffic limitation. Especially, human visual inspection has to stand on the trolley and rolling devices in order to inspection work which are unsafe for the inspectors Burgess & Niple 20054); Elliott and Heymsfield5). In addition, some of non-destructive methods applied to detail inspection such as impact acoustics, infrared thermograph, test hammers, CT, and X-ray still remain a number of limitations. For example, these methods need expert knowledge to analysis obtained data.
The photographic images provide the rich information from the tunnel lining surface such as textures, colours and 3D clues. Furthermore, development of image sensors with low-cost but has high capability of storage devices. Application computer vision helps inspectors can inspect off-line civil infrastructure surface condition directly and guarantee of the accuracy, objective and inexpensive cost. Crack inspection is fundamental task of the tunnel lining surface. Inspectors need to know different characteristic features of cracks such as locations, quantity, orientation, widths, lengths, and depths.
To improve the efficiency of the tunnel inspection system, in the past decade, many researchers have developed various sensors and image processing technology. Development of travelling measurement system scans continuously the tunnel lining surface using an exclusive vehicle for the purpose is to increase the high accuracy. For example of practical application, as shown in Fig.1.1, MIMM-R6) (mobile imaging system and mobile mapping system) dedicated to tunnel measurement that a measurement inspection company developed. MIMM-R is capable of detecting the cracks of 0.3 mm in width from the photographed images while running at 70 Km/h. besides, MIMM-R can measure the deformations of the tunnel such as: water leakage, deterioration of material and create defect map and saving labors in sketching work. MIMM-R can measure the deformations of the tunnel such as: water leakage, deterioration of material and create defect map and saving labors in sketching work.
In addition, MIMM-R can analyze cross-section of the tunnel. It is also possible to grasp the insufficient thickness of rear cavity parts by a laser. And also conduct detailed investigation of the tunnel at the same time of the inspection. Therefore, it is high to
improve the efficiency of the tunnel inspection. However, the inspection system of MIMM-R requires an exclusive vehicle, and the inspection cost is high (the measurement cost per meter of distance is 600 to 1,500 thousand yen).
For this reason, road tunnel networks which a local government manages are difficult to carry out a detailed investigation or diagnosis using the high-cost measuring inspection system as MIMM-R, due to the limitation of maintenance budget in the present condition. Further, the ministry of land, infrastructure, transport and tourism s "Routine Tunnel Periodic Inspection Procedure" in Japan reports that cracks judged to be dangerous in maintaining and managing tunnels are "widths greater than 3.0 mm". In other words, MIMM-R can detect the minimum crack width in term of high performance which inspecting-cost is high for local governments with small maintenance budget.
It is necessary to develop a simple inspection device stead of MIMM-R and inspecting price reduction so that the local government enable the introduction of the travelling continuous image scanning system combined image processing technique.
1.2 RESEARCH OBJECTIVES
The objective of this research is to provide a defect inspection system including an image acquisition device, the layout panorama for a larger field of view, and crack map based on the combination of image processing technique and evolution algorithm. In that, the panorama has resulted from the image matching and stitching techniques. Firstly, to estimate the initial matching points, the easiest ways are to use similarity metrics of the intensity of pixels in the overlapped regions. To improve high accuracy of the image matching point, curvature measure and refinement technique are applied.
The input image data are collected from the video acquisition device consist of six common video cameras and three illuminators arranged on the frame work. The simple structure of this device is easily mounted on a conventional vehicle which can scan continuously to capture images of the entire tunnel lining surface. Moreover, this research also provides a semi-automatic crack detection algorithm to help user who can extracted
cracks easily on the noise images without knowledge of image processing technique. To achieve this, the images of tunnel lining and bridge surfaces are taken with different multi resolution in complex environmental conditions. Further, an automatic crack detection method based on mathematic morphology and genetic algorithm is developed to find a optimized parameter set for crack detection of a large number of the concrete infrastructure elements.
1.3 ORGANIZATION OF DISSERTATION
This dissertation is organized into six chapters shown in Fig.1.2. Chapter 1 introduces the research background and problem statement. Then it explains the research objective. Chapter 2 introduces a literature review of existing methods and current practical application in the field. Chapter 3 shows an image matching method based on the curvature of cost curve for producing tunnel lining panorama. Chapter 4 presents a semi-automatic crack detection method using image processing technique combined
Fig.1.2 Scheme of this research.
interactive genetic algorithm (iGA). Chapter 5 shows an automatic crack detection method for concrete infrastructures based on image processing technique and genetic algorithm. Chapter 6 concludes the contributions in the study, limited problem, and solved approach in the future research.
CHAPTER
2
LITERATURE REVIEW
2.1 INTRODUCTION
One of the greatest challenges engineers face is the inspection, assessment, maintenance and safe operation of the existing civil infrastructure. This includes large-scale constructs such as tunnels, bridges, roads and pipelines. In the case of tunnels (water supply, metro, railway, road, etc.), they have increased in both total length and number, and will continue to do so. Furthermore, some tunnels still in service were completed over 50 years ago, with the existing construction and materials technology.
Damage mechanism of tunnel lining typically appear due to ageing, external impacted factors such as earth pressure, the deterioration of the lining materials, environmental conditions, increased loading, disaster, damages caused by human, inadequate or poor maintenance, and deferred repairs, ect. Unfortunately, in the past, there were several accidents related to the structural condition of tunnels, such as the Big Dig ceiling collapse in 2006 in Boston. In 1999, incidents of the spalling of concrete linings occurred in the Fukuoka Tunnel and in the Kita- Kyushu Tunnel along the Sanyo Shinkansen (Bullet Train) line and in the Rebunhama Tunnel along the Muroran Main line.
These accidents urged an instant need of automatic, cost-effective and exhaustive inspection of the tunnel that prevents such catastrophes. An automatic inspection system for the tunnel comprises of defect detection and condition assessment to grasp whether or not deterioration (deformation) has an influence on the structural safety and durability and then to have appropriate countermeasures to remedy the function of the tunnels based on the evaluation results Asakura et al2).
Therefore the defect identification is a crucial task for implementing successful inspection of the tunnel lining. The defects commonly occurred in the existing concrete lining are cracking (traverse, longitudinal, horizontal, diagonal, random) water leakage, spalling, staining, cavity, honey-comb. Steel structures: corrosion, cracks, buckles and kinks, leakage, protective layer fail. The walls of most tunnels are made of concrete, though these walls may contain finishes such as ceramic tiles or metal panels. In most cases, the typical defects found in a tunnel are cracks, spalling and efflorescence/leakage. In most cases, the typical defects found in a tunnel are cracks, spalling and efflorescence/leakage Park.S et al7).
The purpose of inspection is to grasp whether or not deformation has an influence on structural safety and durability and then to take proper countermeasures to secure the function of the tunnels based on the evaluation results. Thus, the inspection of a tunnel and the resultant diagnosis are the most basic parts of the maintenance and the management of a tunnel.
2.2 TUNNEL INSPECTION METHODS
According to Asakura et al2)
a tunnel based on a comparison of the investigation, observation and measurement results according to the judgment standards. Meanwhile
evaluation of the investigation, observation and measurement results on the basis of past experience and knowledge and a comprehensive proposal of the evaluation of the structural functions and countermeasures taking into account the inspection results. Inspections are divided into two stages including primary inspection and second inspection.
In the primary inspection, the purpose is to check if a structure that has been functional for years is still safe or not. Furthermore, it is desirable to do this without creating any negative effect on the structure or component, and this is why the non-destructive testing (NDT) methods are far more commonly used than non-destructive methods. NDT methods in structures can be divided in visual, strength- based, sonic and
ultrasonic, magnetic, electrical, thermography, ground penetrating radar (GPR), and vision.
2.2.1 Strength based method
This method estimates the hard surface compressive strength of the materials by measuring rebound or penetration tests. Example of the Schmidt Hammer is when the hammer is pressed orthogonally against a surface, the piston is automatically released onto the plunger and the rebound height of the piston is considered to be an index of
Fig.2.1 Components of Schmidt hammers8).
2.2.2 Sonic and ultrasonic methods
In sonic methods, also known as impact-echo tests, hammer blows create impulses, and the time of travel of these sonic pulses is measured with pickups placed on the wall, as can be seen in Fig.2.2. Ultrasonic devices are normally used by measuring the velocity in the material of a pulse generated by a piezoelectric transducer. The pulse velocity depends on the composition and maturity of the structural material and its elastic properties. The relationship to strength depends on several other properties and is best determined experimentally Blitz et al8).
2.2.3 Magnetic method
This method is used to measure dept of concrete cover from magnetic field distortion caused by a reinforcing bar. This method requires knowledge of the bar diameter with accuracy 5mm in 100mm.
2.2.4 Infrared Thermography
An infrared camera detects radiation in the infrared range of the electromagnetic spectrum and produce images of that radiation. The amount of radiation emitted by an object increases with temperature; therefore, thermography allows one to see variations
in temperature. This method is commonly applied to determine locate areas of near-surface delamination/ cracking in concrete decks, facades and similar structural elements. It requires expertise to interpret thermal images. Dust and air are able to interfere with readings. For example, Fig.2.3 shows a thermal images using infrared camera.
2.2.5 Ground Penetrating Radar (GPR)
This is a geophysical method that uses radar pulses to image the subsurface. Electromagnetic radiation detects the reflected signals from the subsurface. Application of this method is to measure concrete wall thickness, detect voids between concrete and test grouting, to identify water leakage and movement behind linings and pavement. It is capable of detecting cables and pipes. Drawback is poor performance in high-conductivity materials such as clayey soils, high cost, low measurement speed, and requires experts to interpret the results.
2.2.6 Visual inspection methods
Visual inspection is a common method of quality control, data acquisition, and data analysis. Visual Inspection, used in maintenance of facilities, mean inspection of equipment and structures using either or all of raw human senses such as vision, hearing, touch and smell and/or any non-specialized inspection equipment. Collection of image or recording video data. These inspection methodologies do not require specialized equipment, training.
Visual inspection is a common technique used by inspectors. Structural components are examined based on the experience of the inspectors, who will assess the conditions of the structures based on their visual appearance. Inspection must be carried out within areas, such as ventilation shafts, which are usually narrow. After visual inspection completed, inspectors report the inspection results that contain sketches of the defect areas. The visual inspections face some problems such as cost, time, and accuracy. Therefore, it
takes much time. Moreover, accuracy of the visual inspection results is subjective because of based on the judgement of each own experience inspector.
Development of low-cost digital video cameras yields a high inspiration for computer vision based IPT application to detect defects of the civil infrastructure. Therefore, in recent years, many researchers have developed automatic or semi-automatic crack inspection. Acording to Chaiyasaro3), these defect inspection systems can be categorized into the following: detection, visualisation and interpretation. This chapter introduce a detailed review of the inspection system based on both image processing technique acquisition equipment, and evolution algorithm. Drawback and advantage of image based inspection systems are discussed.
2.3 CRACK DETECTION BASED ON IMAGE PROCESSING TECHNIQUES
In recent years, the automation of visual inspection using various sensors and information processing technology is a very active area of research. Depending on concrete structure types, locations of the cracks, there are conformed methods. For instance, foundation inspection often used ultrasonic method, machine vision. Pipeline inspection system, underground structure often used ultrasonic method, machine vision image processing. Concrete structure of bridges, tunnels, buildings usually used visual inspection, image processing technique (IPT).
Koch et al10) reviewed computer vision based defect detection and condition assessment of concrete and asphalt civil infrastructure with general image processing techniques for automatic crack detection shown in the following Table.2.1. There are four approaches of the IPT that is presented in detail as follow:
2.3.1 Threshold techniques-based methods
Cracks are detected based on an assumption that pixels belonging to crack regions are darker than those in the neighbouring regions. Therefore, this method relies on thresholds, which can be applied either globally or locally, to extract the regions of the cracks. Many filtering techniques such as median and morphology filters are applied to smooth the original images to reduce noise and after that using background subtraction to enhance sharpness of the cracks.
Miyamoto et al11) calculated the difference in intensity between each pixel and the average intensity of each row in an image. A pixel that differs considerably from the average is said to be a crack pixel. Fujita et al12) used a line filter based on the Hessian matrix to emphasize line structures associated with cracks before they apply
Table.2.1 General image processing technique10)
Image acquisition
Device Image processing technique Optimization Tools
Pre-processing Segmentation Feature-based methods Model-based methods Genetic algorithm (GA)
Digital Camera Median filtering Threshold Haar-wavelets Percolation-model Swarm Optimization Algorithm (PSO) VideoCamera/ vehicle inspection/railway Morphologic operations
Edge detection Hough transform Graph-based search Artificial Neural networks (ANN) Robotic/sensor Histogram equalization
Region growing Laplacian of Gaussian
Image stitching
Fuzzy logic Fly cam/ Aerial
Vehicles Background subtraction Clustering Background subtraction Image registration Hybrid algorithms Line sensor camera Garbor filtering Wavelet transform Multi-temporal methods Line-tracing algorithm Super vector machine
thresholding to separate cracks from background. The major drawback of threshold-based approaches is the question on how to choose a suitable threshold for extracting crack features. The described algorithms select a threshold based on prior knowledge. However, such methods can hardly be generalized and may be inapplicable to the imaging conditions found in real tunnel images. Moreover, they are prone to inaccuracy caused by shadows as the intensities of shadow pixels tend to have a similar brightness compared to crack pixels.
2.3.2 The edge-detection based technique
Abdel-Qader et al13) analysed the efficacy of different edge detection techniques in identifying cracks in concrete pavements of bridges. They compared various edge detection algorithms and found the Haar Wavelet method to be the most reliable among traditional edge detector such as sobel, canny, and fast fourier transform (FFT) for the purpose of crack detection.
2.3.3 Model-based technique
Ukai14) developed a crack detection system for the tunnel wall. Under this method,
occupancy rate. Subsequently, a filter is used to remove noise. Yamaguchi et al15) used scalable local percolation-based image processing techniques and they proved to be efficient and accurate even for large surface images. The algorithm starts by initializing a seed region and then the neighboring regions are labeled as crack regions based on the percolation process. Paar et al16) proposed a crack detection algorithm based on the line tracing algorithm. In this algorithm, a crack is assumed to be a series of short straight lines connected together. The algorithm starts from a seed point and then searches for a line within the neighbouring regions. Once a line has been detected, a connection is made to the previous line, and the algorithm continues.
2.3.4 Pattern recognition based technique
In this theme of detection algorithms, pattern recognition is applied to obtain semantic information from image or video data. Zhu and Brilakis17) proposed an
algorithm for detecting concrete columns based on texture using artificial neural networks. Liu et al18) applied a Support Vector Machine classifier to classify if crack features appear in an image patch, which is pre-processed to extract potential crack features based on intensity. Abdelqader et al19) applied a Principal Component Principles (PCA) algorithm, which can be used to reduce the dimensions of feature vectors based on eigenvalues, to extract cracks from concrete bridge decks. The images are first pre-processed by line filters in three directions: vertical, horizontal and oblique;then further processed by the PCA algorithm and classified based on the nearest neighbour algorithm.
Methods based on pattern recognition considerably rely on training data in order to set up robust classifiers. Training and validation data are usually performed by manual labeling (supervised learning), which is a labor-intensive and error-prone procedure.
All abovementioned approaches are developed by empirical or trial and error on the basis of previous knowledge. Moreover, their applications are almost limited to specific types of images and the purpose. These techniques are hence unsuitable for detecting complex types of the cracks on various background images which have varied characteristics such as tone, shape of targets, shading, artifact, noise, ect. Therefore, this research is interested in solving the optimization problem of the image processing parameters.
Automatic crack detection for concrete tunnel lining also tempts many researchers. For illustration, Zhang et al20) proposed the crack detection system divided into six phases shown in Fig.2.4, as following presentation. The original tunnel images are collected by CMOS line scan cameras shown in Fig.2.5.
These color images are transferred into gray-scale images for further processing. Firstly the collected images of the nine line scan cameras are stitched together to eliminate overlapping regions. To eliminate the unnecessary local small valleys, an average image-smoothing filter is applied to the original gray-scale images for image processing. In Stage 4, a black top-hat transformation is applied to detect the local dim regions, which contain potential long and dark cracks. Subsequently, objects with low gray levels and large pixel numbers will be segmented by a thresholding operation and morphological area opening. Lastly, the numerical features will be extracted as the input
cracks. Subsequently machine learning techniques are applied to classify and compare the accuracy of different classifiers. The results of this study reported that have over 90% of cracks which are correctly classified. Further, setting parameters of IPT are performed by using empirical method.
Shen et al21) proposed a subway tunnel crack detection method based on wireless multimedia sensor network, as shown in Figs.2.6 and 2.7. This system proposed a new subway tunnel crack detection method and designs a subway tunnel crack detection system based on a wireless multimedia sensor network. This system includes four components: a vehicular wireless multimedia sensor node, a station sink node, a cable transmission access module, and a central server. Fig.2.6 shows how the system operates.
Step1. A vehicular wireless multimedia sensor captures an image, stores image, and disposes and compresses the image in accordance with default parameters when the
Fig.2.4 Automatic crack detection for the tunnel wall procedure20).
image sensing terminal; laser distance sensors; image storage and processing servers; central control system; speed sensor.20)
train runs through a tunnel. During this phase, data does not need to be transmitted. Step2. When the train arrives at a station, the vehicular wireless multimedia sensor transmits all of the compressed images from the previous tunnel to a station sink node via a wireless network. Step3. After receiving the data, the sink node transmits the received image data to a central server though a cable transmission access module.
Fig.2.6 Diagram of development of VWMS on a train 21).
Step4. The central server processes the received data by using a new subway tunnel crack detection method and analyzes the results. If there is a serious crack detected, the central server can find the original image on the basis of various requirements.
Step5. An administrator can check the detection results directly on the central server and can also remotely access data in real time from the central server via an internal company network.
This system obtains significantly meaningful results with two noise-removal steps for crack detection, but it needs a very complex equipment and even more expensive.
Ukai and Nagamine 22) developed an inspection system of railway facilities using continuous scan image, as shown in Fig.2.8.
(1) Because the higher resolution pictures can be seen on the display without going to the field, using this system can save the labor and time and can do inspection and diagnosis anytime we want.
(2) Accumulating the inspection data enables us to grasp the time series condition of the facilities and to plan and perform efficient maintenance and reformation.
(3) With the image processing make easy, a comprehensive analysis of various data including design data and maintenance history becomes available.
(4) Inspection becomes quick, efficient, and precise using the automatic diagnosis program to which the image processing method is applied.
(5) By exchanging information with each terminal which is located in each maintenance section, maintenance becomes quick and efficient.
This image scanning system is used on railways, so it is not applied to road tunnels yet. Besides, image-collection speed is about 20 Km/h relatively slow to be able to affect conventional traffic flow.
Yu et al23) proposed an automatic inspection system using a mobile robot for detecting concrete cracks in a tunnel shown in Fig.2.9. This system consisted of a small robot equipped with CCD camera and kept a constant distance of the tunnel wall.
An industrial camera is mounted on an anti-vibration equipment to stabilize the quality of images. The movement of this imaging system is through the independent actuation of the wheels. Obtained images from the imaging system have detected the cracks automatically under the computer vision assistance.
This imaging system only used a CCD camera so that the speed of image collection for the entire tunnel or large-size structures is slow. According Egnal et al24) to CCD camera typically attains noise in the obtained images such as fixed pattern noise. Dark energy, and dead pixels that no longer function.
M. Gavilán, et al25) proposed a mobile inspection system for high-resolution assessment of tunnels shown in Fig.2.10. The laser-cameras unit used for bimodal (road-rail) all-terrain truck is based on cameras and laser sensors that allow scanning a
laser-camera units inspects a 2 m wide section with accuracy of 1mm. Using the six
cameras, tunnels with a 9m diameter can be inspected at the system's maximum resolution. Advantage of this system achieves high accuracy of crack detection and areas with missing or chipping lining, dampness and running water, and can structure evaluation using 3D reconstruction. However, this system requires high-level expertise to analysis and process images leading to high inspecting cost.
2.4 LAYOUT PANORAMA CONSTRUCTION FOR TUNNEL LINING INSPECTION
2.4.1 Review of using different image acquisition technique
Panoramic imaging from multiple images is either a camera rotated about its optical centre, or using multiple cameras capturing different areas around them.
(1) Image acquisition system by single camera
Panoramic imaging from multiple images is either a hand-held camera rotated about its optical centre or moving the camera centre via parallel direction with the object surface.
(2) Image acquisition system by stereo cameras
In the described system, the robot will detect, recognize and document (visually and geometrically) the selected defects on the tunnel lining in a single pass.
The computer vision system is a core component of the procedure, as it implements the following major functions; the initial real-time detection of defects, while the robot navigates in the tunnel; the stereo-camera imaging for real-time 3D robot guidance and off-line accurate 3D reconstruction of surfaces that include structural defects; the 3D scanning of traverse tunnel sections, in order to detect lining deformations shown in Fig.
2.11. This pipeline is realized through single and stereo machine vision cameras, a
customized 3D laser scanner and a processing unit that runs the algorithms and stores the collected data.
(3) Image acquisition system by multipe cameras
Fig.2.12 shows a imaging device for railway tunnel 3D surface inspection based on
a multi-camera, structured-light vision system (MSVS) and a vibration compensation component. DongZhan et al proposed a global calibration for the MSVS to acquire the high quality of image data27). Howerver, the image equipment is more complex and so high expensive.
Fig.2.12 The vision measurement principle. MSVS, multi-cameras and structured-light vision system27).
2.4.2 Layout panorama construction for tunnel lining inspection
The main purpose of the panoramic image construction is to aid inspector an enhanced visualization from a single-wider image. As the images or videos become large, it is vital to arrange and align data to be able to visualize the data clearly.
Therefore stitching method is simple way to combine a number of consecutive images to form a large image depending on registration and blending techniques. Jahanshahi et al28) create stitched images of structural systems from a specialized camera that can tilt and pan. The method detects missing parts such as bolts when comparing images taken at different times. The method applies a machine-vision algorithm to perform image registration to rectify images so that they are in the same coordinate frame. In general, image stitching provides a good way of increasing the field of view that cannot be achieved by a single image. Consequently, a wide-angle or stitched image may improve defect detection results, in particular in case of hairline cracks since the stitched image provides a higher resolution of defects, e.g. cracks.
The methods reviewed above, however, can only handle a small number of images. This is because a mosaic is created based on a homography model in which a camera centre must be fixed at a single point. This method does not allow the translation of a camera. Chaiyasarn et al used a hand-held camera and a supported tripod3) to move
camera center with the purpose that takes consecutive images of the ring of tunnel lining as Fig.2.13. This imaging approaches yield in the high resolution image and flexible movement of the digital camera when photographing at the required special location. However, this equipment takes much time for collecting the entire tunnel lining with the long length. Moreover, each pass step has to measure distance from the camera centre to tunnel surface. This system movement has both translation and rotation so that geometric transformation among collected data is very complex.
Table.2.2 shows a summary of the related researches for tunnel panorama
generation. The table reports advantage of each method of each researcher. From that, the author provide a finding of each studied field. This is reason that a defect inspecting system using six video cameras for tunnel lining based on image processing techniques is proposed.
2.5 PROPOSED DEFECT INSPECTION FOR TUNNEL LINING
Providing a defect inspection system based on image processing techniques with video cameras achieves reasonable effectiveness for tunnel lining inspection including three criterion as follow:
There are cost, accuracy, and time. If the inspection system have too high accuracy for hair size crack and fast inspection time then leading to high inspection cost, for example: laser scanner, robotic tunneling, MIMM- ect. If the inspection system has low accuracy for defect detection and low inspection time then leading to low inspection cost. For example: manual vision inspection.
The authors proposed a defect inspection system inspection for tunnel lining shown in Fig.2.14. The system consists of two parts. The first part is video/image acquisition device, which is developed by Sumitomo Mitsu Company, mounted on an inspection vehicle to acquire tunnel lining surface images. Next, panoramic image is created by image stitching for enhanced visualization. The second part is crack extraction to create a crack map. In this research, the two parts are implemented and made experiments independently.
Table.2.2 Summary of the related researches for tunnel panorama generation.
Authors/
Years Title of paper Methods Dominated effectiveness Findings
Ukai 2000 Development of image processing technique for detection of tunnel wall deformation using continuously scanned image
SURF feature detector for
image stitching. Dilation and Erosion transform for crack detection.
Cracks/Defects detection and vertical and horizontal joint elimination.
Using multi-video cameras.
Image-collection speed is about 20 Km/h. Using exclusive vehicle for rail way.
Chaiyasarn 2011
Damage Detection and Monitoring for
Tunnel Inspection
based on Computer Vision
SIFT feature detector, Ransac, SfM bundle (3D
Point cloud+camera
calibration), surface
estimation, SVM for
classifier
3D scene reconstruction for
the shape inspection of the tunnel lining.
A hand-held camera.
At each image shooting step at a location,
multi-images need to be
acquired for a large scene.
M. Gavilán, et al., 2013
Mobile Inspection System For High-Resolution
Assessment Of
Tunnels
Proposed a mobile
inspection system for
high-resolution. Using
tunnelling software to extract the profile of the tunnel.
3D reconstruction using laser multi cameras with
high-resolution. The inspection result obtains high accuracy
High cost inspection and required expertise level Zhi-Heng Zu (2016) Panoramic Image Stitching for Arbitrarily Shaped Tunnel Lining Inspection
Feature detection and
matching, 3d
reconstruction using SfM.
3D reconstruction of the
arbitrarily shaped tunnel
lining inspection. The
acquired quality images.
A hand-held camera,
the time of the obtained image so long.
Complex geometric transformation.
Therefore, an image acquisition system was developed by Sumitomo Mitsui Company with a simple and effective structure that obtains sufficient image data for objective and precise quantification. The imaging system includes six video cameras and three illuminators mounted on the steel framework optimally in order to ensure the quality of the obtained images. In addition, this device can slide from the side to the top of the car so that the full tunnel lining surface can be captured by several passes through the tunnel.
Furthermore, image stitching software was developed to create a full view of the tunnel wall surface image automatically. Because the collected data have major parts contained the blank wall images of the tunnel, feature-extraction based image registration is not used. Furthermore, a huge of images of the full tunnel should consider a simple image-matching method and then using a correction technique based on the parameters of the imaging speed is better than any complex registration techniques.
In this study, a global and local correction method is presented that adjusts mis-registration error of the initial matching points using similarity metrics in the automatic
Fig.2.14 Proposed defect inspection system for tunnel lining.
Image stitching Scanning
Inspector A panoramic image generation for aiding visual inspection
Full-Automatic
Acquired data
Semi-Automatic
Crack extraction
Crack map
image stitching according to the tunnel longitudinal direction. Moreover, author proposed a curvature metric of the nearest-neighbor pixels as well as the pixel being processed to improve the accuracy of the image-matching location.
Consequently, an image stitching prototype software which makes use of available matching information among consecutive image pairs is developed to stitch images. As a result, this software creates layout panoramas in both longitudinal and circumferential directions for 1558 images in each camera.
This production provides a wider and detailed field of view of the tunnel lining to assist inspectors who can inspect defects easily with visualizing it off-line. Moreover, from original image data, we proposed two semi-automatic and automatic approaches to detect cracks based on the image processing techniques and optimized parameter-adjustment algorithm. Genetic algorithm and interactive genetic algorithm are applied to find optimum parameters of IPT for various complex images.
CHAPTER
3
AN IMAGE MATCHING METHOD BASED ON
THE CURVATURE OF COST CURVE FOR
PRODUCING TUNNEL LINING PANORAMA
Human inspection of defects of concrete tunnel lining is usually slow, laborious, and disruptive to traffic. This necessitates automated alternatives using sensors and computer-aided processing. The conventional image-matching methods only use the cost value of the pixel being processed based on similarity metric to estimate an image-matching location. To improve the image-image-matching efficiency, this paper proposes an image-matching method that relies on the curvatures of the cost curve at candidate matching points. This is followed by applying a median filter to mitigate the matching errors. Moreover, experimental results for an actual tunnel demonstrate that the curvature measurement can select the matching points accurately. The authors have developed an image-stitching software to create a high-resolution panorama of the tunnel lining surface for assisting in defect inspection.
3.1 INTRODUCTION
Many transport infrastructure structures, including buildings, bridges, and tunnels, have been in use for over 50 years in Japan. If abnormalities in these structures (cracks, leakage, spalling, cavity, etc.) are not detected and properly treated, the structures may deteriorate or eventually be damaged.
This study focuses on defect inspection of tunnel lining. One of the most important tasks for preliminary tunnel inspection29) is creating a layout map. To identify changes on the tunnel lining surface, visual analysis techniques are often used in practice2). There are three main approaches to visualize abnormalities of the tunnel lining: manual
drawing, image mosaicing approaches by hand camera, and tunnel scanning by multi-cameras.
The first approach is to draw a layout map of abnormality positions via visual inspection on the site. This approach is simple to perform at the expense of positioning accuracy and speed of inspection. The second approach3), 29) commonly uses a hand-held camera to capture images with an auxiliary positioning equipment and an illuminator. This approach yields higher inspecting speed, improved accuracy, and low cost. However, the main drawbacks are the long image acquisition time for large-size tunnels and disruption to traffic. At each image shooting step at a location, multi-images need to be acquired for a large scene. To capture the images of the full tunnel length, this step must be repeated at multiple locations. This image acquisition method results in complex geometric distortions because of many different camera positions. Hence a large number of raw original images have to be rectified before warping and stitching. This makes the approach less practical for inspecting large-size tunnels.
The third approach utilizes high-speed multi-cameras mounted on an inspection vehicle, and an illumination device to acquire images continuously. This allows constructing high-resolution 2D and 3D profiles of the tunnel lining. By far, this approach yields the fastest inspecting speed and the highest accuracy compared to the other approaches. However, the inspection cost is high as the approach requires high-precision laser scanners and special equipment30). As the inspection device shifts parallel to the imaging plane, the obtained images are simple geometric transformation (e.g., translation) from the reference image. Both the image mosaicing and the tunnel scanning approaches can create a layout panorama.
To reduce inspection cost, Ukai and Nagamine22) used a tunnel scanner with line sensor cameras, which does not require a special vehicle, to continuously scan images for detecting tunnel wall deformations. This image acquisition system can be mounted on a railcar running at 20km/h and achieving a record resolution of 0.5-1 mm/pixel. This image scanning system is used on railways, but it has not been applied to road tunnels. Besides, the image matching algorithm is not presented in detail.
In recent years, many researchers have considered automated crack detection on the tunnel lining surface based on auto inspection 20), 23). However, they did not expound on
This study utilizes the tunnel scanning approach to provide the layout panorama for defect inspection on the tunnel lining surface. The goals are to achieve reasonable accuracy, active image-acquisition time, and manageable inspection cost. For image matching, the authors use color pixel-intensity-based feature and the curvature measure to find the appropriate matching points. This is different from standard image matching techniques that make use of key-point (feature)-based image matching methods such as SIFT, SURF31), which may fail when the tunnel lining images contain noises or do not have many discriminated features.
Previously, the authors32), 33) proposed a Mobile Tunnel Inspection System (MOTIS) consisting of an image acquisition equipment and an image-stitching software for creating panoramic images. This software matches pixel brightness within the overlapped region. The initial optimal matching point is the position with maximum similarity value. The method is simple but effective in acquiring high-quality image data for inspection. More specifically, in the paper32), the authors used a full search method (FS method) and a correction technique based on the parameters of image acquisition device and inspection speech. The average matching error rate of six cameras was 33% before the correction technique was applied. After correction, the average error rate was reduced to 2.7%. In the subsequent paper33), the authors adopted a local search method (LS method) to check pixels around the estimated image-matching location, which was calculated using the parameters of the image acquisition device and inspection speech. As a result, the average error rate of image-matching locations was reduced to 3.45% before correction; and the error was eliminated after correction.
In this paper, the authors propose a search-strip method to extract candidate matching points from a search space based on the similarity metrics. Next, the precise matching point is selected from a curvature metric (CUR). This metric measures the sharpness of the peaks of the curve established from the matching point candidates. The matching accuracy is further improved by measuring the cost of Curvature function at the Nearest-neighbor Pixels and the pixel being processed (CNP). The experimental results demonstrate that CNP gives higher accuracy than CUR.
3 proposes a new image-matching procedure, which consists of a similarity metric and its refinement. Section 4 reports the experimental results validating our proposed method against previous methods. Section 5 assesses the performance of the proposed search algorithm by evaluating the accuracy of image motion quantity (IMQ). The calculated IMQ is compared with the target IMQ based on the parameters of the imaging system and the manual image matching. The efficiency (time and accuracy) of this algorithm is compared with our previous published papers32), 33). The section concludes with a description of an stitching software that makes use of the available image-matching information to produce tunnel panoramic images. This is followed by a discussion in Section 6. Finally, Section 7 concludes the paper.
3.2 EXISTING METHOD
In our previous papers32), 33), the authors reported a video acquisition system and a procedure of the image stitching for the entire tunnel lining as follows:
3.2.1 Image acquisition device
The video images of the entire tunnel lining surface are continuously scanned by a video acquisition system assembled on a car. Figure 3.1 (a) shows the system consisted of six digital video cameras (from V1 to V6) , three illuminators attached to the steel framework that its structure has shape appropriated with a half of cross-section of the tunnel, and a car. Further, this device can slide from the side to the top of the car so that the full tunnel lining surface can be captured by several passes through the tunnel. Each time has the rotation angle of 30o as shown in Fig.3.1 (b).
Figure 3.1 (b) presents the designed six regions to take images of the full
cross-section of the tunnel lining in forward and backward directions. Figure 3.1 (c) shows how to obtain an image in each moved step of the system in the longitudinal direction of the tunnel. For example, in the tunnel scanning process, the image acquisition system takes six frames at six positions.