京都府沿岸には1990年時点で114 haのガラモ場が分 布しており(環境庁自然保護局,1994),魚介類の産 卵場,幼稚魚の成育場として沿岸生態系のなかで重要 な役割を担っている。ガラモ場を構成するホンダワラ 類は,気胞の浮力によって藻体を直立させて水中に立 体的かつ複雑な構造を作り出し,その藻体の表面や周 囲に多くの生物を涵養している(横浜,2001)。これ らの生物の中には,小型甲殻類など魚類の主要な餌と なるものも含まれており(布施,1962),ガラモ場は 沿岸域の食物連鎖を担う重要な場所といえる。 葉上動物群集に関する知見は過去に報告があるが (布施,1962;Mukai, 1971;飯倉,1985),著者らの 知る限りでは,日本海沿岸についての報告はない。京 都府沿岸には,日本海に面した丹後半島北岸,若狭湾 西部の丹後海,若狭湾の支湾である舞鶴湾など,環境 特性の異なった海域があり,これらの地点ではホンダ ワラ類の現存量や年間純生産量(八谷ら,2007),炭 素,窒素,リン含量(八谷ら,未発表)などが異なっ ている。そこで,これら代表的な3地点のガラモ場で 優占するホンダワラ類の葉上動物群集について,2002 年から2004年にかけて調査した。その結果,3地点に おける葉上動物の種類数,個体数,優占種などが把握 できたので報告する。 材料と方法 調査地点は,舞鶴湾内の舞鶴,丹後海に位置する養 老および丹後半島北岸に位置する網野の各ガラモ場と した(Fig. 1)。これらの地点は,冬季に卓越する北西 からの波浪への露出度などから,網野は外海的,舞鶴 は内湾的,養老はその中間的な環境特性を有すると考 えられた(八谷ら,2007)。なお,これらの地点の海 底地形や基質,ホンダワラ類の種組成などは既報のと おりである(Yatsuya et al., 2005; 八谷ら,2007)。 各地点の藻場から,現存量の多い2∼4種のホンダワ ラ類を選び,季節ごとに葉上動物を採集した。すなわ ち,舞鶴ではアキヨレモクSargassum autumnaleとヨレ モクS. siliquastrumを2003年3,12月,2004年3,6,9月 の5回(ヨレモクは2004年3月に欠測),養老ではヤツ マタモクS. patens,ノコギリモクS. macrocarpum,ヨ レモク,ジョロモクMyagropsis myagroidesを2002年12 月,2003年3,6,9月の4回,網野ではヨレモク,ジョ ロモクを2003年12月,2004年4,7,9月の4回にわたり 採集した。 各種に対して25 cm×25 cm(0.0625 m2)の枠取り採 集を2ヵ所で行った。ホンダワラ群落の付着部付近で, 方形枠の各辺を側面からはさむようにして組み立て, 枠内の藻体に上部から目合い1 mmの網袋をかぶせ, 藻体を付着部から刈り取った。その後,網袋の口を閉 じ,10%海水ホルマリンに浸漬して葉上動物を固定し た。海水中で葉上動物を振るい出して採集し,可能な 限り下位の分類群まで分類し,その分類群の個体数と 湿重量を測定した。なお,結果については,2枠分の データの平均値を示した。 結 果 ホンダワラ類の全長 ホンダワラ類の採集月ごとの平 Fig. 1 A map showing the study sites of Maizuru, Yoro,
and Amino. 20km 10 0 35°40’N 135°20’E 135°00’E N Tango Peninsula Amino Yoro Maizuru Sea of Japan Pacific Ocean
京都府沿岸のガラモ場における葉上動物群集(資料)
八谷光介,西垣友和,和田洋藏,竹野功璽
Phytal animals in Sargassum beds in coastal areas of Kyoto Prefecture
Kousuke Yatsuya*, Tomokazu Nishigaki, Yozo Wada and Koji Takeno
キーワード:葉上動物,ガラモ場,日本海,丹後海,舞鶴湾
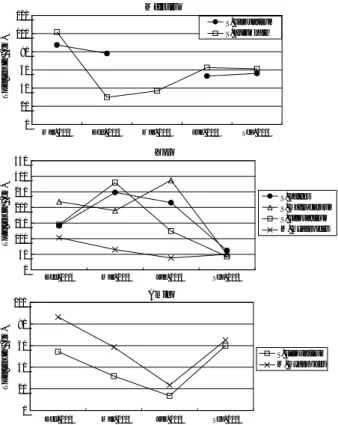
均全長(以下全長と記す)をFig. 2に示す。舞鶴のホ ンダワラ類の全長は,アキヨレモクが30∼102 cm,ヨ レモクが53∼88 cmの範囲で変化した。養老では,ヤ ツマタモク,ノコギリモク,ヨレモクの全長が12,3, 6月には1∼3 mと長かったが,9月には43∼62 cmで年 間最小となった。ジョロモクは12月の全長103 cmが年 間最大であり,それ以外では38∼65 cmであった。網 野ではヨレモク,ジョロモクともに12月から7月にか けて全長が短くなり,その後9月にかけて伸長した。 ヨレモク,ジョロモクの全長はそれぞれ14∼60 cm, 23∼87 cmの範囲で変化した。 葉上動物の種類数 調査期間を通じて同定できた分類 群は,舞鶴では153種類,養老では216種類,網野では 114種類であった。各地点のホンダワラ類ごとにまと めた平均出現種類数は,養老では24.0種類(ノコギリ モク)∼51.9種類(ヤツマタモク)であった(Table 1)。 舞鶴ではアキヨレモクが33.8種類,ヨレモクが40.9種 類,網野ではヨレモクが15.6種類,ジョロモクが26.5 種であった(Table 1)。出現種類数を採集月ごとにみ ると,舞鶴では6,9月に多く,網野では4,7月に多い 傾向がみられた(Fig. 3)。一方,養老では葉上動物の 出現種類数の季節的な増減の傾向が,ホンダワラ類の 種ごとに異なった。ヤツマタモクとヨレモクでは6月 に多く,ジョロモクでは9月に多かったが,ノコギリ モクにおける出現種類数は,増減の幅が小さく他種の ものより少なかった(Fig. 3)。 個体数 各地点のホンダワラ類ごとにまとめた葉上動 物の出現個体数は舞鶴が1,169∼3,317個体/0.0625 m2で もっとも多く,ついで養老が206∼1,317個体/0.0625 m2であり,網野が54∼295個体/0.0625 m2となった (Table 1)。いずれの地点においても個体数はある季 節に急増したが,それ以外の季節にはあまり変化しな かった(Fig. 3)。舞鶴では2003年3月にヨレモクの葉 上動物が10,000個体/0.0625 m2以上になったが,それ 以外では4,000個体/0.0625 m2未満であった(Fig. 3)。 養老ではヨレモクとヤツマタモクがそれぞれ2003年3 Fig. 2 Seasonal changes in the mean total length of
sargas-sacean thalli collected for the investigation of phytal animals. Yoro 0 50 100 150 200 250 300 350 Amino 0 20 40 60 80 100 Maizuru 0 20 40 60 80 100 120
Mar. 2003 Dec. 2003 Mar. 2004 Jun. 2004 Sep. 2004
Dec. 2003 Dec. 2003 S. siliquastrum S. autumnale Total length (cm) Total length (cm) T otal length (cm) S. patens S. macrocarpum S. siliquastrum M. myagroides S. siliquastrum M. myagroides
Mar. 2004 Jun. 2004 Sep. 2004
Sep. 2003 Jun. 2003
Mar. 2003
Maizuru S. autumnale Maizuru S. siliquastrum Amino S. siliquastrum Amino M. myagroides
Division speicesNo. of individualsNo. of Wet weight(g) Division speicesNo. of individualsNo. of Wet weight(g) Division speicesNo. of individualsNo. of Wet weight(g) Division speicesNo. of individualsNo. of Wet weight(g)
Porifera 1.2 - 0.9 Porifera 1.1 - 2.8 Porifera 0.0 - 0.0 Porifera 0.4 - 0.2
Coelenterata 1.7 211.1 10.4 Coelenterata 1.5 71.6 0.1 Coelenterata 0.8 0.3 0.0 Coelenterata 0.8 0.5 0.0
Platyhelminthes 0.3 0.8 0.0 Platyhelminthes 0.4 0.8 0.0 Platyhelminthes 0.3 0.3 0.0 Platyhelminthes 0.1 0.1 0.0
Nemertinea 1.0 9.8 0.0 Nemertinea 0.9 38.5 0.2 Nemertinea 0.3 0.4 0.0 Nemertinea 0.4 0.5 0.0
Annelida 3.9 67.2 0.2 Annelida 4.4 46.3 0.1 Sipunculoidea 0.1 0.1 0.0 Sipunculoidea 0.0 0.0 0.0
Tentaculata 1.0 0.0 2.4 Tentaculata 1.5 0.0 2.1 Annelida 1.5 1.8 0.0 Annelida 4.3 18.1 0.1
Mollusca 6.3 601.9 11.4 Mollusca 8.3 1444.3 12.9 Tentaculata 0.6 0.0 0.1 Tentaculata 2.6 0.0 3.2
Arthropoda 16.4 277.4 0.6 Arthropoda 19.5 1714.8 7.9 Mollusca 2.8 14.3 0.1 Mollusca 4.1 155.1 1.1
Echinodermata 0.1 0.1 0.0 Echinodermata 0.3 0.5 0.0 Arthropoda 8.3 36.0 0.1 Arthropoda 13.0 120.3 0.8
Prochordata 1.1 0.2 1.0 Prochordata 1.9 0.0 0.9 Echinodermata 0.6 0.9 0.2 Echinodermata 0.1 0.1 0.0
Vertebrata 0.2 0.5 0.1 Vertebrata 0.4 0.8 0.1 Prochordata 0.3 0.5 0.0 Prochordata 0.6 0.1 0.0
Egg mass 0.6 - 0.0 Egg mass 0.9 - 0.1 Egg mass 0.3 - 0.0 Egg mass 0.1 - 0.0
Total 33.8 1169.0 27.1 Total 40.9 3317.4 27.2 Total 15.6 54.4 0.6 Total 26.5 294.9 5.4
Yoro S. patens Yoro S. macrocarpum Yoro S. siliquastrum Yoro M. myagroides
Division speicesNo. of individualsNo. of Wet weight(g) Division speicesNo. of individualsNo. of Wet weight(g) Division speicesNo. of individualsNo. of Wet weight(g) Division speicesNo. of individualsNo. of Wet weight(g)
Porifera 0.4 - 0.0 Porifera 0.0 - 0.0 Porifera 0.3 - 0.3 Porifera 1.0 - 1.1
Coelenterata 3.0 16.5 3.3 Coelenterata 2.1 8.8 1.2 Coelenterata 2.6 8.6 0.1 Coelenterata 1.4 16.3 0.8
Platyhelminthes 0.4 0.4 0.0 Platyhelminthes 0.5 1.0 0.0 Platyhelminthes 0.3 0.4 0.0 Platyhelminthes 0.3 0.6 0.0
Nemertinea 1.5 6.9 0.0 Nemertinea 0.9 4.8 0.0 Nemertinea 0.9 6.3 0.0 Nemertinea 0.8 3.6 0.0
Kamptozoa 0.1 0.0 0.0 Kamptozoa 0.1 0.0 0.0 Kamptozoa 0.4 0.0 0.0 Kamptozoa 0.5 0.0 0.1
Sipunculoidea 0.5 0.5 0.0 Sipunculoidea 0.0 0.0 0.0 Sipunculoidea 0.5 0.5 0.0 Sipunculoidea 0.1 0.1 0.0
Annelida 8.9 26.3 0.2 Annelida 2.4 12.1 0.0 Annelida 4.4 212.6 0.6 Annelida 5.9 93.6 0.1
Tentaculata 2.4 0.0 0.9 Tentaculata 1.0 0.1 0.1 Tentaculata 1.8 0.0 0.4 Tentaculata 2.5 0.3 0.2
Mollusca 7.0 515.8 2.1 Mollusca 3.1 81.5 0.3 Mollusca 5.3 416.1 2.2 Mollusca 4.5 49.5 0.6
Arthropoda 21.9 746.3 1.0 Arthropoda 12.4 97.6 0.2 Arthropoda 17.0 203.4 0.7 Arthropoda 13.8 166.3 0.4
Echinodermata 1.5 3.9 0.2 Echinodermata 0.0 0.0 0.0 Echinodermata 0.5 0.6 0.0 Echinodermata 0.4 0.4 0.0
Prochordata 3.8 0.5 5.0 Prochordata 1.1 0.0 0.0 Prochordata 1.9 0.0 0.5 Prochordata 2.8 0.6 3.6
Egg mass 0.6 - 0.6 Egg mass 0.4 - 0.0 Egg mass 0.4 - 0.2 Egg mass 0.3 - 0.0
Total 51.9 1316.9 13.4 Total 24.0 205.9 1.8 Total 36.0 848.5 5.1 Total 34.0 331.3 6.9
Data indicate the mean value of each species of sargassaceae collected four to five times during this study
Table 1 Average number of species, number of individuals, and wet weight (g) per quadrat (25 cm x 25 cm) for each division of
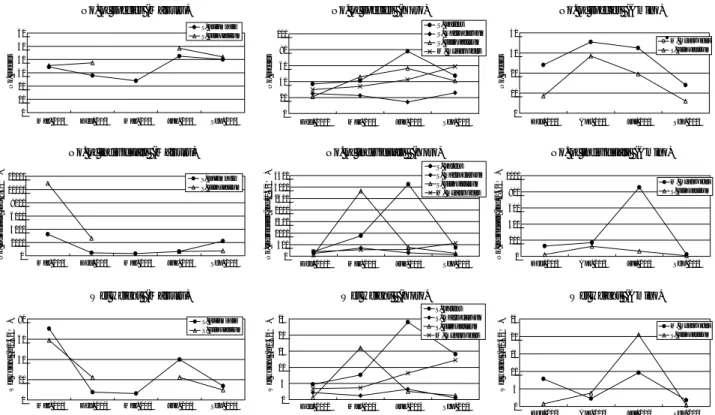
月と6月に約3,000個体/0.0625 m2に増加したが,それ 以外では1,000個体/0.0625 m2未満であった(Fig. 3)。 また,網野では2004年7月にジョロモクの葉上動物が 855個体/0.0625 m2 に増加したが,それ以外では200個 体/0.0625 m2未満であった(Fig. 3)。 湿重量 各地点のホンダワラ類ごとにまとめた葉上動 物の湿重量は,舞鶴が27.1∼27.2 g/0.0625 m2でもっと も多く,養老が1.8∼13.4 g/0.0625 m2 ,網野が0.6∼5.4 g/0.0625 m2となり,養老と網野は舞鶴に比べかなり少 なくなっていた(Table 1)。また,湿重量の増加する 時期は,個体数の増加する時期とほぼ対応していた (Fig. 3)。 分類群組成 門レベルで種類数の多かった節足動物 門,軟体動物門,環形動物門とそれ以外の門に分けて, 種類数,個体数,湿重量についてそれぞれの分類群が 占める割合をFig. 4に示した。 種類数の組成は,3地点の各種のホンダワラ類でほ ぼ一定であり,節足動物門の種類数は全体の約50%を 占め,軟体動物門と環形動物門はそれぞれ16%,13% を占めていた。個体数組成は,種類数組成よりも調査 地点やホンダワラ類の種によって異なる傾向があっ た。全体的に,節足動物門と軟体動物門の個体数が多 く,全地点の割合を平均すると,それぞれ45%および 40%を占めていた。環形動物門の個体数は,養老のヨ レモクとジョロモクでは28%,25%を占めたが,その 他では6%未満であった。湿重量組成では,軟体動物 門が平均で27%を占め,節足動物門が13%,環形動物
Fig. 3 Seasonal changes in the number of species, number of individuals, and wet weight (g) of phytal animals per quadrat (0.0625 m2). Symbols indicate the mean of two samples.
No. of individuals (Maizuru)
0 2000 4000 6000 8000 10000 12000
No. of individuals (Yoro)
0 500 1000 1500 2000 2500 3000 3500
No. of individuals (Amino)
0 200 400 600 800 1000 No. of species (Maizuru)
0 10 20 30 40 50 60
Mar. 2003 Dec. 2003 Mar. 2004 Jun. 2004 Sep. 2004
Wet weight (Maizuru)
0 20 40 60 80
No. of species (Yoro)
0 20 40 60 80 100
Dec. 2002 Mar. 2003 Jun. 2003 Sep. 2003
Wet weight (Yoro)
0 5 10 15 20 25
No. of species (Amino)
0 10 20 30 40
Dec. 2003 Apr. 2004 Jul. 2004 Sep. 2004
Mar. 2003 Dec. 2003 Mar. 2004 Jun. 2004 Sep. 2004 Dec. 2002 Mar. 2003 Jun. 2003 Sep. 2003 Dec. 2003 Apr. 2004 Jul. 2004 Sep. 2004
Mar. 2003 Dec. 2003 Mar. 2004 Jun. 2004 Sep. 2004 Dec. 2002 Mar. 2003 Jun. 2003 Sep. 2003
Dec. 2003 Apr. 2004 Jul. 2004 Sep. 2004
Wet weight (Amino)
0 5 10 15 20 25 S. autumnale S. siliquastrum S. autumnale S. siliquastrum S. autumnale S. siliquastrum S. patens S. macrocarpum S. siliquastrum M. myagroides S. patens S. macrocarpum S. siliquastrum M. myagroides S. patens S. macrocarpum S. siliquastrum M. myagroides M. myagroides S. siliquastrum M. myagroides S. siliquastrum M. myagroides S. siliquastrum No. species
No. individuals (ind./0.625
㎡ ) Wet weight (g/0.625 ㎡ ) No. species
No. individuals (ind./0.625
㎡ ) Wet weight (g/0.625 ㎡ ) No. species
No. individuals (ind./0.625
㎡
)
Wet weight (g/0.625
㎡
)
Fig. 4 Phytal animal compositions by the number of species, number of individuals, and wet weight (g) for the divisions of Arthropoda, Mollusca, Annelida, and others. 100% 80% 60% 40% 20% 0% No. of species Others Arthropoda Mollusea Annelida S.autumnale (Maizuru) S.siliquastrum (Maizuru) S.patens (Y oro) S.macr oarpum (Y oro) S.siliquastrum (Y oro) M.mya gr oides (Yoro) S.siliquastrum (Amino) M.mya gr oides (Amino) 100% 80% 60% 40% 20% 0% No. of individuals Others Arthropoda Mollusea Annelida S.autumnale (Maizuru) S.siliquastrum (Maizuru) S.patens (Y oro) S.macr oarpum (Y oro) S.siliquastrum (Y oro) M.mya gr oides (Y oro) S.siliquastrum (Amino) M.mya gr oides (Amino) 100% 80% 60% 40% 20% 0% Wet weight Others Arthropoda Mollusea Annelida S.autumnale (Maizuru) S.siliquastrum (Maizuru) S.patens (Y oro) S.macr oarpum (Y oro) S.siliquastrum (Y oro) M.mya gr oides (Y oro) S.siliquastrum (Amino) M.mya gr oides (Amino)
Table 2 List of dominant phytal animals on each sargassacean species at Maizuru
(a) Based on number of individuals Collected thalli
S. autumnale Diffalaba picta picta 41% Dynoides sp. 24%
S. siliquastrum Caprella monoceros 35% Diffalaba picta picta 27% Podocerus sp. 13%
S. autumnale Barleeia angustata 72%
S. siliquastrum Barleeia angustata 45% Diffalaba picta picta 29% Cantharidus japonicus 11%
S. autumnale Barleeia angustata 24% Cantharidus japonicus 16% Dynoides sp. 15% Eotricolia megastoma 15%
S. siliquastrum No Data
S. autumnale Mytilus galloprovincialis 68%
S. siliquastrum Mytilus galloprovincialis 53%
S. autumnale Boloceroides mcmurrichi 39%
S. siliquastrum Boloceroides mcmurrichi 41% Eualus leptognathus 20% (b) Based on wet weight basis
Collected thalli
S. autumnale Diffalaba picta picta 54% Dynoides sp. 21%
S. siliquastrum Caprella monoceros 35% Diffalaba picta picta 25% Dynoides sp. 10%
S. autumnale Barleeia angustata 53% Eotricolia megastoma 24%
S. siliquastrum Diffalaba picta picta 61% Eotricolia megastoma 12%
S. autumnale Caprella danilevskii 36% Eotricolia megastoma 18% Dynoides sp. 11% Cantharidus japonicus 10%
S. siliquastrum No Data
S. autumnale Mytilus galloprovincialis 53%
S. siliquastrum Nicolea sp. 28% Mytilus galloprovincialis 12%
S. autumnale Boloceroides mcmurrichi 50% Diffalaba picta picta 13% Nicolea sp. 11%
S. siliquastrum Boloceroides mcmurrichi 34% Diffalaba picta picta 24% Percentage of the number of individuals (a) and wet weight (b) is also indicated for each species.
Sep. 2004 Mar. 2004 Jun. 2004 Sep. 2004 Mar. 2003 Dec. 2003 Mar. 2004 Jun. 2004 3rd 4th Mar. 2003 4th 3rd 1st Dec. 2003 2nd 1st 2nd
Table 3 List of dominant phytal animals on each sargassacean species at Yoro
(a) Based on number of individuals Collected thalli
S. patens Ericthonius pugnax 22% Boloceroides mcmurrichi 13% Dexiospira spp. 12% Diffalaba sp. 10%
S. macrocarpum Ericthonius pugnax 19% Diffalaba sp. 17% Dexiospira spp. 16% Boloceroides mcmurrichi 16%
S. siliquastrum 18% Dexiospira spp. 11% Caprella decipiens 11% Podocerus sp. 10%
M. myagroides Dexiospira spp. 57% Boloceroides mcmurrichi 12%
S. patens Eotricolia megastoma 36% Barleeia angustata 30% Caprella danilevskii 13%
S. macrocarpum Barleeia angustata 34% Eotricolia megastoma 29% Ericthonius pugnax 13%
S. siliquastrum 26% Platynereis bicanaliculata 19% Barleeia angustata 19%
M. myagroides Filograna implexa 26% Podocerus sp. 17% Caprella danilevskii 15%
S. patens Aoroides sp. 19% Eotricolia megastoma 19% Parampithoe orientalis 13% Jassa sp. 12%
S. macrocarpum Aoroides sp. 19% Eotricolia megastoma 14% Euidotea ocellata 12% Parampithoe orientalis 12%
S. siliquastrum 15% Nicolea sp. 10% Cantharidus callichroa 10%
M. myagroides Cantharidus callichroa 17% Cantharidus japonicus 16% Heptacarpus futilirostris 12%
S. patens Caprella verrucosa 32% Caprella danilevskii 31%
S. macrocarpum Iphiplateia whiteleggei 38% Caprella danilevskii 20%
S. siliquastrum 22% Caprella verrucosa 12% Actiniaria 12%
M. myagroides Ampithoe ramondi 17% Gammaropsis sp. 13% Podocerus sp. 10%
(b) Based on wet weight basis Collected thalli
Membranipora tuberculata 41% Boloceroides mcmurrichi 39% Boloceroides mcmurrichi 90%
Boloceroides mcmurrichi 46% Didemnum spp. 21% Membranipora tuberculata 11%
Boloceroides mcmurrichi 63% Didemnum spp. 13%
Eotricolia megastoma 24% Egg mass 16% Barleeia angustata 13%
Eotricolia megastoma 31% Barleeia angustata 19% Oerstedia spp. 12%
Aplysia parvula 14% Eotricolia megastoma 13% Platynereis bicanaliculata 12%
Mycale sp. 34% Didemnum spp. 31% Polyclinum sp. 10%
Sertularella miurensis 49% Symplegma reptans 11%
Sertularella miurensis 76%
Didemnum spp. 26% Amathea distans 23% Cantharidus callichroa 10%
Mycale sp. 30% Botryllidae 22%
Symplegma reptans 48% Didemnum spp. 33%
Cantharidus japonicus 40% Cantharidus callichroa 23% Sertularella inabai 13%
Symplegma reptans 20% Parapholas quadrizonata 19% Didemnum spp. 19% Pyrene testudinaria tylerae18%
Symplegma reptans 50% Didemnum spp. 14%
Percentage of the number of individuals (a) and wet weight (b) is also indicated for each species. d n 2 t s 1 Dec. 2002 Mar. 2003 Jun. 2003 Sep. 2003 4th Dec. 2002 h t 4 d r 3 d n 2 t s 1 3rd Mar. 2003 Jun. 2003 Sep. 2003 Ericthonius pugnax Eotricolia megastoma Eotricolia megastoma Caprella danilevskii S. patens S. macrocarpum S. siliquastrum M. myagroides S. patens S. macrocarpum S. siliquastrum M. myagroides S. patens S. macrocarpum S. siliquastrum M. myagroides S. patens S. macrocarpum S. siliquastrum M. myagroides
門が2%であり,その他の分類群の湿重量割合が多く なった。 葉上動物として出現した種のうち,個体数あるいは 湿重量割合について上位4位までを,舞鶴,養老,網 野の順にそれぞれTable 2,3,4に示す。全体として 個体数,湿重量ともに甲殻類と腹足類が多いが,それ 以外では,ムラサキイガイMytilus galloprovincialis, オヨギイソギンチャクBoloceroides mcmurrichi,ホヤ 類,カイメン類などが,上位に出現していた。甲殻類 と腹足類については,以下に詳しく示す。 甲殻類と腹足類 葉上動物全体の個体数に対して占め る割合の高かった甲殻類と腹足類について,各地点の 平均出現個体数をFig. 5に示す。甲殻類では,3地点と もワレカラ類やヨコエビ類からなる端脚類の占める割 合が高く,ついで等脚類が多かった。2003年3月に舞 鶴で増加した端脚類にはモノワレカラCaprella mono-cerosが多く含まれていた。また, 2003年6月に養老で 増加した端脚類にはユンボソコエビ属が多く,2004年 7月 に 網 野 で 増 加 し た 端 脚 類 に は ホ ソ ヨ コ エ ビ Ericthonius pugnaxが多く含まれていた。 腹足類では中腹足類や原始腹足類が多くを占めてい た。舞鶴で2003年3月と12月に増加した中腹足類には, シマハマツボDiffalaba picta pictaとチャツボBarleeia
angustataが多く含まれていた。また,2003年3月の養
Table 4 List of dominant phytal animals on each sargassacean species at Amino
(a) Based on number of individuals Collected thalli
M. myagroides Eotricolia megastoma 40% Barleeia angustata 16% Hyale sp. 15% Dynoides sp. 10%
S. siliquastrum Eotricolia megastoma 41% Barleeia angustata 32% Caprella danilevskii 21% Pentias sp. 12%
M. myagroides Filograna implexa 21% Palinnotus sp. 18% Balanus trigonus 18% Eotricolia megastoma 11%
S. siliquastrum Dynoides sp. 32% Holotelson tuberatus 27% Pentias sp. 17%
M. myagroides Barleeia angustata 50% Eotricolia megastoma 36% Ericthonius pugnax 29%
S. siliquastrum Eotricolia megastoma 72% Parampithoe orientalis 11%
Siriella sp. 31% Caprella danilevskii 31% Ampithoe ramondi 19% Balanus trigonus 12%
Synidotea nipponensis 12%
Hyale sp. 12%
Caprella penantis 22% Hyalesp. 22% Trochidae 22% Harmothoe imbricata 11%
Siriella sp. 11% Dynoides sp. 11% Limnoria lignorum 11% Pentias sp. 11% Ampithoe sp. 11% Caprella decipiens 11% (b) Based on wet weight basis
Collected thalli
M. myagroides Celleporina porosissima 54% Omphalius nigerrima 18%
S. siliquastrum Celleporina porosissima 73% Eotricolia megastoma 27%
M. myagroides Balanus trigonus 66%
S. siliquastrum Actiniaria 17% Eotricolia megastoma 16% Holotelson tuberatus 16% Pentias sp. 14%
Caprella decipiens 14%
M. myagroides Celleporina porosissima 61%
S. siliquastrum Coscinasterias acutispina 56% Celleporina porosissima 43% Balanus trigonus 23% Spongioradsia sp. 13%
M. myagroides Celleporina porosissima 88%
S. siliquastrum Septifer keenae 100%
Percentage of the number of individuals (a) and wet weight (b) is also indicated for each species. Dec. 2003 h t 4 d r 3 d n 2 t s 1 h t 4 d r 3 d n 2 t s 1 Apr. 2004 Jul. 2004 Sep. 2004 M. myagroides Sep. 2004 S. siliquastrum Dec. 2003 Apr. 2004 Jul. 2004
Fig. 5 Seasonal changes in the number of individuals of Crustacea and Gastropoda. The Crustacea are divided into Isopoda, Amphipoda, Decapoda, and others, and the Gastropoda are divided into Archaeogastropoda, Mesogastropoda, Neogastropoda, and others. Data indicate the mean value for each sampling date.
0 50 100 150 200 250 300 individuals/0.0625 ㎡ 0 50 100 150 200 individuals/0.0625 ㎡ 0 100 200 300 400 500 600 700 individuals/0.0625 ㎡ 0 500 1000 1500 2000 2500 individuals/0.0625 ㎡ 0 100 200 300 400 500 600 700 individuals/0.0625 ㎡ 0 1000 2000 3000 4000 5000 individuals/0.0625 ㎡ Gastropoda (Amino) Others Neogastropoda Mesogastropoda Archaeogastropoda Crustacea (Amino) Others Decapoda amphipoda Isopoda Gastropoda (Yoro) Others Neogastropoda Mesogastropoda Archaeogastropoda Crustacea (Yoro) Crustacea (Maizuru) Others Decapoda Amphipoda Isopoda Gastropoda (Maizuru)
Mar. 2003 Dec. 2003 Mar. 2004 Jun. 2004 Sep. 2004 Mar. 2003 Dec. 2003 Mar. 2004 Jun. 2004 Sep. 2004
Dec. 2002 Mar. 2003 Jun. 2003 Sep. 2003 Dec. 2002 Mar. 2003 Jun. 2003 Sep. 2003
Dec. 2003 Mar. 2004 Jun. 2004 Sep. 2004 Dec. 2003 Mar. 2004 Jun. 2004 Sep. 2004
Others Neogastropoda Mesogastropoda Archaeogastropoda Others Decapoda Amphipoda Isopoda
老と2004年7月の網野で増加した中腹足類にはチャツ ボが多く含まれていた。養老の2003年3月と6月および 網野の2004年7月で増加した原始腹足類にはベニバイ Eotricolia megastomaが多く含まれていた。甲殻類と腹 足類はともに,舞鶴がもっとも個体数が多く,養老, 網野の順に少なくなった。 ま と め 本報は,京都府沿岸を含め日本海沿岸のガラモ場の 葉上動物群集に関して,初めて行われた調査報告であ る。京都府沿岸の内湾(舞鶴)から外海(網野)にか けてのガラモ場には,年間を通じて114∼216種類の葉 上動物が出現し,ガラモ場で優占するホンダワラ類の 種ごとにまとめた各調査時の出現種類数は,16∼52種 類であった。 葉上動物の種類数は,養老がもっとも多く,舞鶴, 網野の順に減少し,個体数と湿重量では,舞鶴がもっ とも多く,養老,網野の順に減少した。養老のガラモ 場は,他の2地点に比べ全長の長いホンダワラ類で構 成されるため(Fig. 2),立体的に高い構造を有してお り,このことが葉上動物の棲み場を増加あるいは多様 化させ,その出現種数を増加させた可能性がある。舞 鶴のアキヨレモクやヨレモクは,他の2地点のホンダ ワラ類よりも単位面積あたりの現存量や生産量が大き く(八谷ら,2007),このような高い一次生産力が, 葉上動物群集の個体数および湿重量を増加させたので はないかと考えられる。 今後は,本調査で把握された葉上動物群集が,食物 連鎖を通じてどのように高次捕食者に利用されている のかについて明らかにし,ガラモ場の生物生産機能を より詳しく解明していきたい。 本調査は,「水産基盤整備新技術開発調査 藻場の 浄化機能評価調査」の一環として行われた。 文 献 布施慎一郎.1962.ガラモ場における動物群集.生理 生態 11: 23-45. 飯倉敏弘.1985.ガラモ場の餌料生物環境.月刊海洋 科学 175: 50-56. 環境庁自然保護局.1994.第4回自然環境基礎調査海 域生物環境調査報告書 第2巻 藻場.環境庁, 東京.
Mukai H. 1971. The phytal animals on the thalli Sargassum serratifolium in the Sargassum region, with refer-ence to their seasonal fluctuations. Mar. Biol. 8: 170-182.
Yatsuya K, Nishigaki T, Douke A, Wada Y. 2005. Annual net production of the five Sargassacese species in Yoro, western Wakasa Bay, Sea of Japan. Fish. Sci.
71: 1098-1106. 八谷光介,西垣友和,道家章生,井谷匡志,和田洋藏. 2007.京都府沿岸域の環境特性の異なる生育地 でのホンダワラ科海藻の年間純生産量とその比 較.日水誌,73: 880-890. 横浜康継.2001.海の森の物語.新潮社,東京.