第一一八号土壌物理学会二〇一一年七月
第 118 号 2011 年 7 月
目 次
巻頭言
波多野隆介 . . . 1
論 文
Impacts of soil slaking and drying on release and retention of cations during desalinization from saline soil
A.H.Md. SHAMIM and T. AKAE . . . 3
研究ノート
熱水土壌消毒時におけるサーモグラフィーを用いた地表面温度分布の評価
落合博之·登尾浩助·太田和宏·北浦健生·北 宜裕·加藤 高寛 . . . 13 植生下における田面水の対流を誘発する要因について
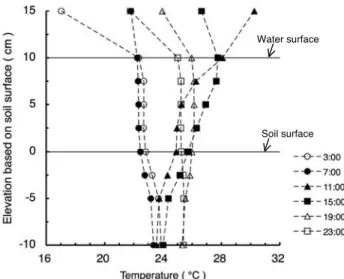
花山 奨·安中武幸 . . . 19
土粒子
北の国から2011春
塚本康貴 . . . 25
会務報告
. . . 27編集後記
. . . 29表紙写真の説明
児島湾干拓地下層土の初期含水比を30 %にした試料(左)と,40 %にした試料(右)のスレーキングの状 況.最適スレーキング含水比の30 %ではもっとも土壌からNa+が放出され,土壌からの除塩を効果的にお こなうことができる.今号掲載の論文「Impacts of soil slaking and drying on release and retention of cations during desalinization from saline soil」をご参照ください.
9 2011
土壌物理学会では,下記の要領で学会賞候補(推薦)を公募いたします.
記 学会賞種類:論文賞
対象論文: 2010 (平成 22 )年度に「土壌の物理性」(第 115, 116, 117 号)に掲載された論文
( original paper )
推薦期限: 2011 (平成 23 )年 7 月 29 日(金),消印有効
推薦書様式:推薦書一部に必要事項をご記入いただき,下記事務局までお送り下さい.
推薦書の様式は下記 URL からダウンロードして下さい.
表彰: 2011 (平成 23 )年 10 月
書類送付先:
〒 060-8589 札幌市北区北 9 条西 9 丁目 北海道大学大学院農学研究院内
土壌物理学会 学会賞選考委員会 事務局 柏木淳一 宛
問い合わせ先:
土壌物理学会事務局庶務幹事 柏木淳一 E-mail : [email protected]
TEL : 011-706-3641 FAX : 011-706-2494 学会ホームページ: http://wwwsoc.nii.ac.jp/jssp3/
学会賞候補の推薦に当たっては,「学会賞規程」「学会賞選考委員会規程」(本誌巻末に掲載)をご
確認下さい.
期日: 2011 年 10 月 28 日(金)
場所:北海道大学大学院農学研究院
参加費: 2,000 円(講演要旨集代)
1 .第 53 回シンポジウム
「フィールド科学としての土壌物理学と社会への貢献」
Soil Physics as a field science and its role to our society
土壌物理学は,土壌中の物質やエネルギーの動態,さらには大気や地質領域との交換現象につい て,土壌に生息する動植物との関連性を考慮して研究する学問であり,フィールド科学の一つで ある。フィールドを対象とした研究で得た知見や成果は,フィールドに返し,そこで生じている 様々な問題の解決に実際に役立てることが土壌物理学には求められる。これまでの膨大な土壌物 理学研究で得られたデータ,測定手法,解析法,それらに基づき開発された技術などの研究成果 は,食料生産だけでなく近年の環境問題の解決に対し,どのように役立てられ,どの程度貢献し てきたのだろう。また,今後はどのような貢献が求められ,そのためにはどんな研究や活動が必 要なのだろうか。本シンポジウムでは,日本の土壌物理研究の歴史を振り返るとともに,食料生 産の維持・向上,地域環境の保全に対して土壌物理学が果たしてきた具体的な貢献事例を紹介し,
あわせて社会貢献の観点から今後の研究の展開方向を論議する。
1 ) 日本の土壌物理研究の歴史を振り返る 長谷川周一(北海道大学名誉教授)
2 ) 畑土壌における排水性改善技術 北川 巌(農村工学研究所)
3 ) 泥炭地の土地利用と保全
井上 京(北海道大学大学院農学研究院)
4 ) 地下水の硝酸汚染防止のための窒素環境容量 中辻 敏朗(北海道立総合研究機構)
5 ) 水田および浅層地下水中の脱窒による環境浄化
江口 定夫(農業環境技術研究所)
「土壌物理研究の最前線 Challenges of Soil Physics 」
個人会員が土壌物理に関する最新,最先端の研究成果をポスター · セッション形式で発表する プログラムです.皆様の積極的な参加を歓迎いたします.発表様式などの詳細については,学会 ホームページをご覧下さい.
3. 企業展示
土壌の状態と変化を計測する技術の開発は,土壌物理学が貢献すべきテーマの一つです.そこ で,土壌物理学会に協賛頂いている企業の方々,あるいは関係企業の方々に参加を呼びかけ,最新 の計測機器やセンサなどを紹介して頂き,理論と実際の隙間を埋めるような土壌物理の計測技術 に関する情報交換の場を提供致します.
4. 情報交換会
詳細については学会ホームページをご覧下さい.
5. 参加 · 発表申し込み方法
詳細については学会ホームページをご覧下さい.
問い合わせ先
土壌物理学会事務局庶務幹事 柏木淳一
〒 060-8589 札幌市北区北 9 条西 9 丁目
北海道大学大学院農学研究院 土壌保全学研究室 E-mail : [email protected]
TEL : 011-706-3641 FAX : 011-706-2494
学会ホームページ: http://wwwsoc.nii.ac.jp/jssp3/
土壌物理学会編集委員会
学会誌「土壌の物理性」は, 1959 年(昭和 34 年)の創刊以来,今号で 118 号を迎えます.「土 壌の物理性」の編集 · 発行に際しては,とりわけ閲読者の方に多大なご協力を頂いています.
土壌物理学会編集委員会では,閲読者への謝意を表すべく,ここに 2009 ∼ 2010 年度(平成 21 ∼ 22 年度)に閲読をお引き受け頂いた方の氏名を公表(五十音順 · 敬称略)致します.
今後とも,編集業務へのご支援,ご協力を賜りますよう,お願い申し上げます.
赤江 剛夫 足立 忠司 飯山 一平 石黒 宗秀 井上 光弘 岩田 幸良 大淵 清志 小倉 力 長利 洋 亀山 幸司 川本 治 川本 健 北川 巌 木原 康孝 小松 満 近藤 文義 斎藤 広隆 坂井 勝 鈴木 伸治 高松利恵子 長 裕幸 筑紫 二郎 辻 修 取出 伸夫 中野 恵子 中村 公人 西田 和弘 西村 拓 登尾 浩助 濱田 浩正 濱本昌一郎 原口 暢朗 日笠 裕治 藤川 智紀 藤巻 晴行 前田 守弘 溝口 勝 三石 正一 宮本 輝仁 宮本 英揮 武藤 由子 望月 秀俊 諸泉 利嗣 矢内 純太 弓削こずえ 吉川 省子 渡辺 晋生
注) 投稿原稿と依頼原稿「シンポジウム紹介」を対象とする.但し,「土粒子」「書評」およびシン ポジウム総合討論の紹介原稿は除く.
波多野隆介
1土壌物理学会は,地球陸地の表面近くにある土壌における,水,エネルギー,物質の移動·変換·貯留,および大 気,地下水との交換現象について,土壌に生息する植物,微生物,動物の活動との関係を含めて研究対象としている 学会です.
土壌は,岩石の風化に始まり生物の活動により地表面に生成した唯一地球に存在する自然物です.その生成過程は,
気候(化学反応や生物の活性に影響を与える水,温度,光),生物(有機物を生産して土壌から養分を吸収し,また遺 体を土壌表面に還す植物の活動,植物遺体を分解し養分を再循環させたり,大気の不活性ガスである窒素ガスを固定 したりする土壌微生物の活動,落ち葉を粉砕したり地中に有機物を持ち込んで地中の鉱物と化合させたりするミミズ などの活動),地形(標高により温度が違ったり,斜面の向きにより日当たりが異なったり,窪地には水たまりができ たりして,気候条件を変えたり,生物の生育に影響する),母材(岩石,堆積物,植物遺体など土の基になる材料)に 影響を受け,ながい時間をかけてゆっくりと進行しています.
例えば,年間の長い間を氷に覆われる土地では,表面から2 m以内に氷塊をもつ永久凍土となります.大規模な窪 地には水が停滞し,泥炭地が形成されます.年間半分以上も植物が育たないほど降水量が少ないと塩類土壌ができま す.このように,土壌はその土地の条件に規定されて存在しています.一方で土壌はその土地で植物を育み,食物連 鎖の起点になっています.そこへ,私達が間違えた管理をしたら,あるいは気候が変化したら,その土地固有の土壌 の発達と,その発達に伴う土壌を起点にした食物連鎖は壊れてしまうことは容易に想像がつきます.例えば,温暖化 したら,氷はとけてしまい,水浸しになりそれまで育っていた植物は水没して死んでしまうでしょう.泥炭地を排水 すれば,泥炭を作っている有機物は分解してCO2を出し温暖化を促進するでしょう.塩類土壌に水を撒くのはどう でしょうか?一見よさそうに見えますが,水は液体で動く塩を溶かして移動させます.水を撒くと,液体水が増えて,
植物の水吸収により根の周りに塩が集まってきて,しばらくたつと,塩類濃度は植物が生育できないほど高まってし まいます.土壌の管理は,なかなか難しいことがわかります.
このような土地固有の土壌中における水,エネルギー,物質の移動·変換·貯留を計測し,生物活動との関係を解析 することは,生態系を保全し,食料生産を維持し,持続可能な社会を構築するために欠かせないことが判ります.本 学会は計測方法の開発,解析ツールとしての数値モデルの開発も研究し,広く陸域生態系の保全と利用に貢献するこ とを目指しています.
歴史を振り返りますと,土壌物理学会は,土壌肥料学会,農業土木学会の研究者を中心に,1958年に土壌物理研 究会として発足しました.発足以来,雑誌「土壌の物理性」を年2,3回発行し,現在117号に至っています.この
「土壌の物理性」という用語から,土の重さや,手触り,水持ち,色といった物性しか連想しないかもしれません.し かし,この物性は,土壌中のダイナミックな反応,あるいは土壌そのものがどのように作られ,どのような方向に変 わっていこうとしているのかの一断面を見せてくれている土壌の大切な性質なのです.また,かつて我が国の食料生 産の安定のために,土壌物理研究会監修で「土壌の物理性と植物生育」,「土壌物理性測定法」を出版し,また,近年 では教育への貢献として「土壌物理用語辞典」が出版されています.さらに,土壌物理学に係る教科書のほとんどす べては,本学会員の研究者により執筆されてきました.
気候変動の抑制が叫ばれる中,土壌物理学の知識は益々重要となっています.皆様のご貢献により,さらに土壌物 理学の知識の充実が図られることを期待しております.
1北海道大学大学院農学研究院
cations during desalinization from saline soil
Abul Hasnat Md. SHAMIM
1,2and Takeo AKAE
1Abstract: The mechanism of soil slaking is the breaking of soil aggregates by entry of water which is accompanied by salt releasing process when the soil contains salt. The objective of this paper is to describe the impacts of soil drying and slaking on cations release to outer solution and shift of cations during desalinization under different ini- tial water contents (IWC). A slaking test on natural and air-dried soils was carried out for evaluating the effect of slaking in different IWC (60, 50, 40, 30, 20 and 10 % by weight). After 24 hours immersion in water, Na was pre- dominantly released in every case both of the natural and air-dried soils. At the water content of 30 % that is around optimum slaking water content, maximum Na was released and at the water content of minimum slaking rate the re- lease of Na was lowest. However, too dry condition (10 % water content) did not contribute to release Na more. On the other hand, we did not find any special relationship be- tween the IWC and release of other cations like Ca, Mg and K in outer solution. Most of the Ca2+and Mg2+stay in exchange site (60 to 80 %) in soil and little amounts of them came out in outer solution. Water-soluble cations in slaked and unslaked soils followed the order of Na K>Mg>Ca whereas, the amount of exchangeable state cations followed Na+>Mg2+>Ca2+>K+. As a whole, the proportion of Na released in outer solution of natural soil was greater than that of air-dried soils. The results in- dicate that the water content for optimum slaking and the slower slaking rate is more efficient for desalinizing of Na from the saline soil.
Key Words : soil slaking, soil water content, cations re- lease, desalinization, exchangeable state
1. Introduction
Salinity within irrigated soils clearly limits productivity in vast areas of Japan and other parts of the world. Soil degradation caused by salinization and sodification is of great concern in the modern world because it reduces po- tential agricultural lands (Tanji, 1990; Sadiq et al., 2007).
Although salinity has adversely affected agriculture for thousands of years, the recognition that salt-affected land
1The Graduate School of Environmental Science, Okayama University, Okayama 700-8530, Japan. Corresponding author: Abul Hasnat Md.
Shamim
2School of Agriculture and Rural Development, Bangladesh Open Uni- versity, Gazipur-1705, Bangladesh.
2010年6月29日受稿 2011年2月23日受理 土壌の物理性118号, 3–11 (2011)
can be used for agriculture is relatively recent. Interest in the use of saline land resources has escalated over the last 20 years, with a renewed focus on saline agriculture in a range of countries including Pakistan (Qureshi and Barrett- Lennard, 1998), Australia (Barrett-Lennard and Malcolm, 1995; Marcar et al., 1995; Bennetta et al., 2009), the Mid- dle East and North Africa (ICBA, 2006). In humid areas like Japan, residual salt in polder soil and salt in ground water affected by sea water intrusion can cause salt accu- mulation and damage crop growth, in particular, on polders and low land areas along sea coasts.
In reclaiming those saline soils to find out the effective (an efficient and low cost) method is required. Soil slaking is the process of soil aggregates collapse when they are rewetted after drying. The slaking has long been studied from the stand point of stability of aggregates. However, it has not been studied from that of salt removal. Drying followed by rewetting and slaking is commonly found in a natural soil processes. During the process, salt in the soil moves and accumulates to inner and outer surface of soil blocks and released to outer solution. But the details of cation shifting are not well understood. Akae et al. (2003) had also reported that slaking is the salt releasing process and salt concentration was decreased from shallow layer to the deeper layer accompanied with land drying processes.
Note that breakdown of soil aggregates results in collapse of pores, which reduces infiltration rate, leads to runoff and erosion, and may, subsequently cause soil degradation.
Our previous research successfully identified the opti- mum water content for slaking of a studied soil and salt release from soil blocks (Shamim and Akae, 2010). The optimum soil slaking occurred when the gravimetric wa- ter content was around 30 % equivalent to pF 4.25 (1800 kPa). It is close to the shrinkage limit (31.8 %) which is the critical water content for air-entry of this soil. The results revealed that the maximum salt is released at the soil water content of maximum slaking. In addition, the amount of salt released into equilibrium water after 24 hours immer- sion was proportional to the fraction of slaked soils (slak- ing rate). Here, we hypothesize that desalinization may be enhanced by simply putting the soil at the proper soil water content by land drying practice or by rewetting.
In this study, the amount of Na in the outer solution
Table 1 Fundamental properties of Kojima Bay Polder (paddy field; depth: 50 – 70 cm).
Properties Unit
Texture Silty clay
Clay 38.2 %
Silt 50.4 %
Sand 11.4 %
Soil pH 7.5
(Soil : Water=1 : 2.5)
Hardness 3.83 mm
Particle density 2.51 g cm−3
Plastic limit 39.5 %
Liquid limit 72.9 %
Electrical Conductivity 2.92 dS m−1 (Soil : Water=1 : 2.5)
Exchangeable ions (Bolt et al., 1976)
Sodium 19.6 c molckg−1
Potassium 3.26 c molckg−1
Calcium 7.72 c molckg−1
Magnesium 10.7 c molckg−1
Water-soluble ions (Soil : Water=1 : 5 by weight)
Sodium 8.45 c molckg−1
Potassium 0.74 c molckg−1
Calcium 0.28 c molckg−1
Magnesium 1.26 c molckg−1
surrounding the slaked soil blocks was mainly discussed, which is an exact measure of Na exclusion from the soil block. In addition, sites and states (exchangeable sites and soluble salts) of cations in soil were examined.
2. Material and methods
2.1 Sample collection and analysis method The soil was collected from the depth of 50 to 70 cm (salinized layer) of Kojima Bay Polder (paddy field:
34◦32’15.1” N and 133◦55’37.0” E), located in Okayama prefecture in western Japan. The soil is classified to Ochric Gley Sols and the land use is rice cultivation. The clay minerals of the soil are composed of mainly halloysite- illite intermediate, nontronite and montmorillonite accom- panied with quarz, feldspars, chlorite and free sesquioxides (Kawaguchi et al., 1957). The disturbed soil samples were air-dried and mixed with distilled water at the ratio of 1 : 5 by weight. Then the supernatant water was taken and EC1:5 were measured using a portable electrical conductivity me- ter (B-173; Horiba Ltd.). The soil pH was measured in a 1 : 2.5 (Soil : Water by weight) suspension using a portable pH meter (B-212; Horiba Ltd.).
Soluble cation concentrations were measured using an atomic absorption spectrophotometer (AAS; Z 5300; Hi- tachi Ltd.) in the supernatant water after centrifuging the natural soil. Insoluble salts and exchangeable cations were extracted using ammonium acetate. The 1.0 g of the
disturbed air-dried soil was mixed with 200 ml solution (0.0114 M SnCl2.6H2O and 1 N CH3COONH4) then the mixture was shaken for 1.5 hours. After settling and cen- trifuging, the cations in the supernatant were analyzed by the AAS. Finally, we subtracted the amount of free ions from that of the total ions to obtain true amount of ex- changeable cations (Bolt et al., 1976). Fundamental phys- ical properties of soils; particle size distribution, soil den- sity, hardness, Atterberg Limits were measured by the stan- dard methods of the Japanese Geotechnical Society (The Japanese Geotechnical Society, 2000).
2.2 Fundamental properties of the studied soil Fundamental properties of the studied soils are given in Table 1. The studied soil showed a silty clay texture (clay 38.2, silt 50.4 and sand 11.4 %); the pH and EC1:5 were 7.5 and 2.92 dS m−1, respectively. The soil has relatively higher liquid limit of 72.9 %. Both the water-soluble (8.45 c molckg−1) and exchangeable ion Na (19.6 c molckg−1) of the natural soil were higher than that of other ions like K, Ca and Mg (Table 1). The mass basis natural water content of the studied soil was 94.9 %.
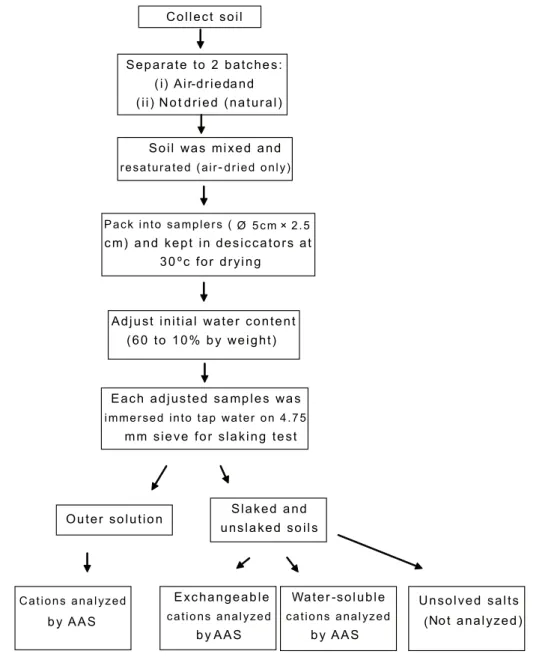
2.3 Preparation of soil sample for slaking test The flow chart for slaking test is given in Fig. 1. The slaking test was conducted at the Agricultural Land Re- search Laboratory, Graduate School of Environmental Sci- ence, Okayama University, Japan during February, 2009 following basically to Experimental Guide of Physical- Mechanical Properties of Soil (The Editing Committee of Experimental Guide of Physical-Mechanical Properties of Soil, JSIDRE, 1983). The natural soil was separated into two batches, one batch was air-dried and another was not dried (natural). Each batch of soil was mixed thoroughly and the air-dried batch was re-saturated. The soils were packed into stainless steel cylinders (2.5 cm height and 5 cm diameter) by pushing them into the soil. The speci- mens were kept in a desiccator at 30◦C for drying treat- ment to attain different initial soil water contents of 60, 50, 40, 30, 20 and 10 % by weight. The weight of each specimen was monitored carefully until the desired water contents. The each water content treatment was replicated thrice. After completing water content adjustment the soil specimens were sealed and kept in a refrigerator.
Lastly, the each soil specimen was placed on the 4.75 mm sieve and immersed into tap water (EC: 0.112 dS m−1, volume: 9080 cm3) for slaking test. After 24 hours immer- sion in the water the slaked (fell down through the sieve) and unslaked (remained on the sieve) soils were collected and weighted separately. The cations in the extract solu- tion (Soil : Water=1 : 5) from the slaked and the unslaked soils were measured by AAS. The exchangeable cations of the slaked and unslaked soils were also measured by the same method described previously.
Fig. 1 Flow chart for slaking test.
2.4 Calculation of slaking rate of soil
The slaking rate, SR (%) was calculated by using the following equation;
SR(%) =s/(s+u)×100 (1) Wheresrepresents the weight of the slaked soil andu indicates the weight of the unslaked soil.
2.5 Calculation of cations in solution and soil The salt released into outer solution (Mi) was calculated by the following equation;
Mi=Ci×Vw (2) WhereCiis concentration of the cations;Vwrefers to the volume of the outer solution of the slaking test.
As the cation concentrations were measured on 1 : 5 so- lution (C1:5), the amount of a cation in the slaked soil,Ms
is given by equation (3),
Ms= (Cs1:5×5×Ws)/ρw (3) WhereWsrepresents the weight of soil;ρwis the density of the water. Similarly, cation in the unslaked soil,Muis given by equation (4);
Mu= (Cu1:5×5×Ws)/ρw (4) The total cation remains in the soil,Mt, is given by sum ofMsandMu.
Mt=Ms+Mu (5) Letting the amount of released Na in the outer solution asRNa, then desalinization rate of Na ion on soluble salt, DR, is defined by equation (6).
DR(%) =RNa/(RNa+Mt,Na)×100 (6)
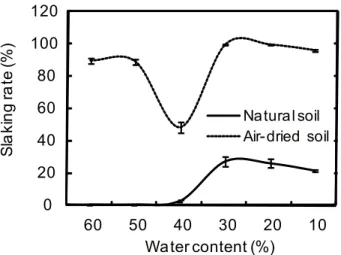
Fig. 2 Dependence of slaking rate against initial water contents after 24 hours immersion in water. Vertical bar indicates±SE of three replicates.
WhereDRis the fraction of Na released into the outer solution divided by the sum of Na in outer solution, water- soluble Na in the slaked and the unslaked soils. It is noted that thisDRdoes not include the exchangeable Na in the soil, nor the confined salt.
3. Results and discussion
For discussing the displacement of cations from a site to site, we specified the sites into four categories (phases): (1) free cations in outer solution, (2) water-soluble cations in soils (slaked and unslaked) and (3) exchangeable cations.
In addition, some salts may remain in confined or stagnant pores, although the amount of that cannot be measured.
3.1 Effect of initial water content on slaking rate Dependence of slaking rate on water content is shown in Fig. 2. The bars in the figure show the standard error of three replicates.
3.1.1 Natural soil
The slaking rates of the specimen at 60 and 50 % water content were only 0.15 and 0.16 %, respectively, after 24 hours immersion. It may be due to the sample was initially saturated and contained no entrapped air, resulting the low force of escaping air. Under the water content of 40 %, the slaking rate, 2.54 %, was higher than that of 50 %.
This indicates that the natural soil started to slake below this water content. A significant change was observed at water content of 30 %. The slaking rate (27.3 %) was much higher in comparison with other water contents. It seems due to that the initial water content of 30 % was close to shrinkage limit and contained more air than that of 40 to 60
%. It resulted higher force of escaping air pressure, which is favourable condition for slaking. The slaking rate kept the almost same value (26.0 %) at water content of 20%.
3.1.2 Air-dried soil
On the other hand, 88 – 89 % of the air-dried specimens were slaked at water contents of 60 and 50 % which in-
dicates that after experiencing air-drying, soil changed to slake much more easily. The slaking rate was very high (99 %) under 30 and 20 % in comparison with any other water contents. The slaking rate at water content of 10 % was comparatively higher than that of 60 and 50 and 40 % but lower than 30 and 20 % water content in both of natu- ral and air-dried soils (Fig. 2). This is attributed to that the strong linkage developed between soil particles by the in- tensive drying, which might enhance resistance to slaking.
3.1.3 Difference between natural and air-dried soil
The slaking rate of air-dried soil was higher than that of the natural soil at all water contents. It is due to that air- drying increased entrapped air than the natural soils at the same water content, resulting the higher force of escaping air pressure. Much more bubbles were observed during slaking of the air dried soil than the natural soil.
3.2 Effect of initial water content on cations in the three phases
Table 2 and Table 3 show the variance of measurement on amount of shifted cations among three categories. They also express the precision of each cation measurement in different water contents. These tables reveal that the cations measurement of Na, Ca and Mg is statistically re- liable enough because the range is below 25 % against the mean values. Note that the variance of K measurement in water-soluble phases was so large in comparison with other cations in both the natural and the air-dried soils. This is due to critically small values of K against precision of mea- surement, but contribution of K is not important in desalin- ization from saline soil.
3.3 Cations released into outer solution after 24 hours immersion
Fig. 3 shows the cations released into outer solution af- ter 24 hours immersion of different pre-drying treatment (natural and air-dried) of soils. The bars in the figure show range of the measured values, indicating the variance of measurement is small enough statistically. The figure shows that Na exists predominantly in the outer solution and the release of Na is maximum at water content of 30
%.
3.3.1 Natural soil
At the lower water content of 20 and 10 %, the amount of Na released to outer solution (RNa=0.25 mmol g−1and 0.25 mmol g−1, respectively) were high, and it was high- est at 30 % (0.35 mmol g−1). TheRNaat 60, 50 and 40
% water content were 0.185, 0.18 and 0.19 mmol g−1, re- spectively. The difference in the total Na under different water content is mainly due to the amount of Na in the outer solution. The fractions of Na in outer solution were 74.6, 73.2, 76.7, 71.5, 70.1 and 65.9% at water content of 10, 20, 30, 40, 50, 60%, respectively. At water content of
Table 2 Mean of range/average ratios on amount of cations in three phases in natural soil.
Phases Water content Na K Ca Mg
∗IV (%) IV (%) IV (%) IV (%)
Outer solution 60∼10% 17.5 14.3 23.3 16.1
Exchangeable 60∼10% 15.3 25.6 16.8 13.4
Water-soluble 60∼10% 22.8 75.7 0.18 15.5
∗IV (Index of Variance)=mean{range (maximum value−minimum value)/average}on cation concentration of different water content. Measurements were replicated thrice on each water content, i.e., n=18.
Table 3 Mean of range/average ratios on amount of cations in three phases in air-dried soil.
Phases Water content Na K Ca Mg
∗IV (%) IV (%) IV (%) IV (%)
Outer solution 60∼10% 17.7 14.1 23.4 18.1
Exchangeable 60∼10% 8.5 12.8 12.6 17.5
Water-soluble 60∼10% 17.3 75.7 2.30 1.30
∗IV (Index of Variance)=mean{range (maximum value−minimum value)/average}on cation concentration of different moisture content. Measurements were replicated thrice on each water content, i.e., n=18.
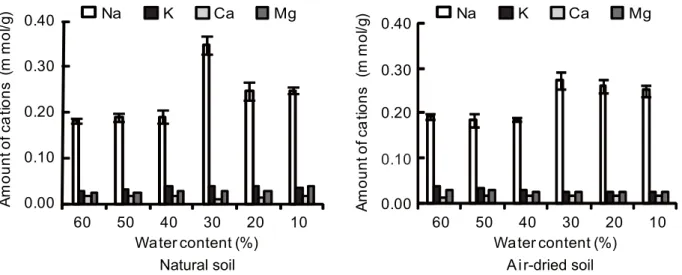
Fig. 3 Cations released into outer solution after 24 hours immersion in different pre-drying treatments. Vertical bar indicates±SE of three replicates.
30%, maximum Na was released from confined or stagnant pores to outer solution because the maximum slaking oc- curred and collapsed aggregates at this water content (Fig.
2). At water content of 10 %, samples slaked in short time and theRNawas low as 0.25 mmol g−1. It was shown that very dry condition and quick slaking did not contribute the more Na release from the soil.
3.3.2 Air-dried soil
At water content of 30 and 20 %, theRNawas 0.27 and 0.26 mmol g−1, respectively. On the other hand, when the soil was in the driest condition of 10 % water content slaking made limited contribution toRNa(0.25 mmol g−1) which was equal to that of the natural soil.
3.3.3 Difference between natural and air-dried soil
Both the natural and air-dried soil followed the same trend for releasing Na in relation to the initial water con- tents. The water content above 40 % showed lessRNa, and below water content of 30 %RNawas high. But the effects were more pronounced in the natural soil. The maximum release of Na occurred around at the coincident water con- tent as maximum slaking. The results indicate that higher water content and too rapid slaking at low water contents were not efficient for removing Na from the soil block.
In terms of other cations release like Ca, Mg and K, all the soils show almost the similar trends. Note that very little amount of Ca and Mg comes out to outer solution.
The release of cations to outer solution in soils followed the order of NaK>Mg>Ca, and drying did not affect the composition of K, Mg and Ca except for a slight increase in Mg and slight decrease in K in a few cases (Fig. 3).
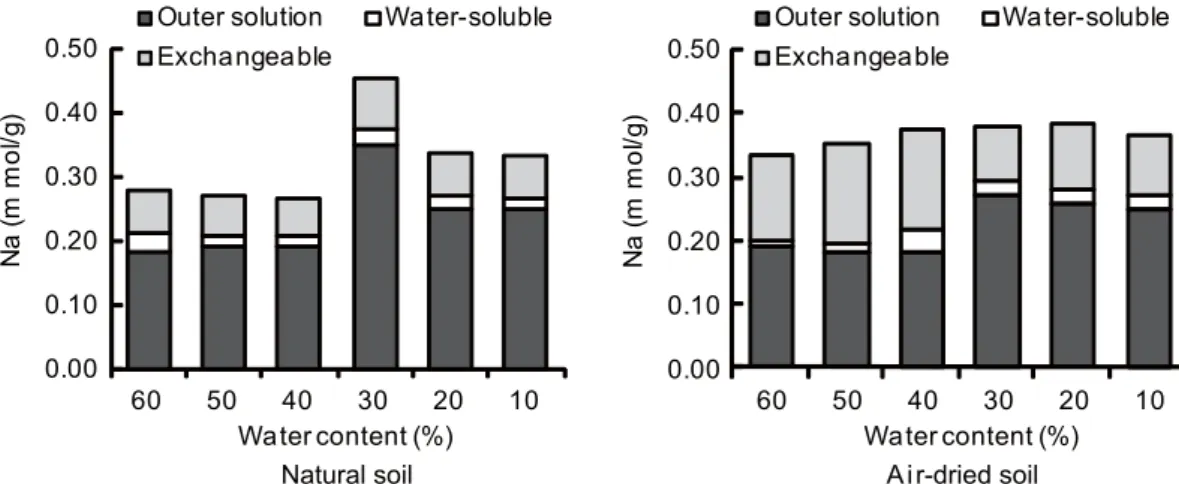
Fig. 4 Amount of Na in outer solution and left in soils after 24 hours immersion under different initial water contents.
Fig. 5 Amount of K in outer solution and left in soils after 24 hours immersion under different initial water contents.
3.4 Impacts of slaking and drying on water- soluble cations in soils
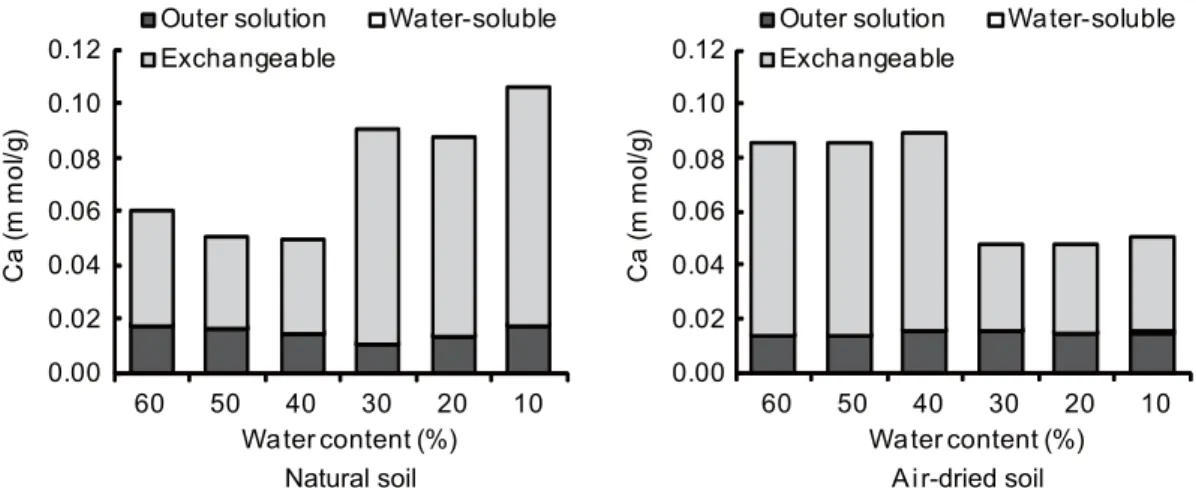
Fig. 4, 5, 6 and 7 shows the sites and amounts of each cation (Na, K, Ca and Mg) after 24 hours immer- sion, respectively. The site where the cations exist is di- vided into four categories; outer solution, exchangeable state and water-soluble state in the soil and salts in con- fined pores which cannot be measured. It is seen that the fraction of the water soluble state is relatively very small.
Among them Na showed much higher values than the other cations, showing slight increase with drying. We did not find any significant differences in amount of other water- soluble cations like Ca, Mg and K in the slaked and un- slaked soils in almost all the cases.
3.4.1 Natural soil
In terms of water-soluble Na (after 24 hours immersion) in slaked and unslaked soils, more Na (8 to 10 %) existed in the soil at higher water content (60 %). This is because some of Na stayed in stagnant part inside the soil in higher water contents. On the other hand, when soil slakes at lower water content the Na staying in soils was lowest pro- portion (5 %) which might be due to the Na stayed mainly
close to the surface. It was found higher water content was not effective from the stand point of Na release from soil.
The water-soluble K, Ca and Mg in soils were in small amounts (<0.02 mmol g−1) in both the higher and lower water contents.
3.4.2 Air-dried soil
The higher water content of 60 and 50 % held less Na (2 to 3 %) as water soluble than the natural soil which means most of the Na released into outer solution. This is be- cause, the air-dried soil at that water content slaked more than the natural soil. It is due to decrease in the Na stay- ing in the stagnant part inside the aggregates. The water- soluble Ca and Mg in air-dried soil followed the same trend as the natural soil.
3.4.3 Difference between natural and air-dried soil
At lower water content the air-dried soil held slightly more water-soluble Na than that of the natural soil. But the amounts of water soluble cations were affected very little by the drying. The amount of water-soluble cations followed the order of NaK>Mg>Ca in all these soils after 24 hours immersion.
Fig. 6 Amount of Ca in outer solution and left in soils after 24 hours immersion under different initial water contents.
Fig. 7 Amount of Mg in outer solution and left in soils after 24 hours immersion under different initial water contents.
3.5 Impacts of slaking and drying on exchange- able cations in soils
3.5.1 Natural soil
In terms of exchangeable cations, Na was slightly af- fected by slaking and drying after 24 hours immersion (Fig. 4). The lower water content held slightly higher ex- changeable Na than higher water contents, especially at 30
%. It means a part of Na on exchange sites was replaced by the other exchangeable cations during drying and slaking under higher water content. Exchangeable K+below water content of 30 % was higher than that of above 40 % water contents. Most of the Ca2+and Mg2+stay in exchange site (60 to 80 %) and showed much higher proportion at lower water contents in the natural soil (Fig. 6 and Fig. 7).
3.5.2 Air-dried soil
The air-dried soil showed the different trends in remain- ing exchangeable Na from the natural soil. Note that the cations exist in exchangeable state at highest amount at wa- ter content of 40 % (Fig. 4). This result is very special, the soils at this water content did not slake well in comparison with other water contents (Fig. 2). Whereas, the air-dried soils show exchangeable K+ is low in lower water con- tents different from that of Na (Fig. 5). In terms of Ca2+
and Mg2+, the air-dried soil showed similar trends to K+, the exchangeable Ca2+and Mg2+was in lower proportion at lower water contents (Fig. 6 and Fig. 7).
3.5.3 Difference between natural and air-dried soil
The exchangeable Na+ was mainly replaced by Ca2+
and Mg2+ at lower water contents. The results also in- dicate that the exchangeable cations were increased by the effect of drying (ion concentration in equilibrium solution was condensed by drying). This is because the Ca2+and Mg2+ions are more strongly bonded with exchange sites of soil particles due to their higher valence; on the other hand, K+ has strong binding capacity with clay particles in comparison with Na+ions.
The holding of exchangeable cations followed the order of Na+>Mg2+>Ca2+>K+except for a minor increase in Mg2+and slight increase in Ca2+than Na+in few cases under the natural soil. It is due to the presence of insoluble Ca and Mg salts in the original polder soil.
3.6 Desalinization rate to outer solution
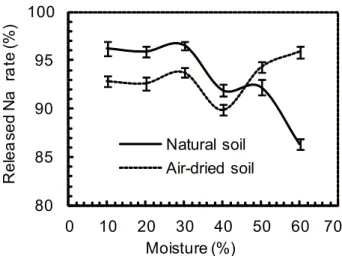
Fig. 8 shows the desalinization rate (DR) to outer so- lution in different pre-drying treatments of soils. In this case, we considered the Na released into outer solution and
Fig. 8 Desalinization rate or released water-soluble Na from soils after 24 hours immersion under different initial water con- tents. Vertical bar indicates±SE of three replicates.
water-soluble Na remaining in slaked and unslaked soils after 24 hours immersion. It is a measure of water soluble salt released to outer solution from all of water soluble salt in the soil block.
3.6.1 Natural soil
It was shown that desalinization rate was higher at lower water content after 24 hours emersion. At higher water contents (60, 50 and 40 %) theDRwas low (DR=86, 92 and 91 % respectively) than that of lower water contents (30, 20 and 10 %;DR=96, 95 and 96 % respectively).
3.6.2 Air-dried soil
Both the higher and lower water contents showed high desalinization rate except for 40 % (DR=90 %). However, if the soil was in excessively dry condition (10 % water content), slaking did not release more Na, resulting the low DR(93 %), which might be due to the strongly trapped Na between the soil particles during drying.
3.6.3 Difference between natural and air-dried soil
The desalinization rate of the air-dried soil showed sim- ilar trend as the natural soil under lower water content, but showed the opposite trend at higher water contents. In the natural soil, at higher water content, soil did not slake well, on the other hand air-dried soil slaked very quickly at the same water content. The trend was similar to that of slak- ing (Fig. 2).
The whole result indicates that the desalinization rate is somewhat affected by the initial water content and by the intensity of pre-drying. The soluble salt release to outer solution is slightly enhanced by soil slaking. Shamim and Akae (2010) had also reported that the salt release is lin- early proportional to the slaking rate in both of the natural and the air-dry soils. The higher salt release was caused by higher slaking rate. At slaking rate is almost zero (60 and 50 % moisture contents) in the natural soil, the proportion
of salt released into water were 86.4% after 24 hours im- mersion. It increased to 96.6 % at 27 % slaking rate in the natural soil. For the air-dried soil, it is highest (93.8 %) at slaking rate close to 100 %. It means that under the op- timum water contents, soil slaking can enhance releasing of soluble salt from the natural soil by 10.2 %. The re- sults suggested that the lower water content and the slower slaking is more efficient for desalinizing of saline soil.
4. Conclusions
In this study, the Na in the outer solution surrounding the slaked soil blocks were measured, which is a substan- tial measure of the amount of Na exclusion from the soil block. In addition, sites and states (exchange sites and sol- uble salts) of cations in soil were examined. The following facts were revealed by this study:
(1) Na was predominantly affected by slaking (and dry- ing) in terms of releasing cations. However, there were not any special differences between water content and released water-soluble cations like Ca, Mg and K.
(2) Most of the Ca2+and Mg2+stay in exchange sites (60 to 80 %) in soil and very few come out in outer solution.
(3) The exchangeable cations of the natural soil were in- creased by the effect of drying. This revealed that shift of cations were caused to exchange phase by drying.
(4) The lower water content (30 %) released more Na, and at the minimum slaking rate the release of Na was lowest in both the natural and air-dried soils.
(5) However, when the soil was too dry condition (10 % water content) and slaking was very rapid, Na release was not enhanced more.
But the further study and research in this challenging field is encouraged in order to discover the most effective and applicable desalinization method for the soil.
References
Akae, T., Nukumizu, H. and Nagahori, K. (2003): Land drying practice and its effects on soil properties in reclaimed lands.
Proc. 2nd International Workshop on Sustainable Develop- ment for Tidal Areas. pp 22–31.
Barrett-Lennard, E.G. and Malcolm, C.V. (1995): Salt land pas- tures in Australia: A practical guide. p.112, Department of Agriculture Western Australia, Perth, Western Australia.
Bennetta, S.J., Barrett-Lennarda, E.G. and Colmera, T.D. (2009):
Salinity and waterlogging as constraints to saltland pasture production: A review. Journal of Agriculture, Ecosystems and Environment, 129: 349–360.
Bolt, G.H., Bruggenwert. M.B.M. and Kamphorst, A. (1976): Ad- sorption of cations by soil. In: Soil Chemistry. A Basic Ele- ments, G.H. Bolt and M.G.M. Bruggenwert (eds). pp. 54–95, Elsevier Sci., Amsterdam.
ICBA (2006): Annual Report 2006. pp.130, International Center for Bio-saline Agriculture, Dubai, UAE.
Kawaguchi, K., Hattori, T. and Waki, K. (1957): Some chemi- cal and mineralogical studies on profiles of dry rice fields of polder land in Kojima basin, Okayama prefecture. Soil Sci- ence and Plant Nutrition, 3: 7–14.
Marcar, N., Crawford, D., Leppert, P., Jovanovic, T., Floyd, R. and Farrow, R. (1995): Trees for salt land: A guide to selecting native species for Australia. p.72, CSIRO Press, Melbourne, Victoria.
Qureshi, R. and Barrett-Lennard, E. (1998): Saline agricul- ture for irrigated land in Pakistan: A handbook. Monograph No.50, Australian Centre for International Agricultural Re- search, Canberra.
Sadiq, M., Hassan, G., Mehdi, S M., Hussain, N. and Jamil, M.
(2007): Amelioration of saline sodic soil with tillage imple-
ments and sulphuric acid application. Pedosphere, 17 (2): 182- 190.
Shamim, A.H.M. and Akae, T. (2010): Effect of pre-dried his- tory and initial water content on soil slaking and desaliniza- tion. Trans. of JSIDRE, 269: 325–330.
Tanji, K.K. (1990): Nature and extent of agricultural salinity. In:
Agricultural salinity assessment and management, Tanji K.K.
(eds). pp. 71–92, American Society of Civil Engineers, New York.
The Editing Committee of Experimental Guide of Physical- Mechanical Properties of Soil (1983): A guide book on experi- ments on physical-mechanical properties of soil. pp. 123–124, the Editing Committee of JSIDRE (In Japanese), Tokyo.
The Japanese Geotechnical Society (2000): The testing on soil mechanics-fundamentals and manuals. pp. 17–48, The Japanese Geotechnical Society (In Japanese), Tokyo.
要 旨
スレーキングの機構は,水の流入による土壌団粒の破壊であり,土壌が塩分を含む時,塩分を解放する 過程を伴う.本論文の目的は、異なる初期含水状態での除塩において,スレーキングと乾燥が,陽イオ ンの外液中への排出と状態の移動に及ぼす影響を述べることである.初期含水比を変えた(60,50,40, 30,20,10 %重量含水比)自然土と風乾土へのスレーキングの効果を評価するため,スレーキング試 験を行った.24時間の水浸後,自然土と風乾土の全てのケースで,Naが卓越して排出された.最適ス レーキング含水比にほぼ等しい比較的低い含水比(30 %)で最大のNaが解放され,スレーキング率が 最低の含水比で,Naの排出は最も低かった.しかしながら,低すぎる含水比(10 %)は,それ以上の Naの解放に寄与しなかった.一方,外液中の他の陽イオンCa,Mg,Kの解放と初期含水比の間には 特別な関係は認められなかった.ほとんど(60∼80 %) のCaとMgは,交換性サイトに停まり,外 液中には僅かしか出て来ない.スレーキング後の土に残存する水溶性陽イオンは,NaK>Mg>Ca の順であり,これに対し,交換態の陽イオンの量はNa>Mg>Ca>Kの順であった.全体として,外 液中に解放されたNa量は自然土の方が風乾土よりも多かった.最適スレーキング含水比と,よりゆっ くりとしたスレーキングが土壌からのNaの除塩により効率的であることが示された.
キーワード:土壌のスレーキング, 土壌水分状態, 陽イオンの解放,除塩,交換態
地表面温度分布の評価
落合博之
1· 登尾浩助
1· 太田和宏
2· 北浦健生
2· 北 宜裕
2· 加藤高寛
1Evaluating the distribution of soil surface temperature using thermography
during soil sterilization with hot water
Hiroyuki OCHIAI1,Kosuke NOBORIO1,Kazuhiro OHTA2,Takeo KITAURA2, Nobuhiro KITA2and Takahiro KATO1
Abstract: The use of methyl bromide, which had been widely used all over the world, was banned in 2005 in Japan, so that it is very important to develop new tech- niques for soil sterilization. Using hot water for soil ster- ilization has become popular in Japan as an alternative for methyl bromide. Many studies have been done on bac- terial survival in soil when hot water was applied. Few studies focused on measurement temperature at multiple locations in the field. Even it is necessary to keep soil tem- perature between the surface and 30 cm deep with 45◦C for 5 h although hydraulic conductivity for hot water var- ied place to place at a field. Therefore, we investigated temperature distribution before and after using hot water for soil sterilization in a greenhouse by measuring soil sur- face temperature using thermography. We also focused on effect of water movement by repacked soil at field with hot water application. We found that a temperature mea- surement was expressed the representative temperature at the field by the sterilization with hot water applied. How- ever, a place, where we dag a hole for putting the sensors, was showed higher temperature than other places because of large amount of hot water application due to higher hydraulic conductivity and to destroyed hard pan layer.
Therefore, we have to take care of refilling a hole after putting the sensors. Otherwise, over estimates of temper- ature occur due to applying large amount of hot water at such a place.
Key Words : hot water sterilization, thermography, tem- perature, soil surface
1. はじめに
近年,土壌消毒の中心となって使われていた臭化メチ ルの使用が,日本では2005年に,世界的にはモントリ オール議定書によって2010年に全面禁止された.その ため,臭化メチルによる土壌消毒の代替技術の一つとし
1Meiji University, School of Agriculture, 1-1-1 Higashimita, Tama, Ka- wasaki, Kanagawa 214-8571, Japan. Corresponding author:落合博之,
明治大学農学部
2Kanagawa Agricultural Technology Center, 1617 Kamiyoshizawa, Hi- ratsuka, Kanagawa 259-1204, Japan.
2010年9月3日受稿 2011年4月19日受理 土壌の物理性118号, 13–17 (2011)
て,1979年から開発が始まった熱水を用いた土壌消毒方 法が,環境にできるだけ負荷を与えない技術として注目 されている.この方法は,水のみを用いているので,環 境に比較的低負荷な土壌消毒法と考えられる.熱水を土 壌に散布し,根群域である地表面から深さ30 cm以内の 土壌を,45◦C以上で5時間保つことによって線虫やバ クテリアを死滅させる(北,2006).しかし,歴史が浅 く,多方面にわたった研究はされてきていないのが現状 である.これまでの研究は,國安·竹内(1986)や西ら
(1990)などが行ってきた熱水消毒の有無による病原菌 や線虫の数を調べることによる作物の品種に対する熱水 土壌消毒効果の評価が主である.環境に低負荷な熱水消 毒法であっても使用法を間違えると,臭化メチルを用い た土壌消毒法と同様に,環境に負荷をかける可能性があ る(永井ら, 2006).必要以上の熱水の散布は,使用水量 とエネルギー経費が増加するばかりでなく,熱水による 溶脱の促進によって必要以上の溶質を土壌から奪い,深 層土壌へ移動させるため(落合ら, 2009),地力の低下や 地下水汚染も起こす危険性がある.そのため,最適な熱 水の散布量を決定する必要がある.加藤ら(2009)は,
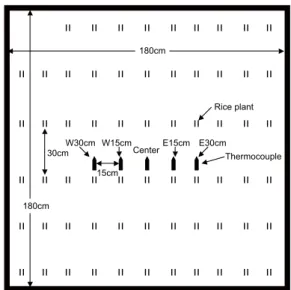
PVCパイプに5 cm間隔で熱電対を付けることで鉛直に 挿入可能な温度センサーを用いて熱水処理時にハウス内 土壌の3地点で深さごとの温度測定を行って,地表面の 温度が65◦C以上のとき深さ30 cmで45◦C以上である ことを報告した.圃場では多点での測定が困難であるこ とに加えて,場所ごとに透水係数や乾燥密度が大きく異 なる可能性があり,このことが土壌の温度上昇に影響を 与えると考えられる.その上で,熱水土壌消毒では,圃 場内すべての場所で根群域である深さ約30 cmまで線虫 やバクテリアが死滅する温度(45◦Cで5時間以上)に 地温を上昇させる必要がある(北,2006).しかし,これ までの研究では,熱水土壌消毒時の土壌温度を多点で測 定した例はほとんどない.そこで本研究では,サーモグ ラフィーを用いて熱水土壌消毒を行ったハウス内の地表 面温度分布を評価することで,熱水土壌消毒の効果を評 価した.また同時に,94◦Cの熱水処理を利用して,土 壌断面の温度を比較することで,センサー設置時の土壌 の撹乱が土壌水分量や地温に与える影響を評価した.
35.6
28.4 35.6 33.8 32.0 30.2 28.4
(b)
ആ ٿ ౨
౨
ཻ ౨
(a)
Photo. 1 熱水散布前の地表面(ビニール被覆無し)(a),熱水
散布前の地表面温度(ビニール被覆無し)(b).
Picture of soil surface before applying hot water (without cover) (a), Thermographic image of soil surface before applying hot wa- ter (without cover) (b).
౨ཻ(ʋˋʇ˂Ĝʠ) ʄˁʑʧɾʑุओ
(a)
(b)
⏾ ؠྯ
ਾ ০༯
⑦
⑬
ȫɭؠʩɼʯ෪ྯऔ
93.5 93.5
77.0 60.5 44.0 27.5 27.5
Photo. 2 熱水散布直後のビニールシート表面(ビニール被覆
越し)(a), 熱水散布直後のビニールシート表面温度(ビニー ル被覆越し)(b).
Picture of soil surface after applying hot water (with cover) (a), Thermographic image of soil surface after applying hot water (with cover) (b).
2. 実験方法
実験は,神奈川県平塚市の神奈川県農業技術センター のガラスハウス内(幅9.0 m,長さ30 m)土壌で行っ た.熱水散布には,神奈川県農業試験センターが中心と なって開発した牽引方式を用いた.牽引方式では,ウイ ンチを用いて散水用鉄パイプを一定速度で引っ張ること で,土壌表面に熱水を定量散水した.本実験では熱水の 温度を94◦Cに,散水パイプの移動速度を2.5 m h−1,散 水量を4000 L h−1(204 L h−1で3時間,散水強度68 mm h−1に相当)となるように設定した.熱水散布時と 散布後は,地表面からの熱損失を低減するために地表面 を耐熱性の高いビニールシートで覆った.ビニールシー トは地表面と接触していることからビニールシート表 面の温度変化が地表面の温度変化を反映しているとみな し,熱水散布前と熱水散布終了直後にサーモグラフィー
(TVS-500EX,NEC)で地表面の温度分布を測定した.
サーモグラフィーの精度は100◦C以下で±2◦Cであ る.また,同時に土壌水分量と温度の測定を経時的に行 うため,温室の入り口から10 m,側壁から4 mの地点 にTDRセンサーを深さ100 cmまで20 cm毎に埋設し,
それぞれのTDRプローブの横に熱電対を埋設した.
3. 結果と考察
3.1圃場全体における熱水処理による地表面温度分布 の評価
Photo. 1に熱水散布前に撮影した通常写真(a)とサー
モグラフィーによる温度分布(b)を示した.ハウス内の 地表面温度は31.0∼34.0◦Cであった.地表面の温度分 布は,ハウスの側壁付近(Photo. 1(b)右側)に比べて ハウス中央(Photo. 1(b)左側)の温度が約1◦Cほど高 かった.これは,測定精度を考慮すると熱水土壌消毒前 のガラスハウス内の土壌表面温度は,ほぼ一様であると 言える.
Photo. 2に熱水散布直後の通常写真(a)とサーモグラ
フィーで測定したビニールシート表面温度分布(b)を表 した.熱水散布中のため,地表面にビニールシートを被 せた.そのため,実際はビニールシートの温度を測定し
た.Photo. 2(b)右上に高温度の部分が確認されたが,
これは終了直後に撮影したため,熱水の一部が土壌中に 浸透しないで地表面に残っている部分として目視で確 認できた.また,熱水が地表面に残っていない場所のビ ニールシート表面温度がハウス内全域で68.0∼73.0◦C で5◦Cの範囲内であることがわかった.西(2001)は黒 ボク土で,北·植草(1999),加藤ら(2009)は関東ロー ムで,地表面温度が,65◦C以上に達していると,深さ
30 cmまでの土壌では45◦C以上で5時間以上保たれた
ことを報告している.従って,本研究の結果から,けん 引方式による熱水散布はハウス内すべての場所で一様に 消毒効果があると考えられる.
3.2熱水処理による地表面温度分布の経時変化
Photo. 3に熱水散布1日後のセンサー埋設場所の通常
写真(a)とサーモグラフィーで測定したビニールシー ト表面温度分布(b)を表した.Photo. 3(b)の左側に ピンク色の部分(黒枠内)があり,他の部分に比べ3∼ 7◦C高いことがわかった.ここは,土壌水分センサー等 を埋設するために掘った穴を埋め戻した部分である.熱 水散布の影響によりセンサーが水没してしまい測定不可 能となったことから,センサー埋設の土壌かく乱の影響 を調査するため,熱水散布9日後に再びセンサー埋設部 分に穴を掘り,土壌断面の温度分布を測定した(Photo.
4(a,b)).Photo. 4(b)は,地表面から深さ70 cmま での土壌断面の温度である.中心より左側がセンサー埋 設時に穴を掘り埋め戻した部分で右側が何もしなかった 部分である.地表面から深さ40 cmまではほぼ等しい温 度分布を示した.このことから,熱水土壌消毒時に約3
∼7◦Cの温度差が起きたとしても,9日後の作土層の地 温はほぼ均一と考えてよいことがわかった.一方,深さ
40 cm以深では右側に比べて左側での温度が平均で約3
◦C高いことがわかった.土壌水分センサー等を埋設す るために掘った穴を埋め戻した部分で乾燥密度と透水係 数が他の部分と異なったため,透水係数が高くなり,深 層土壌へ熱水が選択的に浸透したことにより,熱水散布 9日後でも埋め戻した場所で土壌温度が高かったと考え られる.さらに,熱水土壌消毒前に行った耕起の深さ以 深までセンサー埋設のために穴を掘ったことによって,
耕盤層上部で水平方向の水移動も起こり,より多くの熱 水の浸透が起きた影響と考えられる.地表面からの選択 流に対しては,センサー埋設の際に穴を掘って埋め戻し た部分の土壌沈下が熱水散布後に目視で確認できたこと から,この部分に選択的に熱水が浸透した可能性が大き いと考えられる.このことから,埋め戻しを正確に行わ ない場合,土壌水分量や地温に影響する可能性があると 考えられる.
センサー埋設部分を再び掘り起こす前にビニールシー ト表面温度を調べた.Photo. 5に熱水散布9日後のセン サー埋設場所の通常写真(a)とサーモグラフィーで測 定したビニールシート表面温度分布(b)を表した.セ ンサー埋設のため穴を掘った埋め戻し部分の温度の上昇 はほとんどなくなり,熱水散布翌日に比べ,埋め戻した 場所と通常の場所でビニールシート表面温度の差は,ほ とんどなかった.これは,熱移動が頻繁に起こる地表面 付近では9日間の間に熱拡散によって温度が平衡になっ たと考えられる.また,ビニールシート表面と地表面の 温度差を検証するため,ビニールシートを剥がし,セン サー埋設部分の地表面温度を測定した(Photo. 6(a,b)).
Photo. 5(b)とPhoto. 6(b)の比較からビニールシート 越しとビニールシート無しでの温度差は,2∼3◦Cある が,温度分布はほぼ等しくなることから,ビニールシー ト表面の温度分布が地表面の温度分布を反映していると みなせることがわかった.センサー埋設部分による温度
(a) ო
(b)
䉶䊮䉰䊷ၒ⸳႐ᚲ
䈔䉖ᒁ䊌䉟䊒⒖േᣇะ
52.5 52.5
47.3 42.2 37.0 31.9 31.9
Photo. 3 熱水散布1日後のビニールシート表面(ビニール
被覆越し)(a),熱水散布1日後のビニールシート表面温度(ビ ニール被覆越し)(b).
Picture of soil surface in one day after applying hot water (with cover) (a), Thermographic image of soil surface in one day after applying hot water (with cover) (b).
(a)
(b) 㕙
50 䋙
45.8 45.8
41.2 36.6 32.0 27.5 27.5
Photo. 4 熱水散布9日後の土壌断面(ビニール被覆無し)(a),
熱水散布9日後の土壌断面温度(ビニール被覆無し)(b).
Picture of soil section in nine days after applying hot water (with- out cover) (a), Thermographic image of soil section in nine days after applying hot water (without cover) (b).
(a)
(b)
䈔䉖ᒁ䊌䉟䊒⒖േᣇะ
䉶䊮䉰䊷ၒ⸳႐ᚲ
93.5 93.5
77.0 60.5 44.0 27.5 27.5
Photo. 5 熱水散布9日後のビニールシート表面(ビニール
被覆越し)(a),熱水散布9日後のビニールシート表面温度(ビ ニール被覆越し)(b).
Picture of soil surface in nine days after applying hot water (with cover) (a), Thermographic image of soil surface in nine days after applying hot water (with cover) (b).
差よりも日向と日陰の温度差のほうが明らかに大きかっ た.このことから熱水散布9日後には地表面温度は,ど の部分でもほぼ均等になることがわかり,熱拡散によっ てハウス内の地表面温度はほぼ等しくなることがわかっ た.熱水散布から9日後でのビニールシート表面温度と 地表面温度の比較だったため,地表面の乾燥が進んだこ とが考えられる.それを考慮すると,熱水散布直後や熱 水散布1日後は,地表面とビニールシートが密着してお り温度差はほとんどなかったと考えられる.
4. まとめ
サーモグラフィーを用いた地表面温度解析の結果,熱 水土壌消毒後における地表面での空間的な温度分布はほ とんど一様であることがわかった.このことから,熱水 土壌消毒による土壌温度は,ハウス内全体で線虫やバク テリアを死滅させる条件に十分に達していると考えられ た.しかし,センサーを埋設するために掘った穴を埋め 戻した場所では,熱水散布1日後に地表面温度が3∼7
◦C,他の部分に比べて高くなった.これは,透水係数が 他の部分より大きいことによって起こる選択流により,
他の部分より深い部分まで高温の水が浸透したことが原 因であると考えられた.また,熱水散布9日後は,地表 面の温度分布は,日照の影響や熱拡散の影響により,す べての場所でほぼ等しくなるのに対して,深層土壌では,
(a)
(b)
䉶䊮䉰䊷ၒ⸳႐ᚲ
56.6 56.6
51.5
46.5 41.4 36.3 36.3
Photo. 6 熱水散布9日後の地表面(ビニール被覆無し)(a),
熱水散布9日後の地表面温度(ビニール被覆無し)(b).
Picture of soil surface in nine days after applying hot water (with- out cover) (a), Thermographic image of soil surface in nine days after applying hot water (without cover) (b).
選択流によって起こった温度上昇の影響が残っているこ とがわかった.このことから,センサー埋設後の埋め戻 しを適切におこなうことの重要性を,温度変化を指標に して評価することができたと考えられる.
本研究は,関東ロームのみでの成果であることから,
他の土壌においてもサーモグラフィーを用いて熱水散 布後に地表面温度のばらつきがないかを調べる必要があ り,同時に埋め戻しによる土壌中の温度分布にどのよう な影響があるかを調べる必要があると考えられる.さら に,今回はセンサーの水没により土壌水分量と地温の経 時測定がうまくいかなかったが,今後は,温度·水分セ ンサーによる地温と土壌水分の鉛直プロファイルと熱画 像を併用することで,より詳細な検討が可能であると考 えられる.
引用文献
加藤高寛·登尾浩助·北 宜裕(2009):熱水土壌消毒時にお ける熱·水·溶質移動の測定.明治大学農学部研究報告, 58:
75–84.
北 宣裕(2006):新段階を迎えた臭化メチル規制とその対策技 術 物理的消毒法の効果と普及.野菜茶業研究集報, 3: 7–15. 北 宣裕·植草秀敏(1999):熱湯散布による土壌消毒.農業と
園芸, 54: 105–109.
國安克人·竹内昭士郎(1986):熱水注入による土壌消毒のトマ ト萎ちょう病に対する防除効果.野菜試報, A14: 141–148. 永井耕介·牧浩之·小河 甲·竹川昌宏(2006):熱水消毒にお
ける熱水の温度と量が土壌の化学性に及ぼす影響.近畿中国 四国農研, 8: 12–15.
西 和文·國安克人·高橋廣治(1990):熱水土壌消毒によるダ イズ黒根腐病の防除.菌蕈研究所研報, 28: 293–305.
西 和文(2001):熱水を利用した最新の土壌消毒法.農業およ び園芸, 76: 485–489.
落合博之·登尾浩助·北 宜裕·加藤高寛(2009):熱水土壌 消毒時及びその後の土壌中における溶質動態.土壌の物理性, 112: 9–12.
要 旨
土壌への熱水の浸透が均一でない圃場における研究では,温度分布の状況把握が行われていない.本研 究ではサーモグラフィーを用いて熱水土壌消毒後のハウス内での熱水散布時における地表面温度分布に ついて調べた.同時にセンサー埋設での埋め戻しによる土壌状態の変化によって起こる土壌中の水分移 動の影響を温度変化を指標として評価した.熱水散布後,ハウス内全域で地表面温度分布がほぼ一様で あることがわかり,これまで行ってきた1点での温度測定がハウス内全体の代表値となりうることがわ かった.また,センサー埋設のために掘った穴の埋め戻し部表面では,熱水の浸透の影響と耕盤層破壊 の影響で他の場所より温度が高くなった.このことより,埋め戻し部から選択的に熱水が浸透して深層 土壌で不均一になることがわかり,不適切な埋め戻しが土壌水分量や地温の測定値に大きく影響する可 能性があることがわかった.
キーワード:熱水消毒,サーモグラフィー,温度,地表面