Epicardial Adipose Tissue in the Right Atrium Is Associated with Progression of Atrial Fibrillation and Recurrence after Pulmonary Vein
Catheter Ablation in Patients with Atrial Fibrillation
Hiroki T
ANISAWA*1), Yasushi A
KUTSU1,2), Hiroyuki I
TO1), Kosuke N
OMURA1), Teruo S
EKIMOTO1), Kyoichi K
ANEKO1),
Yusuke K
ODAMA1), Ken A
RAI1), Toshihiko G
OKAN1), Yoshimi O
NISHI1), Akinori O
CHI1), Yumi M
UNETSUGU1), Tatsuya O
NUKI1), Yoshimitsu O
HGIYA3), Hidenari M
ATSUMOTO1),
Mitsuharu K
AWAMURA1)and Toshiro S
HINKE1)Abstract : An increase in epicardial adipose tissue(EAT)in the left atrium(LA)
predicts the progression of atrial fibrillation(AF)and AF recurrence after pulmo- nary vein catheter ablation(CA) . We hypothesized that EAT in the right atrium
(RA)is also associated with the progression of AF and post-CA AF recurrence.
Using 128-slice multidetector computed tomography, EAT volume and atrial volume were measured 3-dimensionally before CA in 68 patients who had proven AF(par- oxysmal AF, 42; persistent AF, 26; mean age, 65±11 years; 42.6% female)with suc- cessful CA and 21 volunteers with sinus rhythm(age, 63±13 years; 52.3% female) . In both atria, EAT and atrial volumes were largest in patients with persistent AF, followed, in order, by those with paroxysmal AF, and then healthy volunteers(P
<0.001) . Increased EAT and atrial volumes in both atria predicted persistent AF
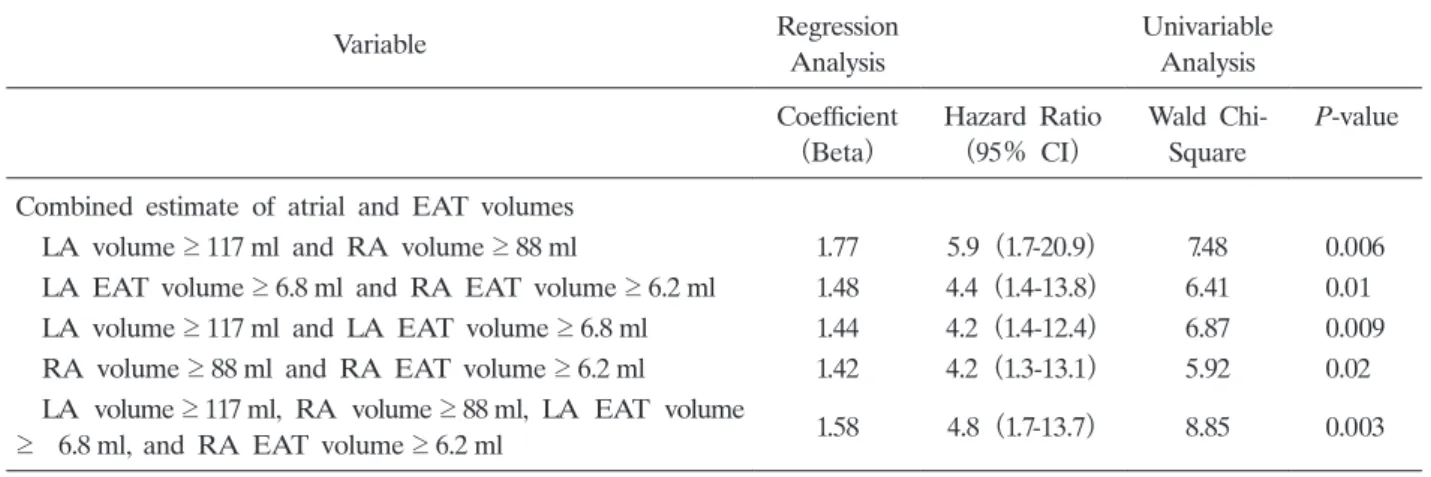
(P<0.001) . Fifteen patients had AF recurrence(22.1%)during the 2-year period after CA. Increased EAT volume in both atria were independent predictors for AF recurrence, and a RA EAT volume ≥ 6.2ml was an independent predictor, with a hazard ratio of 5.47(95% confidence interval, 1.2-24.3; P = 0.03) . The combina- tion of EAT and atrial volume in both atria was a more powerful independent prognostic factor, with a hazard ratio of 4.8(95% confidence interval, 1.7-3.7;
P = 0.003) , and a sensitivity of 60% in 9 of 15 patients, and specificity of 81.1% in 43 of 53 patients,(P = 0.003) . RA EAT is associated with the progression of AF and post-CA AF recurrence.
Key words : atrial fibrillation, adipose tissue, right atrium epicardium, catheter abla- tion, recurrence
Original
1)
Department of Medicine, Division of Cardiology, Showa University School of Medicine, 1-5-8 Hatanodai, Shinagawa- ku, Tokyo 142-8666, Japan.
2)
Showa University Clinical Research Institute for Clinical Pharmacology and Therapeutics.
3)
Department of Radiology, Division of Radiology, Showa University School of Medicine.
*
To whom corresponding should be addressed.
Introduction
Several studies demonstrate that the volume of epicardial adipose tissue(EAT)is associated with the progression of atrial fibrillation(AF)and AF recurrence after catheter ablation(CA) , and these close relationships result from inflammation leading to remodeling of the left atrium
(LA)
1-3). A recent study indicated that the distribution of EAT in the LA is an important trigger for AF
4). On the other hand, right atrial(RA)remodeling has also been reported in patients with AF, and the fibrosis associated with remodeling of not only the LA but also the RA plays an important role in AF recurrence
5)because AF is sometimes initiated by non- pulmonary vein(PV)ectopic beats which arise from the RA side rather than the PV
6,7). Atrial size and EAT volume can be quantified using multidetector computed tomography(MDCT)
imaging
8,9). We hypothesized that RA EAT volume, measured using MDCT, is associated with progression of AF and AF recurrence after CA.
Materials and methods Study population
We recruited consecutive patients who had a history of palpitations and were initially diagnosed with AF at Showa University Hospital, Tokyo, Japan. A diagnosis of AF was made and differentiation between paroxysmal and persistent AF was carried out based on the American Heart Association/American College of Cardiology/Heart Rhythm Society guidelines
10). Before the present study, left ventricular ejection fractions and LA dimensions were measured with 2-dimensional echocardiography. Patients with diseases that could cause pathological fibrosis and adipose tissue replacement in the atrium were excluded from the study. Patients who had ischemic heart disease, valvular heart disease, cardiomyopathy, congenital heart disease, thyroid disease, chronic kidney disease, collagen disease, hematologic disease, inflammatory disease, or malignancy were also excluded from this study. Additionally, patients were excluded if they had pre-excitation syndrome, atrioventricular tachycardia or ventricular tachyarrhythmia, or an implanted pacemaker before the start of the study. After application of the exclusion criteria, 42 patients with paroxysmal AF and 26 patients with persistent AF(mean age, 65±11 years; 42.6%
female)were recruited for this study. Further, for those who did not meet the exclusion criteria, 21 volunteers who had normal sinus rhythm and no history of AF were recruited as the control group(age, 63±13 years; 52.3% female) . All participants provided written informed consent before the study, and the protocol was approved by the institutional review board. This research was approved by the Ethics Committee for Human Research of Showa University (Authorization number, 2592) .
Scan protocol and acquisition of MDCT data
Within one week before CA, all patients and volunteers underwent scanning with a 128-slice
single-source MDCT system(SOMATOM Definition AS+Siemens Medical Solutions, Forchheim,
Germany)when they had less variable rhythm and were not experiencing tachyarrhythmia(<
75 bpm) . The procedure was conducted without contrast media to measure atrial volume and EAT volume. Each scan was performed in a single breath hold in the craniocaudal direction, from the aortic arch to the diaphragm. The scan was gated to the cardiac cycle through electrocardiogram(ECG)synchronization with the following parameters: collimation, 2 64 0.6 mm; rotation time, 300 msec; tube voltage, 120 kV; effective tube current, 800 mA; and pitch, 0.3.
Raw CT data were reconstructed with algorithms that were optimized for retrospectively ECG- gated segmental reconstruction with a slice thickness of 0.6 mm and increment of 0.3 mm. ECG- gated data sets were reconstructed at the point of the cardiac cycle that corresponded to atrial end diastole
9).
Measurement of atrial volume and EAT volume with MDCT
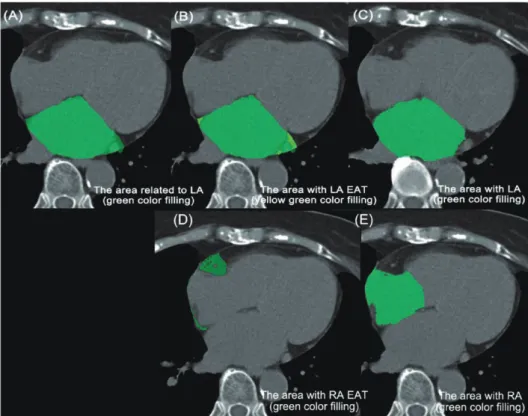
Reconstructed CT image data were transferred to a workstation for post-processing(Synapse Vincent; Fujifilm, Tokyo, Japan) . EAT volume and atrial volume were measured 3-dimensionally in all patients with non-contrast-enhanced images(Fig. 1) . The area of EAT was calculated
Fig. 1. Quantitative measurement of epicardial adipose tissue(EAT)volume and atrial volume
(A)The area related to the left atrium(LA)was traced in green.
(B) The area related to the LA EAT(yellow-green)was detected by assigning Hounsfield units(HU)of 50 to 200.
(C) The LA area(green)was detected by assessing HU of more than 0.
(D) The area related to the right atrium(RA)EAT(green)was detected in a similar manner to the LA volume measurement.
(E) The area related to the RA(green)was detected in a similar manner to the LA
volume measurement.
by tracing the region of interest(ROI) , which included each atrium with EAT. The ROI was manually placed outside the line of the visceral pericardium on a cross-sectional axial image.
The area outside the traced pericardium was excluded
11). Areas of EAT surrounding the LA and RA were separately assessed by tracing the ROI containing atrium and EAT. EAT volume was detected by assessing Hounsfield units(HU)of 50 to 200, and atrial volume was detected by assigning HU of more than 0. Volumes were reconstructed from contiguous slices of axial images from the left main coronary artery to the apex and were summed automatically
12). The measurements were performed offline by two blinded observers. To determine the reproducibility of MDCT, two investigators repeated the EAT measurements at two different time points for 30 randomly selected participants. The inter-observer and intra- observer correlations for RA EAT were r= 0.951 and r = 0.953, respectively(P<0.001) , and r = 0.96 and r= 0.944, respectively, for LA EAT(P<0.001) .
PV CA
The NAVX-Ensite system(St.Jude Medical, Inc., St.Paul, MN, USA)was used for nonfluoroscopic 3-dimensional catheter orientation and CT image integration. After one transseptal puncture and two long-sheath insertions in the LA, radiofrequency ablation and ring catheters were positioned, and the CA procedure was performed with a steerable sheath
(Agilis; St.Jude Medical, Inc.) . The PV ablation procedure was essentially ipsilateral PV isolation. Line ablations(mitral isthmus, roof, and bottom lines in the LA)were added in patients with persistent AF. An irrigated catheter was used with an initial maximum power of 25-35W, depending on each physician and by the dragging method used with a steerable sheath.
Electrical isolation of all PVs was attempted with bidirectional conduction block in all patients.
After the procedure, successful CA was confirmed by PV stimulation.
Follow-up after PV CA
After CA, all patients had prospective follow-up at least once every 4 weeks without antiarrhythmic drugs. Recurrence of AF was assessed from one month to two years, and recurrence was defined as documented AF by 12-lead ECG and at least one 24-hour Holter monitoring to observe cardiac rhythm. In addition, external loop recording was performed for as long as possible. Further, 12-lead ECG and Holter monitoring were performed during follow-up for patients who reported an irregular heart beat or palpitations.
Statistical analysis
Comparisons between groups were performed with 1-way analysis of variance, unpaired t test,
Fisherʼs exact test, or a Bonferroni test for continuous variables, and the chi-square test for
categorical variables. Associations between predictors and AF recurrence were formally tested
by construction of a Cox proportional hazards model with regression analysis. The tolerance of
the variance inflation factor(VIF)was calculated to evaluate multicollinearity in the multiple
regression analysis model. For descriptive purposes, receiver operator characteristic analysis
was performed to define thresholds for those factors, and the difference was compared using the area under curve(AUC)with the jackknife method. The cutoff values were defined by minimizing the expression of(1 – sensitivity)
2+(1 – specificity)
2on the AUC. Statistical analysis was performed with SPSS for Windows, version 20(SPSS Inc., IBM, Chicago, IL, USA) . A probability value of< 0.05 was considered significant.
Results
Patient characteristics
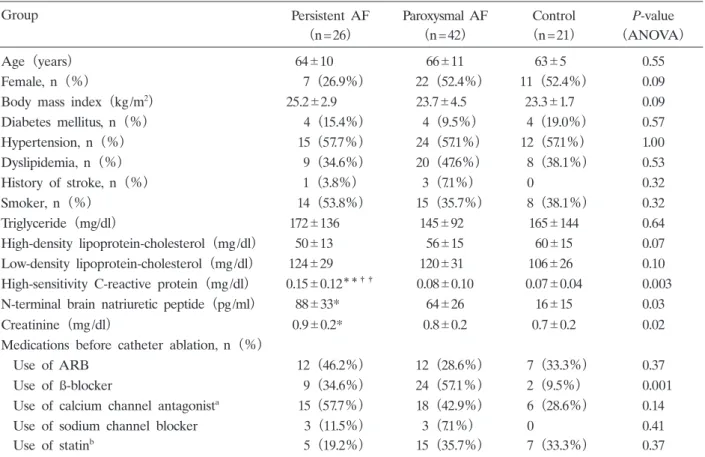
There were no significant differences in age, gender, body mass index(BMI) , or coronary risk factors between the patients with persistent AF, paroxysmal AF, and the control group. Low- density lipoprotein(LDL)-cholesterol was similar between the three groups(P = 0.10) , but high- sensitivity C-reactive protein(hsCRP)was higher in patients with persistent AF than in those with paroxysmal AF or controls(P = 0.003; Table 1) . LA diameter on echocardiography was greater in patients with persistent AF than in those with paroxysmal AF(46±5.3 mm vs. 40.7±
5.3 mm, respectively; P= 0.001) , but left ventricular ejection fractions were similar in patients with
Table 1. Baseline characteristics of patients with persistent AF, paroxysmal AF, and control participants
Group Persistent AF Paroxysmal AF Control P-value
(n=26) (n=42) (n=21) (ANOVA)
Age(years) 64 10 66 11 63 5 0.55
Female, n(%) 7(26.9%) 22(52.4%) 11(52.4%) 0.09
Body mass index(kg/m
2) 25.2 2.9 23.7 4.5 23.3 1.7 0.09
Diabetes mellitus, n(%) 4(15.4%) 4(9.5%) 4(19.0%) 0.57
Hypertension, n(%) 15(57.7%) 24(57.1%) 12(57.1%) 1.00
Dyslipidemia, n(%) 9(34.6%) 20(47.6%) 8(38.1%) 0.53
History of stroke, n(%) 1(3.8%) 3(7.1%) 0 0.32
Smoker, n(%) 14(53.8%) 15(35.7%) 8(38.1%) 0.32
Triglyceride(mg/dl) 172 136 145 92 165 144 0.64
High-density lipoprotein-cholesterol(mg/dl) 50 13 56 15 60 15 0.07
Low-density lipoprotein-cholesterol(mg/dl) 124 29 120 31 106 26 0.10 High-sensitivity C-reactive protein(mg/dl) 0.15 0.12
**††0.08 0.10 0.07 0.04 0.003
N-terminal brain natriuretic peptide(pg/ml) 88 33* 64 26 16 15 0.03
Creatinine(mg/dl) 0.9 0.2* 0.8 0.2 0.7 0.2 0.02
Medications before catheter ablation, n(%)
Use of ARB 12(46.2%) 12(28.6%) 7(33.3%) 0.37
Use of ß-blocker 9(34.6%) 24(57.1%) 2(9.5%) 0.001
Use of calcium channel antagonist
a15(57.7%) 18(42.9%) 6(28.6%) 0.14
Use of sodium channel blocker 3(11.5%) 3(7.1%) 0 0.41
Use of statin
b5(19.2%) 15(35.7%) 7(33.3%) 0.37
Values are mean standard deviation, unless otherwise indicated.
*P <0.05,
**P <0.01 vs. control;
††P<0.01 vs.
paroxysmal AF group. aCalcium channel antagonist includes bepridil; bStatin is hydroxymethylglutaryl-CoA reductase
inhibitor. AF; atrial fibrillation, ANOVA; analysis of variance, ARB; angiotensin converting enzyme inhibitor or recep-
tor blocker.
different types of AF(persistent, 61.6%±9.8%; paroxysmal, 58.7%±8.4%) .
EAT volume for progression of AF
In both atria, EAT and atrial volumes were largest in patients with persistent AF, followed, in order, by patients with paroxysmal AF, and then control individuals with sinus rhythm(P<0.001;
Fig. 2) . In patients with AF, persistent AF was predicted by RA EAT volume(AUC = 0.82;
Fig. 2. Comparison of epicardial adipose tissue(EAT)and atrial volume. EAT and atrial volumes were greatest in patients with persistent atrial fibrillation
(AF) , followed, in order, by patients with paroxysmal AF, and then control
individuals with sinus rhythm. RA; right atrium, LA; left atrium.
P<0.001) , LA EAT volume(0.82; P<0.001) , RA volume(0.67; P= 0.02) , and LA volume
(0.8; P<0.001) . RA EAT volume was correlated with LA EAT volume(r =0.69) , RA volume
(r =0.32) , LA volume(r = 0.42) , and BMI(r =0.47)in patients with AF(P<0.001 for each) .
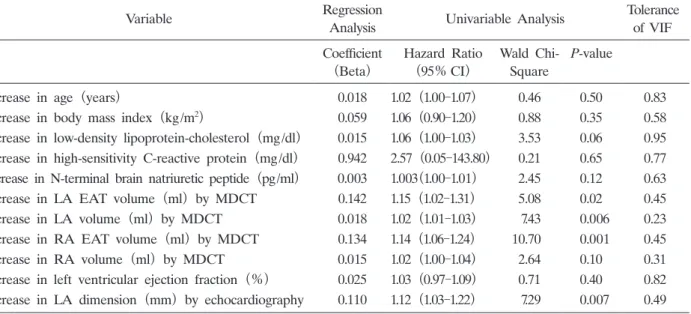
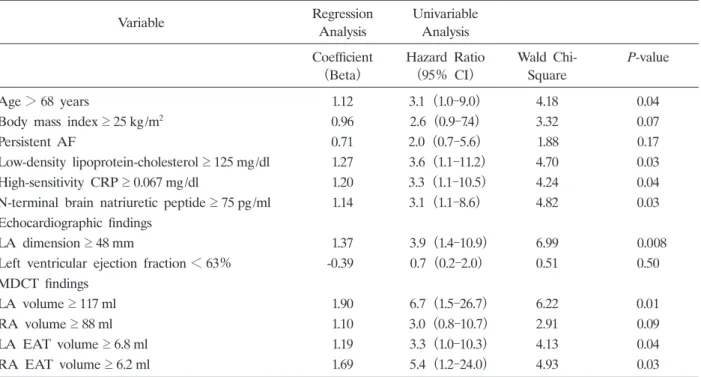
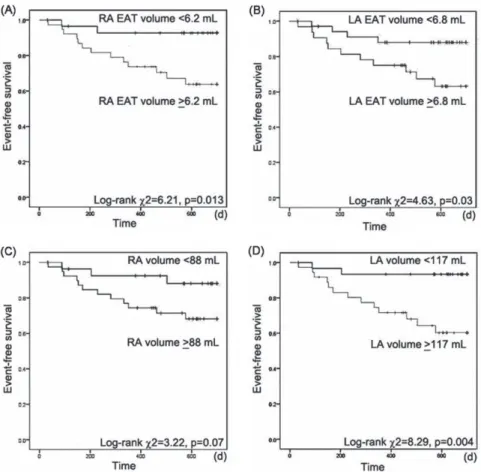
Continuous variables for predicting AF recurrence
All patients had follow-up for two years after CA, and 15 patients had AF recurrence
(22.1%) . Patients with persistent AF and paroxysmal AF had a similar number of recurrences of AF(persistent, 8 of 26 patients[30.8%] ; paroxysmal, 7 of 42 patients[16.7%] ; P= 0.23) . LDL-cholesterol levels were higher in patients with AF recurrence than in those without AF recurrence(P =0.04; Table 2) . Patients receiving statin treatment were not likely to develop AF recurrence(P = 0.05) . AF recurrence was associated with RA EAT volume(P =0.001) , LA EAT volume(P = 0.02) , and LA volume(P =0.006)on MDCT, as well as LA dimension
Table 2. Patient characteristics after pulmonary vein catheter ablation
Variable
Recurrence of AF
(n=15)
No recurrence of AF
(n=53) P-value
Age(years) 67±11 65 11 0.39
Female, n(%) 7(46.7%) 8(41.5%) 0.77
Body mass index(kg/m
2) 25 2.6 24.1 4.4 0.45
Diabetes mellitus, n(%) 2(13.3%) 6(11.3%) 0.85
Hypertension, n(%) 6(40.0%) 33(62.0%) 0.15
Dyslipidemia, n(%) 3(20.0%) 26(49.0%) 0.07
History of stroke, n(%) 2(13.3%) 2(3.8%) 0.21
Smoker, n(%) 7(46.7%) 22(41.5%) 0.77
Triglyceride(mg/dl) 218 31 202 36 0.41
High-density lipoprotein-cholesterol(mg/dl) 50 13 54 15 0.37
Low-density lipoprotein-cholesterol(mg/dl) 135 28 117 30 0.04
High-sensitivity C-reactive protein(mg/dl) 0.12 0.09 0.10 0.12 0.70
N-terminal brain natriuretic peptide(pg/ml) 112 101 62 89 0.07
Creatinine(mg/dl) 0.8 0.2 0.8 0.2 1.00
Echocardiographic findings
Left ventricular ejection fraction(%) 62 8 60 10 0.39 Left atrial diameter(mm) 47 7 42 6 0.005 Medications before catheter ablation, n(%)
Use of ARB 4(26.7%) 20(37.7%) 0.55 Use of ß-blocker 6(40.0%) 27(50.9%) 0.56 Use of calcium channel antagonista 4(26.7%) 20(37.7%) 0.55 Use of sodium channel blocker 2(13.3%) 4(7.5%) 0.61
Use of statinb 1(6.7%) 19(35.8%) 0.05
Values are mean standard deviation, unless otherwise indicated.
aCalcium channel antagonist includes bepridil;
b