t r
1 8MERS, SFTS 8
e
B B8 e S 8
d 8 28 e d
8 B
2 AMR CRE
b 8 8
d 8CRE E
b
1 8MERS, SFTS
8
e
B B8
e B D8
b8 b
2 AMR CRE
b 8
1.
e 8
8
2. E CRE
E CRE 8 B
8 B
1.
8 u A H1N1
pdm098 uH7N98MERS,
SFTS 8
8 b8
e B
8 e e 8 B
B B
28 4
- 11 -
B 8 D
B 8
B be
d S 28 e8
d 8
8 B
2. E CRE
CRE 8 E
B
D8 IMP PCR
B e
D i e 8
B 8
8 8
BS D b8
b c B
8CRE
b 8 8 d 8
E CRE b
1
○
○ (MEPM) 8
(IPM) (CMZ)
2
○
IMP 8NDM 8KPC 8OXA-48 4
○ β- r (ESBL)
TEM 8SHV 8CTX-M-1 group8 CTX-M-2 group8CTX-M-9 group 5
○AmpC β- r
MOX 8CIT 8DHA 8ACC 8EBC 8FOX 6
↓
c 8
SMB 8KHM 8VIM 8GES 8IMI
3 β- r
○r ESBL
○ KPC
○ r tv
AmpC
○ (SMA) β-
r (MBL)
4 MBL
○Carba NP
○Carbapenemase Inactivation Method (CIM )
*2 3,4
B
5 l s (PFGE)
d B i
6 NGSB
- 12 -
S1-PFGE NGS
1 2 CRE
CRE
AMR
1.Doan YH, Haga K, Fujimoto A, Fujii Y, Takai-Todaka R, Oka T, Kimura H, Yoshizumi S, Shigemoto N, Okamoto -Nakagawa R, Shirabe K, Shinomiya H, Sakon N, Katayama K. Genetic analysis of human rotavirus C: The appearance of Indian-Bangladeshi strain in Far East
Asian countries. Infect Genet Evol.
41:160-73. 2016
2. Suzuki Y, Doan YH, Kimura H, Shinomiya H, Shirabe K, Katayama K.
Predicting genotype compositions in norovirus seasons in Japan. Microbiol Immunol. ;60(6):418-26. 2016
3. Okamoto K, Mori Y, Komagome R, Nagano H, Miyoshi M, Okano M, Aoki Y, Ogura A, Hotta C, Ogawa T, Saikusa M, Kodama H, Yasui Y, Minagawa H,
Kurata T, Kanbayashi D, Kase T, Murata S, Shirabe K, Hamasaki M, Kato T, Otsuki N, Sakata M, Komase K, Takeda M. Evaluation of sensitivity of TaqMan RT-PCR for rubella virus detection in clinical specimens. J Clin Virol. ;80:98-101. 2016,
4. Kobayashi M, Matsushima Y, Motoya T, Sakon N, Shigemoto N, Okamoto- Nakagawa R, Nishimura K, Yamashita Y, Kuroda M, Saruki N, Ryo A, Saraya T, Morita Y, Shirabe K, Ishikawa M, Takahashi T, Shinomiya H, Okabe N, Nagasawa K, Suzuki Y, Katayama K, Kimura H. Molecular evolution of the capsid gene in human norovirus genogroup II. Sci Rep. Jul 7;6:29400.
2016
5
D68
. 44(4) 156-159 2016 6
- 13 -
8 846 12 810−1182017,
1. 8 d
n 8
n 8
l v
t 7 25 6 7 011 2-
8 8
a
- 14 -
- 15 -
- 16 -
- 17 -
28
DNA
enterohemorrhagic E. coli: EHEC 2016 3,640
1,250
[hemolytic uremic syndrome: HUS]
NESID
O157 O26, O111, O103, O145, O121, O165
EHEC
EHEC EHEC
[enteropathogenic E. coli: EPEC]
[enteroaggregative E. coli: EAggEC]
Escherichia
albertii PCR
15 1
8 2
19 8
Legionella pneumophila
- 18 -
A
A Group A
Streptococcus Streptococcus pyogenes A
A
A
A A
A
A
EHEC
A A
1.
Staten Serum Institut: SSI
PCR
2. SBT
L. pneumophila EWGLI
(European Working Group of Legionella Infections) SBT (sequence-based
typing) flaA pilE asd mip
mompS proA neuA
(http://www.hpa-bioinformatics.org.uk/legi onella/legionella_sbt/php/sbt_homepage.php)
3. T M
1.1 EHEC
- 19 -
2016
EHEC 2,676
O157 57.8% O26 24.4%
O103 4.5% O111 2.7% O121 1.9%
O145 1.5% O91 1.2% O165 0.3%
5.7%
1.2
EHEC, EPEC, EAggEC, ETEC [enterotoxigenic
E. coli: ], EIEC
[enteoinvasive E. coli:
] EHEC
DNA
1.3 Escherichia albertii
E. albertii PCR
1.4 EQA External
Quality Assurance
Statens
Serum Institut: SSI
EQA
2016 10
EHEC
EQA
, β ,
O:H
SSI 1.5 EHEC
2.
53
Legionella pneumophila SG
1 48 SG2 9 13 1
Legionella longbeachae SG2 Legionella bozemanae SG2 1
2015
2 1 SG1 SG13
1 2
PFGE
PFGE 1
DNA
- 20 -
3 1
3
1 3 1
2016 3 436
452 L. pneumophila 426 97.7%
L. pneumophila 1 85%
L. pneumophila
426
ST1 ST2134 187
STSS 110 emm1
41 (37.3%) emm89
27 (24.5%) emm12 9 (8.2%)
2014 emm1
emm89 16.0% (12/75) 24.5% (27/110)
- 21 -
EQA
1) Ikebe T, Matsumura T, Nihonmatsu H, Ohya H, Okuno R, Mitsui C, Kawahara R, Kameyama M, Sasaki M, Shimada N, Ato M, Ohnishi M. Spontaneous mutations in Streptococcus pyogenes isolates from streptococcal toxic shock syndrome patients play roles in virulence. Sci Rep 6:28761, 2016.
2) Kuroki T, Amemura-Maekawa J, Ohya H, Furukawa I, Suzuki M, Masaoka T, Aikawa K, Hibi K, Morita M, Lee K, Ohnishi M,
- 22 -
Kura F. Outbreak of Legionnaire’s disease caused by Legionella pneumophila serogroups 1 and 13. Emerg Infect Dis. 23 349-351, 2017.
3)
1 Amemura-Maekawa J, Chida K, Ohya H,
Isobe J, Kanatani J, Tanaka S, Nakajima H, Yoshino S, Ohnishi M and Kura F:
Characterization for clinical Legionella species by Legionella Reference Center in Japan. ESGLI 2016. Amsterdam, September 2016.
- 23 -
- 24 -
- 25 -
- 26 -
- 27 -
- 28 -
- 29 -
- 30 -
- 31 -
- 32 -
- 33 -
- 34 -
2016
PCR
( )
QOL
BSL3
1.
PCR
- 35 -
( )
2. Probe
PCR
3.
1. PCR
6
PCR PCR
2. Probe
3.
PCR
R. japonica
R.
heilongjiangensis R.
tamurae R. helvetica
Karp Kato Gilliam Kawasaki Kuroki
Shimokoshi
- 36 -
PCR
PCR
1. Satoh M, Akashi S, Ogawa M, Wakeyama T, Ogawa H, Fukuma A, Taniguchi S, Tani H, Kurosu T, Fukushi S, Shimojima M, Ando S, Saijo M: Retrospective survey of severe fever with thrombocytopenia syndrome in patients with suspected rickettsiosis in Japan. J. Infect.
Chemother., 23: 34-50, 2017 2.
2011 2014
, 67(3): 167-175, 2016
1.
28
2017 2 21 22 2.
update
23 2016 12 3 4
- 37 -
- 38 -
- 39 -
- 40 -
- 41 -
- 42 -
, ,
, , , ,
, , ,
27
- 43 -
- 44 -
- 45 -
- 46 -
- 47 -
- 48 -
- 49 -
Loopamp D
Loopamp
D LAMP
ptxP1
ptxP3 SNP; G>A at −65 position ptxP8 C>T at −60 position
ptxP1 ptxP3 99
2016 11 Loopamp
D LAMP
LAMP
ptxP1 ptxP SNP
ptxP1 ptxP3
ptxP1 ptxP3 ptxP8
ptxP
SNP LAMP
LAMP ptxP3
ptxP8
1. ptxP DNA
ptxP1 ptxP3
ptxP8 PCR 3
ptxP ptxP1, ptxP3, ptxP8
ptxP 341-bp QIAEX II Gel Extraction Kit
ptxP1 n=20 ptxP3 n=20 ptxP8
n=1 1 Wizard
Genomic DNA Purification Kit DNA
2. Loopamp D
RNA (0.1 g/mL) TE ptxP
105 102 DNA
DNA 100 pg 1 pg DNA
DNA Loopamp
- 50 -
D LMP542 LA-320C ptxP
66 40 Tt OD650
0.1 min
1. ptxP
PCR 3 ptxP
ptxP1, ptxP3, ptxP8 102 105
ptxP1 ptxP8 Tt
ptxP3 ptxP1 ptxP8
Tt p < 0.05 103~105
ptxP3 ptxP1 ptxP8
100
2. DNA
ptxP
ptxP1 ptxP8 Tt
ptxP3 ptxP1 Tt p < 0.01 DNA
ptxP3
LAMP
ptxP1 ptxP3 ptxP8
ptxP3 LAMP SNP
ptxP1 ptxP8
LAMP 2~3
SNP
ptxP3 SNP DNA LAMP
ptxP ptxP1 ptxP3
99 LAMP
ptxP1 ptxP3
ptxP
ptxP
Loopamp D
ptxP1 ptxP3
1. Hiramatsu Y, Miyaji Y, Otsuka N, Arakawa Y, Shibayama K, Kamachi K. Significant decrease in pertactin-deficient Bordetella pertussis isolates, Japan. Emrg Infect Dis. in press.
2. Kamachi K, Moriuchi T, Hiramatsu Y, Otsuka N, Shibayama K. Evaluation of a commercial loop-mediated isothermal amplification assay for
- 51 -
diagnosis of Bordetella pertussis infection. J Microbiol Methods.
133:20-22, 2017.
1.
48
11 19-20
2016
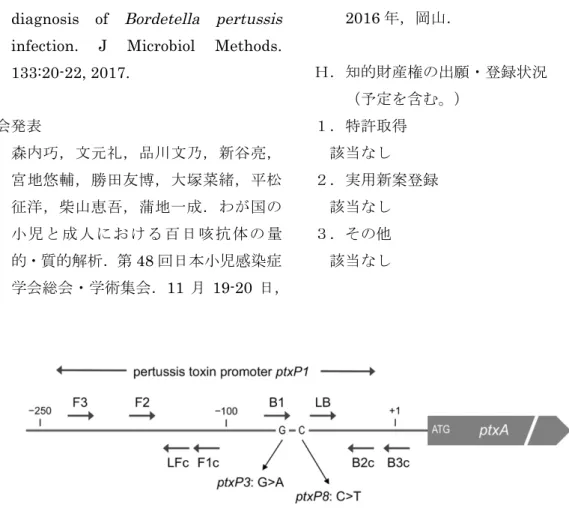
Fig. 1. Schematic representation of the LAMP primers for Bordetella pertussis detection.
The LAMP primers are designed to target the B. pertussis ptxP1 allele. The ptxP3 and ptxP8 alleles contain a SNP at positions -65 (G>A) and -60 (C>T), respectively. The transcription start site is shown at position +1. ptxA, pertussis toxin S1 subunit gene.
Fig. 2. Standard curves for ptxP1, ptxP3, and ptxP8 alleles generated with PCR fragments.
The LAMP assay was performed with 10-fold serial dilutions of PCR fragments (105 to 102 copies per reaction). Data represent the mean and standard deviations from three separate measurements.
- 52 -
Table 1. Detection of Bordetella pertussis ptxP1, ptxP3, and ptxP8 strains by the commercial LAMP assay
Strain No. of clinical strains testeda
Tt value (min)b
100 pg DNAc 1 pg DNA
ptxP1 20 19.3 ± 0.5 21.8 ± 0.5
ptxP3 20 16.9 ± 0.3 19.0 ± 0.4
ptxP8 1 18.5d 21.5d
a Genomic DNA sample prepared from B. pertussis clinical isolate.
b Threshold time when the turbidity value reached OD650 of 0.1.
c Genomic DNA/reaction tube.
d Average Tt values from two separate measurements.
- 53 -
VNTR
VNTR
2014 VNTR External
Quality Assessment: EQA
2016
2014 2015
3
2016 56 55
3 JATA 12
12 48 87%, 48/55
2016 2015 93%, 49/53
2014 67%, 36/54 P=0.01
VNTR Variable Number of Tandem Repeat
VNTR
2014 VNTR 3 JATA 12 -VNTR
66.7%
36/54
2016
2014
2015 3
Quality Assurance: QA
Internal Quality Control: IQC External Quality Assessment: EQA
Training: TA
- 54 -
VNTR
DNA
DNA 3 3
DNA 2
DNA DNA
DNA
VNTR VNTR
PCR
: JATA 12 JATA 15 Supply 15
HV Hypervariable Regions/ : 3232, 3820, 4120
JATA 12
VNTR
PCR VNTR
1.
79
2016
11 2016 12 56
2017 3
1 1 55
55
2. VNTR
VNTR JATA 12
JATA 15 HV Supply[15]
JATA
12 JATA
15 JATA[12] 3 HV
3 Supply 6
2016
JATA 15 HV Supply 41 33 19
2014 2015
1
3. JATA 12
3
JATA 12 12
48 87%,
- 55 -
48/55 1 5 9.1%,
5/55 2 2 3.6%,
2/55 1 2016
2014
67% vs. 87%, p=0. 01 2015
93% vs.87%, p=0.24
2016 2015
1
1.9% vs. 9.1%
4. PCR PCR
QIAxcel QIAGEN
2 2016 2015
66%, 36/55
10 18%, 10/55 5
9%, 5/55 QIAxcel 2 4%, 2/55 Agilent 2100 Bioanalyzer 1 2%, 1/55
5.
PCR
JATA 12 JATA 15 HV Supply 3
1
2016 2014
2015
JATA 12
2016 2015
99.7% [2015] vs. 99.8% [2016]
10
100% [2015] vs. 98.9% [2016]
5
100% [2015] vs. 97.2% [2016]
JATA 15 Supply
99.6%-100%
HV
97.2%
[2015] 97.8% [2016]
100% [2015] vs 98.8% [2016]
1
Agilent 2100 Bioanalyzer QIAxcel
6.
JATA 12 JATA 15
3 2014 5 1955,
3336, 4052, 4156, 2163a 77–96% 2015
99–100%
2016 98-100%
: 5
- 56 -
[2015] vs. 9 [2016]
2016
2014
2015 3
PCR
2016 2014
2015 2
36
10
5 QIAxcel 2 Agilent 2100 Bioanalyzer 1
3 JATA 12
2016 2014
67% vs. 87%, p=0. 01 2015 93% vs.87%,
p=0.24 2016
2015 1
1 vs. 5 1
4
data not shown
VNTR DNA
7 5
VNTR
data not shown
2016 2014
2014 5
2015 2016
2
2015 VNTR DNA 2016
VNTR DNA
VNTR
JATA 15 HV Supply 6
41 33 21 3
2 JATA 12
JATA 12
- 57 -
2014 2015 2016 VNTR
VNTR
VNTR
2016 55 VNTR
3 JATA
12 12
46 87%, 48/55 2016
2015 93%, 49/53
2014 67%, 36/54 VNTR
1.
.
2014-2015 . 92
. 3 23-24 , 2017 , .
- 58 -
2014 施設数 (54施設中, %)
2015 施設数 (53施設中, %)
2016 施設数 (55施設中, %)
全ローサイ完全一致 36 67%(36/54) 49 93%(49/53) 48 87%(48/55)
1ローカス違い 7 13%(7/54) 1 1.9%(1/53) 5 9.1%(5/55)
2カ所以上違い 11 20%(11/54) 3 5.7%(3/53) 2 3.6%(2/55)
1. 3 JATA(12)
施設数 割合(%) 施設数 割合(%) 施設数 割合(%)
アガロースゲル 37 69 34 64 36 66
自動シーケンサー 7 13 10 19 10 18
マルチナ 4 7.4 4 7.5 5 9.1
QIAxcel 4 7.4 3 5.7 2 3.6
コスモアイ 2 3.7 2 3.8 1 1.8
Agilent 2100 Bioanalyzer
1 1.8
2014
2015 20162. PCR
- 59 -
n 正答率(%) n 正答率(%) n 正答率(%) n 正答率(%) アガロースゲル 37 98.5 22 94.4 15 94.8 5 96.7
自動シーケンサー 7 97.6 7 92.1 7 92.1 7 95.2
マルチナ 4 96.5 2 83.3
QIAxcel 4 86.1 4 80.6 4 75 1 94.4
コスモアイ 2 98.6 2 83.3 1 100 1 100
アガロースゲル 34 99.7 22 100 16 97.2 5 100
自動シーケンサー 10 100 9 100 10 100 9 100
マルチナ 4 100 2 100 2 100 1 100
QIAxcel 3 99.1 2 94.4 2 66.7
コスモアイ 2 100 1 100 1 100
アガロースゲル 36 99.8 27 99.6 20 97.8 8 100
自動シーケンサー 10 98.9 9 100 9 98.8 9 100
マルチナ 5 97.8 3 100 2 100 1 100
QIAxcel 2 97.2 1 88.9 1 66.7
コスモアイ 1 100 1 100 1 100 1 100
Agilent 2100 Bioanalyzer 1 100 2014
2015
JATA(12) JATA(15) HV Supply
2016
3.
n:
(%): 1 (%)
- 60 -
28
conventional PCR EQA 24
3 SOP
1,000 23
10pg/µl
7
7 16
PCR
SFTS
ELISA
EQA 7
14 SFTS
7
EQA
1,400
2008 7 4
16srRNA
fopA PCR
- 61 -
7
EQA 17
24 EQA
1.
Yama
3 EQA
SOP
3 No.1 2 3
1 33 1 3 1 15
7 1
96
SOP 3 3
2. conventional PCR 16srRNA fopA
LVS
100pg/µl 3 (
100pg/µl)
SOP EQA
3 No.1 2 3 Francisella novicida U112 Francisella philomiragia 029 Wolbachia sp.
SOP
10 PCR
3
PCR 16srRNA
fopA
SOP
1.
OD560
11 0.94 1.3
24 96
16
320 640
40 80 10
1 No.1
10 1 10 12 20
10 40 1
No.2 80 18 160
6 No.3 20 13
40 11 2
SOP
- 62 -
2. conventional PCR
24 16srRNA
PCR 1pg-1fg/µl
10-2 10-5 fopA
10pg-10fg/µl 10-1 10-4
3 16srRNA
fopA PCR
No.1 +/+ No.2 +/- 24
No.3 23
-/- 1 -/+ 1
No.3 -/+
Fast PCR
SOP 2 PCR
6
Takara ExTaq HS
ExTaq 11 10
PCR 4
SOP
PCR
EQA SOP
No.1 10 40
40 1 96
EQA
80
No.2 4
No.3
PCR 24
1,000
10pg/µl 600 copies/µl
EQA
Francisella
Wolbachia No.3
fopA PCR
PCR
Fast PCR
No.3
16srRNA
fopA PCR +/+
F. tularensis F. novicida +/- F. tularensis F. novicida
- 63 -
Francisella -/- Francisella -/+
EQA PCR
SOP PCR
Francisella
EQA
24
SOP
1.
1.
- 64 -
1
10 1
- 65 -
2 3
No.1 No.2 3 1
- 66 -
3 PCR 16srRNA fopA
PCR 1,000
- 67 -
HIV
HIV
HIV
HIV
NESID
2006
1500 HIV
3 AIDS
HIV
HIV
HIV
AIDS 1000 HIV
500 HIV
HIV
2
1
HIV HIV
HIV
- 68 -
2. HIV
IASR
HIV
HIV
2
HIV HIV
3
2014 10
AIDS
HIV
HIV
1 Nii-Trebi N, Ishikawa K, Matsuoka S, Takeda S, Bonney E.Y, Ofori S.B., Yoshimura K., Ampofo W.K. and Matano T. Analysis of HLA genotypes in HIV-1-infected Ghanaians. ASLM 2016 Conference. December 3-6, 2016. Cape Town, South Africa.
2 Matsuoka S. HI-1 epidemiology in Ghana.
7th KOREA-JAPAN joint symposium on HIV/AIDS. January 14 2017. Soul, South Korea.
3
- 69 -
D B 52
54 2015 2016
79
2015 EKC
54 2
54
1. EKC 2013 2016
EKC
2017 3
EKC
803
2.
24 2012 2
5 3 EKC
3.
19a 64
- 70 -
1. EKC
D 58 B 3 18 E
4 11 13
C
2 5
D EKC
54 24
37 56 8 19 53
1
2.
2017 3
EKC 79
3.
NESID
48 49 55 57
64 19a
(2017 2 9 )
EKC adenovirus
2013 2014 2015 2016
Ade 54 12 10 91 80
Ade 3 18 48 41 37
Ade 37 10 56 34 10
Ade 4 35 23 19 9
Ade 56 19 29 14 11
Ade 8 17 13 8 2
Ade 19 1 4 4 21
Ade 53 3 4 8 6
Other
adeno 23 21 25 37
54
2015
1
2015 2016 2
54 EKC
EKC D 54
6 54 37 56 8
19 53
B 3 E 4 EKC
EKC
54
EKC
19 EKC
19a
EKC 19a
64
- 71 -
NESID 64 64 (19a)
EKC
(53 )
1. Yoshitomi H, Sera N, Gonzalez G, Hanaoka N, Fujimoto T. First isolation of a new type of human virus (genotype 79), species Human mastadenovirus B (B2) from sewage water in Japan. J Med Virol. 2016 Dec 12. doi: 10.1002/jmv.24749.
2. Hai le T, Thach HN, Tuan TA, Nam DH, Dien TM, Sato Y, Kumasaka T, Suzuki T, Hanaoka N, Fujimoto T, Katano H, Hasegawa H, Kawachi S, Nakajima N. Adenovirus Type 7 Pneumonia in Children Who Died from Measles-Associated Pneumonia, Hanoi, Vietnam, 2014. Emerg Infect Dis.;22(4):687-90, 2016.
3.
-2014 - 90(4) 507 511 . 2016 4.
27(1) 69 73 2016
5. 460 11,
2016.
6. 461
11,2016
7. .
462 11, 2016
8. .
87(6) 748 750 2016
1 Hanaoka N. Adenovirus Infection as STI; adenoviral urethritis. 19th IUSTI Asia-Pacific Conference. Dec-2, 2016, Okayama city
2.
(2014 ) 53 7 2 , 2016 , 3.
.
17 7 2
2016 4.
37
7 22 2016
5.
53 54 56
2000 2015
90 4
15 2016
6.
- 72 -
90 4
16 2016
7. Aksara Thongprachum, Tsuguto Fujimoto, Sayaka Takanashi, Shoko Okitsu, Satoshi Hayakawa, Hiroshi Ushijima. A variety of virus commonly causing diarrhea detected in untreated sewage. The 64th annual meeting of the Japanese Society of Virology. October 25th, 2016, Sapporo city.
8.
48
11 19 2016
9. Thongprachum
Aksara
48
11 20 2016
3 29 3 2
- 73 -
Adenovirus 53/22
- 74 -
2 2
28
23 2011 6
22 2010 CRE
27 2015
1. 28 2016 6
2. 28 2016 9
27
-
3 2
- 75 -
27
a.
b.
c.
d. b-
e. Etest
f. CarbaNP test g. JANIS h.
i. Clostridium difficile j.
a. Miseq
b. S1-PFGE
c. 1 2
d.
e. S1-PFGE
3.
1.
81 80
a.
1
80%
57
6 47 /80 59%
b.
2
CRE
- 76 -
VRE
- ESBL
B
c.
38
22 12
d.
, ,
-
1 6
3-4
MALDI-TOF MS 1
8
1 MIC Etest 3.5
-
ESBL - - AmpC
-
PCR -
53(66%) 50(63%)
16S rRNA 26(33%)
PCR 30(38%)
58(73%) 3(4%) 8(10%)
Etest 28(35%)
-
ESBL 44(55%)
- - 44(55%)
AmpC - 40(50%)
KPC 23(29%)
CarbaNP 11(14%)
2
- 77 -
IMP NDM VIM KPC OXA-48 6
ESBL 6
OXA-51 OXA-23
4
e.
6-7
58 73
2. 28
28 2016
20 36
27
( 2 )
30
b-
89 24
/27
52% 14 /27
41% 11 /27
33% 9 /27
30 29
24 83%
8 28
10 34
6 21%
3.
25 2013 60
1
21 27 2015
- 78 -
27 2015 28 2016
64 27
2015 17
28 2016 9
8 8
6
23 2011 6
28 2016
6
1500
CRE 100
VRE CRE
VRE 10
CRE
MRSA
CRE
22
-
KPC
28
28
- 79 -
1
1. .
. 28
. 1 20-22 , 2017 , .
2.
.
. 28
. 1 20-22 , 2017 , .
- 80 -