F E A T U R E
IRON, LIEBIG'S LAW, AND THE GREENHOUSE
" . . . growth of a plant is dependent on the amount of food stuff which is presented to it in minimum quantity."
By John H. Martin
B A R O N JUSTIS VON LIEBIG (1803-1873), the founder o f modern organic chemistry, is also rec- ognized as the father of agricultural chemistry.
He was the first to determine the exact elements taken up by plants from the air and soil, and this enabled him to develop efficient fertilizers. He raised the fundamental operations of agriculture to the level of an exact science (Moulton, 1942).
With this knowledge, Liebig was the first to realize that the " . . . growth of a plant is dependent on the a m o u n t o f food stuff which is presented to it in m i n i m u m quantity." This has become known in ecological circles as Liebig's Law of the Mini- m u m (Odum, 1971).
Liebig's Law and the Ocean
Absence o f fixed N is usually thought to be the factor limiting plant growth in the ocean as ex- emplified by the large oligotrophic gyres where little, if any, nitrate is present. However, in other large ocean areas, such as the G u l f of Alaska, the equatorial Pacific, and the southern ocean, NO3 and other major plant nutrients are readily avail- able (Fig. 1 ). Clearly, factors other than major nu- trient deficiency limit phytoplankton growth in these regions. However, what these factors are re- mains a subject of debate to this day.
Possibly the oldest explanation for the use or non-use o f the major nutrients involves iron abundance. For example, in early Antarctic stud- ies, Hart (1934) noted: " A m o n g t h e . . , chemical constituents of sea water . . . possibly limiting phytoplankton production, iron m a y be men- tioned . . . it m a y help to explain the observed richness of the neritic p l a n k t o n . . , the land being regarded as a source of iron . . ." And in 1942 Hart said that: "Only where these (neritic) influ- ences are felt do the Antarctic seas retain their claim to be amongst the richest in the world."
Little changed in the next half century; i.e., in a recent review EI-Sayed (1988) notes the very high productivity rates in Antarctic nearshore waters and states that such high rates " . . . have no doubt perpetuated the belief in the proverbial richness of the Antarctic waters."
J.H. Martin, Moss Landing Marine Laboratories, Moss Landing, CA, 95039, USA.
Critical evaluation should be easy for Hart's speculation on iron abundance by comparing nearshore versus offshore concentrations. And accordingly, dissolved and particulate iron levels were measured in m a n y studies during the mid- 1900s in various parts of the world's oceans. The general conclusion was that plenty of Fe was available for phytoplankton growth and that this element was not limiting. Similar conclusions were reached from enrichment experiments in which growth rates with and without Fe were compared.
However, during the 1970s, a scientist studying lead at the California Institute of Technology be- gan telling trace-element chemists that their numbers were wrong because they consistently contaminated their samples not only with lead but also with other trace elements. Dr. Clair Pat- terson thus began his successful crusade that led to the adoption o f " c l e a n " techniques by the ocean trace-element c o m m u n i t y . With the hard work of adopting clean techniques came the reward of
"oceanographically consistent" trace-element data. E. Boyle and J. Edmond of M I T (Cambridge, MA), the first to use this term, pointed out that after all, trace-element vertical distributions did not vary randomly but instead had smooth profiles that related well to major hydrographic variables.
Soon the mysteries of various other trace-ele- ment distributions were solved and it was no longer fashionable to cite "exploding fecal pellets"
as the cause for sudden increases in mid-water- column concentrations. Because iron is such a c o m m o n element (fourth most abundant in earth's crust, 5.6%) (Taylor, 1964) and because o f h u m a n ' s extensive use o f iron, contamination problems were and are especially severe. Nev- ertheless, when good iron data finally began to become available, it was quickly determined that Hart was correct; as expected, iron was indeed much more available inshore than offshore not only for California and Alaska but in the Antarctic as well (Martin et al., 1989, 1990).
In view of the high loads of iron-rich sediments near shore, the confirmation of large values for dissolved and particulate iron in coastal waters was expected. What was really surprising was how low the offshore quantities o f Fe turned out to be.
52 OCEANOGRAPHY,Vol, 4, No. 2.1991
"7.
O Z o E
40
30
20
10
!
287-294
0 a I
6 0 S
GEOSECS VERTEX
CTD 1-16
326-347 316-322
40S 20S 0 20N
Latitude
40N 60N
Fig. 1." Surface nitrate concentrations versus latitude in the eastern Pacific (from M a r t i n et al., 1989).
For example, the Fe concentration for offshore Drake Passage surface water is on the order o f 0.16 nmol kg l (Martin et al., 1990). Assuming that the phytoplankton are nitrate users and have an iron requirement of 15 #mol Fe/mol C (Morel et al.. 1991, this issue), this would be enough Fe to produce ~ 10 #mols ofphytoplankton C. Along with the Fe there was 24.8 #mol NO3 kg -l, i.e., assuming the Redfield ratio of 6.6 C: 1 N, enough N to support the production o f 160 #mols of C.
Thus, on the basis of seawater Fe abundance, this means that <10% of the NO3 would be used by the phytoplankton before the depletion o f avail- able Fe and the cessation o f growth.
These observations and those in the G u l f of Alaska (Martin et al., 1989) led us to the disturbing conclusion that open-ocean water is basically in- fertile. Waters, rich in major nutrients, which are mixed upward into the photic zone, have scarcely any Fe, and in order to support maximal utili- zation o f major nutrients, supplemental Fe must be made available from other sources. Miller and other members of the Subarctic Pacific Ecosystem Research (SUPER) group (see Miller et al., 1991, this issue) were quick to point out that relatively high primary productivity rates are regularly measured in the G u l f o f Alaska. They emphasize that one of the highest ever reported was the rate we measured (> 1 g C m -2 day -~) at Ocean Station Papa (Martin et al•, 1989). They have convinced us that there is indeed a small-celled phytoplank- ton c o m m u n i t y that does very well with minute quantities of Fe. Its e c o n o m y is fueled by am- monia, not nitrate, and the population is kept in check by the grazing of microzooplankton.
On the other hand, there are rarer larger dia- toms that we believe are doing poorly because of Fe deficiency. In our experiments, when we add nanomole amounts of Fe, these diatoms bloom and quickly remove the superfluous major nu- trients, including nitrate. We specifically mention NO3 because Fe is required for the synthesis of the enzyme nitrate reductase. We believe that similar situations exist in the other major nutrient- rich waters, such as the equatorial Pacific and southern ocean. This is our variation o f the theme described as the SUPER synthesis (Miller et al•, 1991, this issue) and the ecumenical hypothesis of Morel et al. (1991, this issue).
Atmospheric Input
This leads to a second disturbing conclusion.
For open ocean upwelling regions far removed from Fe-rich continental margins, the only way phytoplankton can obtain Fe is via long-range wind-blown transport and fallout o f Fe-rich at- mospheric dust originally derived from terrestrial arid regions (Duce, 1986; Donaghay et al., 1991, this issue). Biologists trying to understand phy- toplankton production usually think about con- centrations and supply rates of major nutrients, available light levels, and cell removal via zoo- plankton grazing. If our current understanding is correct, biologists must also concern themselves with the amounts o f dust falling out on these sur- face waters. New productivity is not only depen- dent on the nitrate mixing up into surface waters but also on the iron falling out on them.
The recent knowledge gained about oceanic Fe distributions and sources provides very strong in-
•..
the disturbing conclusion that open- ocean water is basically infertile.
OCEANOGRAPHY-Vol. 4, No. 2-1991 53
. . . present-day southern-ocean phytoplankton are not receiving essential iron
• . . and relatively little C02 is being removed from the atmosphere.
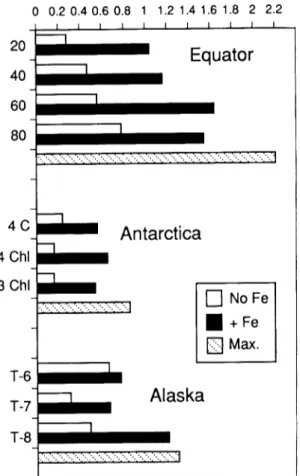
2O 4O 6O 8O
4 C 4 Chl 3 Chl
T-6 T-7 T - 8
doubling d "1
0.2 0.4 0.6 0.8 1 1.2 1.4 1.6 1.8 2 2.2
I I I I I I I I I I I
Equator
I I
..?•.?..?'."':":":"."•.'".i".i ".i"."-."'. "'. "'. ". "'. "'. "'. "'.
"..?..?..?..5.?-.?-.?'.71
Antarctica
..?..?..?..?-.?..?-.?-.?-.?..?..I [ ] N o Fe
• + F e
[ ] M a x .
Alaska
.•..".."..?..?.,:..?..?,.?..:.,:'..?..?..?.,?..?.,?..?1
Fig. 2: Comparisons of the rates at which phyto- plankton double each day with and without added iron. Theoretical maxima fi~r various temperatures are also shown (from Martin et al., 1991).
direct evidence supporting the iron-as-limiting- nutrient hypothesis. Excess nutrients do not occur in Fe-rich coastal waters. For example, normal nutrient depletion occurs as the Alaska continen- tal margin is approached (Martin el al., 1989). As pointed out by Hart (1934) and El-Sayed (1988), among others, m a x i m u m Antarctic phytoplank- ton densities are in Fe-rich neritic waters or along receding ice edges that also represent important Fe sources (Martin et al., 1990). In contrast, at- mospheric dust loads in the Antarctic and equa- torial Pacific are the lowest in the world (Prospero, 1981; Uematsu, 1987; Donaghay et al., 1991, this issue). It is noteworthy that excess nutrients do not occur in the equatorial Atlantic where large amounts of Saharan dust fall out on the sea surface (Prospero, 1981).
Direct evidence that open-ocean phytoplank- ton benefit from atmospheric dust was recently obtained in an equatorial Pacific study. In coop- eration with N. Tindale and R. Duce (University o f Rhode Island), open-ocean aerosol was resus- pended in clean seawater; growth rates in bottles with aliquots of the filtered leachate were two to four times higher than those in the controls with- out Fe (Martin et al., 1991). In general, these re-
suits were similar to those obtained in the G u l f of Alaska and Antarctic (see Fig. 2).
Glacial-Interglacial C02 Change
As mentioned above, present-day atmospheric dust loads in the Antarctic are the lowest in the world (Prospero, 1981). However, this was not always the case. The many dune fields (Sarnthein, 1978) active during the last glacial maximum ( 18,000 years ago) indicate that tropical arid areas were 5 times larger, wind speeds 1.3-1.6 times higher, and atmospheric dust loads 10-20 times greater (Petit et al., 1981). Furthermore, ice-core data (De Angelis et al., 1987) show that large amounts of this dust were reaching the Antarctic;
i.e., about 50 times as much windborne Fe was reaching the Antarctic during the last ice age than is today.
When these data are compared with glacial- interglacial CO2 data (Barnola et al•, 1987), a striking inverse relationship is observed (Fig. 3).
This leads to the hypothesis (Martin, 1990) that southern ocean phytoplankton received essential iron during the glacials from increased atmo- spheric dust input; the phytoplankton bloomed, the "biological p u m p " turned on, and CO2 was withdrawn from the atmosphere. In contrast, present-day southern-ocean phytoplankton are not receiving essential iron, the biological pump is turned off, and relatively little CO2 is being re- moved from the atmosphere.
Iron-Enrichment Experiments
How much Fe would be required to turn on the biological pump? Back-of-the-envelope cal- culations suggest that the number is surprisingly small, on the order of a few hundred thousand tons. This observation indicates that it is at least feasible to think about using iron fertilization to stimulate phytoplankton growth, which might turn on the biological pump and in turn promote the removal of the greenhouse gas CO2 from the
Mean Age of Ice I03y
B P2~ , ; 0 0 0 , ? . . . . 2 .. . . 0
i i ~ i i i i i i,
2 0
3 0 0
CO2
re "/\ ' "'i
~ 25° ... : ,. j.. i ~ , o ~
c
200 " ~ "" o 5
5 10 15 20