In order to clarify the causes of brachycephal- ization, correlations between cranial and postcra- nial measurements were examined by the author using principal component analysis and Kaiser’s normal varimax rotation methods, and it was found that cranial length is strongly associated with the sagittal and transverse diameters of the vertebral bodies, sacral breadths, costal chords, many humeral measurements, pelvic breadths and heights, femoral lengths and thicknesses, and tibial lengths and thicknesses. On the other hand, cranial breadth was shown to have no consistent association with any measurements of the verte- brae, ribs, sternum, scapula, clavicle, humerus, ulna, radius, pelvis, femur, patella, tibia, fibula or foot bones. The details and interpretation of these results are given in Mizoguchi (1994, 1995, 1996, 1997, 1998a, b, 1999, 2000, 2001, 2002, 2003a, b, 2004, 2005a).
The present study on facial measurements is
the correlations between cranial and postcranial measurements, however, inter-character correla- tions within the skull were repeatedly analyzed for various human samples. These analyses pro- vide the following expectations. First, cranial breadth is strongly associated with facial breadth, especially bizygomatic breadth (Kanda and Kurisu, 1968; Kanda, 1968; Howells, 1972;
Brown, 1973; Mizoguchi, 1992a). Second, this association may be caused by the common influ- ence of masticatory muscles upon both facial and neurocranial structures because, for example, Weijs and Hillen (1986) showed that the cross- sectional area of the masseter muscle had signifi- cant correlations with head breadth, bigonial width and mandibular length; and Mizoguchi (1992b) found that individuals with a more worn maxillary first molar had significantly smaller inter-parietal-tuber breadth, smaller basi-breg- matic height, and greater bizygomatic breadth.
Loose Association between Neurocranial Shape and Facial Structure:
Toward the Solution of the Brachycephalization Problem
Yuji Mizoguchi
Department of Anthropology, National Museum of Nature and Science, 3–23–1 Hyakunincho, Shinjuku-ku, Tokyo, 169–0073 Japan
E-mail: [email protected]
Abstract
Correlations between neurocranial and facial measurements were examined as a step toward elucidating the causes of brachycephalization by principal component analysis and Kaiser’s normal varimax rotation methods. The results obtained from 30 male and 20 female modern Japanese show that neither cranial length nor cranial breadth has any consistent associations with facial measurements across sexes, contrary to our expectations. These findings suggest that neuro- cranial shape and facial structure may be only loosely associated, in accordance with the degree of development of masticatory muscles. It is also noteworthy that, when a certain facial measurement is associated with either cranial length or breadth in males, it is almost always cranial breadth, not cranial length. The difference in the way of connecting with other characters between cranial length and breadth, the former of which has been shown to be associated exclusively with certain postcranial measurements, may be one of the reasons why brachycephalization and dolichocephal- ization mutually and irregularly occur in a geographic area.
Key words :
Brachycephalization, Neurocranium, Face, Principal component analysis, Bootstrap
method
rocranium of a person with heavily worn molars tended to be flatter and broader in its anterior-su- perior part and narrower and higher in its posteri- or-inferior part. Finally, however, there is also an opposite expectation: neurocranial form may not be so strongly connected to facial structure, be- cause Droessler (1981) has pointed out that the susceptibility to artificial cranial deformation is contrastive between the cranial vault and the fa- cial skeleton, and Mizoguchi (1991) showed that most facial measurements did not consistently suffer from artificial cranial deformation.
In the present study, these expectations were re-examined by comparing three basic neurocra- nial measurements, cranial length, cranial breadth and basi-bregmatic height, with eighty facial measurements.
Materials and Methods
The data used were the raw measurements of skulls reported by Miyamoto (1924). These are of 30 male and 20 female modern Japanese who lived in the Kinai district. The basic statistics for cranial length, cranial breadth and basi-bregmatic height are presented in Mizoguchi (1994), and those for 90 facial measurements, including the cubic root of mandible weight calculated by the author, are listed in Table 1. This set of facial measurements contains almost all traditional ones.
The measurements of the face were, in prac- tice, divided into ten groups, each of which con- tained a similar kind of measurements, to carry out the following multivariate analyses. This was necessary because of a statistical restriction on sample size given the number of variables. For the seventh data sets [variable No. 80 to 80(3)/
K124 in Table 1] of both sexes, however, the multivariate analyses were not performed be- cause the sample sizes were too small. Further, the angle between id-pg line and alveolar margin [79(1b)] in the tenth data sets [variable No. 79(1) to 79(1a) in Table 1] was excluded from the rele- vant multivariate analyses, again, because of the small sample sizes.
To examine the overall relations between neu- rocranial and facial measurements, principal component analysis (Lawley and Maxwell, 1963;
Okuno et al., 1971, 1976; Takeuchi and Yanai, 1972) was applied to their correlation matrices.
The number of principal components was deter- mined so that the cumulative proportion of the variances of principal components exceeded 80%. The principal components obtained in such a way were then transformed by Kaiser’s normal varimax rotation method (Asano, 1971; Okuno et al., 1971) into different factors because these may reveal other associations behind the mea- surements.
The significance of factor loadings was tested by the bootstrap method (Efron, 1979a, b, 1982;
Diaconis and Efron, 1983; Mizoguchi, 1993). In order to estimate the bootstrap standard deviation of a factor loading, 1,000 bootstrap replications, including the observed sample, were used. The bootstrap standard deviation was estimated by di- rectly counting the cumulative frequency for the standard deviation in the bootstrap distribution.
The reality of a common factor such as those represented by a principal component or rotated factor was further tested, although indirectly, by evaluating the similarity between the factors ob- tained for males and females, i.e. by estimating a Spearman’s rank correlation coefficient, rho (Siegel, 1956), between the variation patterns of factor loadings.
Statistical calculations were executed using the programs written by the author in FORTRAN:
BSFMD for calculating basic statistics, BTPCA for principal component analysis and Kaiser’s normal varimax rotation, and RKCNCT for rank correlation coefficients. The FORTRAN 77 com- piler used is FTN77 for personal computers pro- vided by Salford Software Ltd. To increase effi- ciency in programming and calculation, a GUI for programming, CPad, provided by “kito,” was used.
Results
The direct results of principal component
Table 1. Means and standard deviations for facial measurements in Japanese males and females.1)
Males Females
Variable2)
n Mean SD n Mean SD
40 Facial length 29 100.2 4.0 19 94.4 4.7
42 Lower facial length 30 105.6 5.1 20 100.3 4.3
47 Facial height 30 122.2 7.0 19 115.0 4.7
48 Upper facial height 28 72.9 4.3 19 68.7 3.1
45 Bizygomatic breadth 30 133.4 5.3 20 125.9 3.8
43 Upper facial breadth 30 103.9 3.9 20 99.6 3.2
44 Biorbital breadth 30 97.0 7.4 20 94.3 3.2
44(1) Nasomalar breadth 30 104.7 4.3 20 100.4 3.6
46 Bimaxillary breadth 30 100.0 4.0 20 95.8 3.9
K65 Distance between infraorbital foramina 30 53.8 3.2 20 51.4 4.3
50 Interorbital breadth 30 18.2 1.8 20 17.1 1.7
49 Posterior interorbital breadth 30 23.7 2.5 18 22.3 1.6
49(1) Upper ethmoid bone breadth 30 24.5 1.9 20 22.8 2.6
49(2) Lower ethmoid bone breadth 30 36.6 2.4 20 35.9 2.9
51 Orbital breadth 30 43.3 1.9 20 41.6 1.7
K72 Horizontal breadth of orbital inlet 30 38.0 1.6 18 37.1 1.2
52 Orbital height 30 34.3 2.1 20 34.0 1.7
K73 Vertical height of orbital inlet 30 34.4 1.9 19 34.5 1.8
53 Orbital depth 30 48.4 2.1 20 46.9 2.6
53a Orbital axial length 30 48.4 2.3 20 45.5 2.1
54 Nasal breadth 30 26.3 1.8 20 25.0 1.7
55 Nasal height 30 52.5 2.9 20 48.9 2.5
55(1) Height of piriform aperture 30 31.6 2.0 20 29.1 2.5
56 Nasal bone length 30 25.1 3.2 20 23.2 2.5
57(2) Superior nasal bone width 30 10.2 2.7 20 8.6 2.2
57 Minimum nasal bone width 30 7.1 1.9 20 6.9 1.3
57(1) Maximum nasal bone width 30 17.8 2.1 20 17.5 1.6
59(1) Maximum breadth of posterior choanae 30 30.6 2.1 20 30.0 2.0
59 Height of posterior choana 30 26.5 2.9 20 24.6 1.3
K87 Maximum height of zygomatic bone 30 46.2 2.8 20 43.9 2.6
K88 Height of maxillary process 30 25.5 2.0 20 23.2 2.3
K89 Height of temporal process 30 13.4 2.3 20 11.7 1.9
K90 Superior breadth of zygomatic bone 28 44.2 3.1 20 41.9 2.7
K91 Middle breadth of zygomatic bone 28 26.9 2.2 20 24.6 3.7
K92 Inferior breadth of zygomatic bone 30 31.7 3.0 20 28.1 4.5
60 Maxillo-alveolar length 29 54.1 2.9 19 50.9 2.5
61 Maxillo-alveolar breadth 28 65.9 3.2 18 62.3 2.9
61(2) Anterior maxillo-alveolar breadth 25 42.7 2.3 20 41.1 2.7
K96 Orbit-canine height 27 43.6 3.8 17 40.6 2.7
62 Palatal length (ol-sta) 29 46.3 3.0 20 43.9 2.3
62a Palatal length (ol-posterior nasal spine) 29 51.0 2.7 20 48.0 2.8
63 Palatal breadth 24 41.5 2.7 14 38.8 2.8
63(2) Anterior palatal breadth 27 30.0 2.5 19 28.2 1.7
64 Palatal height 24 12.2 2.5 17 12.1 1.9
64a Anterior palatal height 24 8.8 2.5 18 9.8 2.9
68 Mandibular length 30 73.4 3.8 20 69.3 2.8
65 Bicondylar breadth 30 119.3 6.9 20 115.1 5.2
65(1) Bicoronoid breadth 30 97.7 4.5 20 92.5 3.7
66 Bigonial breadth 30 100.3 5.0 20 91.9 3.9
67 Bimental breadth 30 45.9 2.6 20 45.9 1.7
69 Chin height 28 36.6 3.6 20 33.4 2.1
69(1) Mandibular body height 30 33.7 2.8 20 31.5 2.1
69(3) Mandibular body thickness 30 12.8 1.7 20 12.2 1.0
71 Minimum ramus breadth 30 33.7 2.8 20 31.5 2.3
70 Ramus height 30 61.1 5.0 20 55.4 3.4
analyses (PCAs) and the rotated solutions for craniofacial measurements are shown in Tables 2 to 37. The Spearman’s rank correlation coeffi- cients between males and females for the varia- tion patterns of factor loadings on the principal components (PCs) and/or rotated factors (Facs) are shown in Tables 38 to 46.
Those PCs or Facs which are significantly cor- related both with one or more of the three main neurocranial measurements and with one or more facial measurements are as follows. In the fifth,
eighth and tenth data sets, however, no such PCs or Facs were found.
1) PC I from the first data set of males (Table 2)
This PC is significantly correlated both with the three neurocranial measurements and with fa- cial heights and breadths. The female factor most similar to this male PC I (Table 38) is also PC I (Table 4), but female PC I has no significant cor- relation with any of the three neurocranial mea-
Table 1. (Continued)
Males Females
Variable2)
n Mean SD n Mean SD
71(1) Mandibular notch width 30 36.9 2.5 20 34.9 3.2
70(3) Mandibular notch height 29 15.0 1.8 20 12.8 1.7
39(1) Weight of mandible 30 93.9 12.5 20 81.5 9.2
Cubic root of mandible weight3) 30 4.537 0.199 20 4.329 0.160
80 Length of maxillary dental arch 13 54.8 4.9 6 53.8 1.6
80(1)/K118 Dental arch width (maxilla) 14 67.0 3.5 6 52.8 3.0
80a Length of mandibular dental arch 8 50.9 3.4 6 60.2 2.6
80(1)/K120 Dental arch width (mandible) 13 66.2 4.0 6 60.3 4.9
80(2)/K121 Arch length of postcanine teeth (maxilla) 15 42.9 3.4 7 41.1 1.3 80(2)/K122 Arch length of postcanine teeth (mandible) 12 44.5 1.6 8 45.3 2.9 80(3)/K123 Arch length of molar teeth (maxilla) 16 28.8 2.3 6 27.8 0.8 80(3)/K124 Arch length of molar teeth (mandible) 13 31.5 1.2 8 31.3 1.6
72 Facial profile angle 29 83.2 3.0 19 82.5 2.5
73 Nasal profile angle (n-ns-FH) 30 89.2 2.7 20 87.5 2.9
K147 Nasal profile angle (n-ss-FH) 30 85.1 2.7 20 84.2 2.6
74 Alveolar profile angle (ns-pr-FH) 29 66.9 7.3 20 68.5 5.7
K149 Alveolar profile angle (ss-pr-FH) 29 75.8 6.4 20 72.0 4.9
75 Profile angle of nasal dorsum 29 64.2 5.4 20 64.5 5.5
75(1) Angle of nasal dorsum with nasion-prosthion line 28 19.0 5.8 19 18.2 5.2
74(2) Maxillary incisor inclination 29 83.0 11.6 19 79.5 9.9
76(1) Orbit-canine angle 27 77.1 5.0 18 77.7 4.1
77 Transverse profile angle of upper face 29 145.1 5.2 20 147.5 3.8
76 Zygomatic profile angle 29 116.1 4.5 20 116.7 4.4
K155 Angle between zygomatic bones 30 139.8 7.0 20 134.3 5.6
78 Sagittal inclination of orbital inlet 30 92.2 3.3 20 89.4 3.2
78(1) Coronal inclination of orbital inlet 30 15.6 2.6 20 15.6 1.8
78(2) Horizontal inclination of orbital inlet 30 15.4 2.6 20 13.1 2.1
78(3) Angle between orbital axes 30 40.2 3.2 20 41.8 2.8
K160 Inclination of orbital axis plane to Frankfurt Horizontal 30 1.9 2.6 20 2.9 2.8
79(1) Profile angle of mandible 27 78.3 7.0 19 76.2 6.8
79(1b) Angle between id-pg line and alveolar margin 17 94.2 5.7 9 94.4 6.9
K163 Chin angle 27 80.4 5.8 19 81.1 6.7
79 Mandibular angle 30 123.0 6.4 20 128.7 4.7
79(1a) Symphysial angle 29 72.5 5.6 20 72.2 6.6
1)The estimates of basic statistics listed here were recalculated by the author on the basis of the raw data published by Miyamoto (1924). When measurements are available for both sides, only those on the right side were used.
2)Bare-numbered variables are measurements according to Martin and Saller (1957), and those with the letter ‘K’
preceding the number are according to Kiyono (1929).
3)Cubic roots were calculated by the author.
surements.
2) Fac I from the first data set of males (Table 3)
This factor is significantly correlated with both cranial breadth and facial breadths including bizygomatic breadth, but there are no female PCs or Facs which are significantly similar to this male factor (Table 38).
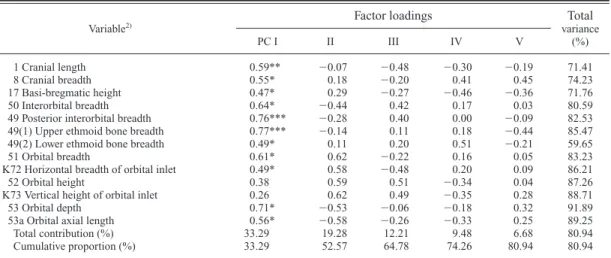
3) PC I from the second data set of males (Table 6)
While this PC is significantly correlated both with the three neurocranial measurements and with many orbital measurements, female Fac III, which is most similar to this male PC I (Table 39), has no significant correlation with any of the measurements analyzed (Table 9).
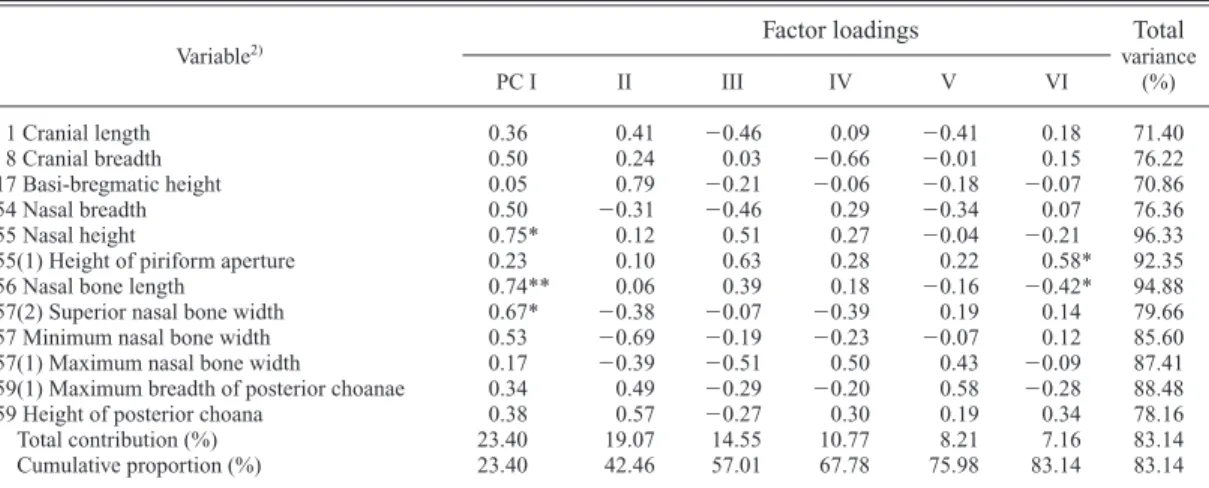
4) Fac V from the third data set of males (Table 11)
This factor is significantly correlated with both cranial breadth and maximum nasal bone width, but female PC II, which is most similar to this male Fac V (Table 40), has no significant correla- tion with any of the measurements analyzed (Table 12).
5) Fac IV from the third data set of females (Table 13)
This factor is significantly correlated with cra- nial length and breadth and also with the maxi- mum breadth of posterior choanae, but male PC III, which is most similar to this female Fac IV (Table 40), has no significant correlation with any of the measurements analyzed (Table 10).
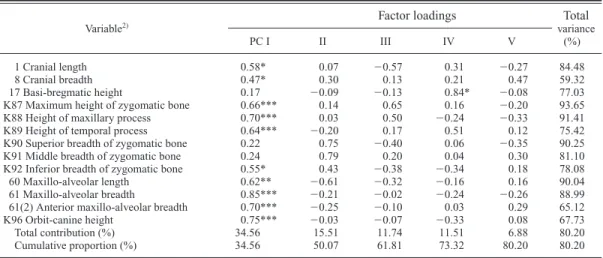
6) PC I from the fourth data set of males (Table 14)
This PC is significantly correlated with cranial length and breadth and with many measurements of the zygomatic bone and maxilla as well, but female PC IV, which is most similar to this male PC I (Table 41), has no significant correlation with any of the measurements analyzed (Table
7) Fac V from the fourth data set of females (Table 17)
This factor is significantly correlated with cra- nial length and the superior breadth of the zygo- matic bone. Although male PC V (Table 14) and Fac II (Table 15) are significantly similar to this female factor (Table 41), they do not have signifi- cant correlations with any of the three main neu- rocranial measurements.
8) PC I from the sixth data set of males (Table 22)
This PC is significantly correlated both with the three main neurocranial measurements and with mandibular ramus measurements, but no fe- male PCs or Facs have significantly similar factor loading variation patterns (Table 43).
9) Fac III from the sixth data set of males (Table 23)
This factor is significantly correlated with basi-bregmatic height and bigonial breadth, but no female PCs or Facs have factor loading varia- tion patterns that are significantly similar to that of this male Fac III (Table 43).
10) Fac VI from the sixth data set of males (Table 23)
This factor is significantly correlated with cra- nial, bicondylar and bicoronoid breadths. Female PC IV (Table 24) is significantly similar to this male factor (Table 43), but does not have signifi- cant correlations with any of the measurements analyzed.
11) Fac III from the sixth data set of females (Table 25)
This factor is significantly correlated with cra- nial length and bigonial breadth, but no male PCs or Facs have significantly similar factor loading variation patterns (Table 43).
12) Fac III from the ninth data set of males (Table 31)
This factor is positively correlated with cranial
Table 2. Principal component analysis of the correlation matrix on the first set of craniofacial measurements from Japanese males.1)
Factor loadings Total
Variable2) variance
PC I II III IV (%)
1 Cranial length 0.62*** 0.06 0.20 0.59 77.35
8 Cranial breadth 0.66** 0.04 0.32 0.42 71.33
17 Basi-bregmatic height 0.44* 0.46 0.13 0.51 67.92
40 Facial length 0.49* 0.53 0.60 0.20 91.24
42 Lower facial length 0.31 0.71 0.56 0.06 92.06
47 Facial height 0.47* 0.61 0.58 0.04 93.51
48 Upper facial height 0.52** 0.50 0.64 0.01 93.30
45 Bizygomatic breadth 0.84*** 0.28 0.09 0.15 80.71
43 Upper facial breadth 0.87*** 0.20 0.02 0.18 83.62
44 Biorbital breadth 0.67* 0.46 0.24 0.20 75.61
44(1) Nasomalar breadth 0.84*** 0.09 0.15 0.13 75.23
46 Bimaxillary breadth 0.87*** 0.04 0.01 0.05 75.76
K65 Distance between infraorbital foramina 0.80*** 0.07 0.27 0.21 76.58
Total contribution (%) 44.94 15.19 13.40 7.57 81.09
Cumulative proportion (%) 44.94 60.12 73.52 81.09 81.09
1)The sample size is 28. The number of principal components shown here was determined so that the cumulative proportion of the variances of the principal components exceeded 80%.
2)See the second footnote to Table 1.
*P0.05; **P0.01; ***P0.001, by a two-tailed bootstrap test.
Table 3. Solution obtained through normal varimax rotation of the first four principal components for the correla- tion matrix on the first set of craniofacial measurements from Japanese males.1)
Factor loadings Variable2)
Fac I II III IV
1 Cranial length 0.25 0.37 0.06 0.76
8 Cranial breadth 0.76** 0.34 0.05 0.12
17 Basi-bregmatic height 0.23 0.19 0.01 0.77
40 Facial length 0.20 0.92 0.05 0.15
42 Lower facial length 0.06 0.94* 0.13 0.09
47 Facial height 0.09 0.14 0.95* 0.01
48 Upper facial height 0.14 0.04 0.95* 0.07
45 Bizygomatic breadth 0.84*** 0.07 0.10 0.29
43 Upper facial breadth 0.84*** 0.06 0.24 0.26
44 Biorbital breadth 0.82*** 0.00 0.17 0.24
44(1) Nasomalar breadth 0.73* 0.04 0.38 0.27
46 Bimaxillary breadth 0.69*** 0.24 0.36 0.30
K65 Distance between infraorbital foramina 0.51* 0.03 0.45 0.55
1)The sample size is 28. The cumulative proportion of the variances of the four principal components is 81.09%.
2)See the second footnote to Table 1.
*P0.05; **P0.01; ***P0.001, by a two-tailed bootstrap test.
Table 4. Principal component analysis of the correlation matrix on the first set of craniofacial measurements from Japanese females.1)
Factor loadings Total
Variable2) variance
PC I II III IV V (%)
1 Cranial length 0.05 0.49 0.38 0.57 0.43 89.10
8 Cranial breadth 0.29 0.58 0.60 0.17 0.20 84.68
17 Basi-bregmatic height 0.36 0.28 0.51 0.60 0.08 83.15
40 Facial length 0.22 0.57 0.51 0.18 0.41 83.20
42 Lower facial length 0.48 0.62 0.36 0.23 0.14 82.48
47 Facial height 0.55 0.58 0.08 0.26 0.27 79.16
48 Upper facial height 0.58* 0.60 0.24 0.34 0.15 89.11
45 Bizygomatic breadth 0.74*** 0.13 0.27 0.25 0.33 80.20
43 Upper facial breadth 0.85*** 0.14 0.24 0.05 0.21 85.41
44 Biorbital breadth 0.84*** 0.21 0.37 0.05 0.18 92.56
44(1) Nasomalar breadth 0.87*** 0.14 0.20 0.02 0.40* 97.50
46 Bimaxillary breadth 0.72*** 0.26 0.14 0.16 0.05 63.66
K65 Distance between infraorbital foramina 0.49 0.45 0.29 0.45 0.41 89.95
Total contribution (%) 35.71 18.69 12.54 9.73 7.96 84.63
Cumulative proportion (%) 35.71 54.40 66.94 76.67 84.63 84.63
1)The sample size is 18. The number of principal components shown here was determined so that the cumulative proportion of the variances of the principal components exceeded 80%.
2)See the second footnote to Table 1.
*P0.05; **P0.01; ***P0.001, by a two-tailed bootstrap test.
Table 5. Solution obtained through normal varimax rotation of the first five principal components for the correla- tion matrix on the first set of craniofacial measurements from Japanese females.1)
Factor loadings Variable2)
Fac I II III IV V
1 Cranial length 0.05 0.10 0.12 0.92* 0.10
8 Cranial breadth 0.00 0.45 0.12 0.79* 0.03
17 Basi-bregmatic height 0.05 0.81 0.14 0.15 0.37
40 Facial length 0.03 0.12 0.90 0.07 0.09
42 Lower facial length 0.45 0.07 0.57 0.13 0.52
47 Facial height 0.15 0.80 0.04 0.09 0.35
48 Upper facial height 0.33 0.76 0.22 0.06 0.38
45 Bizygomatic breadth 0.41 0.21 0.70 0.10 0.29
43 Upper facial breadth 0.90** 0.15 0.13 0.02 0.11
44 Biorbital breadth 0.93** 0.08 0.10 0.14 0.16
44(1) Nasomalar breadth 0.97*** 0.14 0.06 0.07 0.02
46 Bimaxillary breadth 0.58 0.11 0.52* 0.05 0.09
K65 Distance between infraorbital foramina 0.25 0.18 0.08 0.12 0.89***
1)The sample size is 18. The cumulative proportion of the variances of the five principal components is 84.63%.
2)See the second footnote to Table 1.
Table 6. Principal component analysis of the correlation matrix on the second set of craniofacial measurements from Japanese males.1)
Factor loadings Total
Variable2) variance
PC I II III IV V (%)
1 Cranial length 0.59** 0.07 0.48 0.30 0.19 71.41
8 Cranial breadth 0.55* 0.18 0.20 0.41 0.45 74.23
17 Basi-bregmatic height 0.47* 0.29 0.27 0.46 0.36 71.76
50 Interorbital breadth 0.64* 0.44 0.42 0.17 0.03 80.59
49 Posterior interorbital breadth 0.76*** 0.28 0.40 0.00 0.09 82.53 49(1) Upper ethmoid bone breadth 0.77*** 0.14 0.11 0.18 0.44 85.47 49(2) Lower ethmoid bone breadth 0.49* 0.11 0.20 0.51 0.21 59.65
51 Orbital breadth 0.61* 0.62 0.22 0.16 0.05 83.23
K72 Horizontal breadth of orbital inlet 0.49* 0.58 0.48 0.20 0.09 86.21
52 Orbital height 0.38 0.59 0.51 0.34 0.04 87.26
K73 Vertical height of orbital inlet 0.26 0.62 0.49 0.35 0.28 88.71
53 Orbital depth 0.71* 0.53 0.06 0.18 0.32 91.89
53a Orbital axial length 0.56* 0.58 0.26 0.33 0.25 89.25
Total contribution (%) 33.29 19.28 12.21 9.48 6.68 80.94
Cumulative proportion (%) 33.29 52.57 64.78 74.26 80.94 80.94
1)The sample size is 30. The number of principal components shown here was determined so that the cumulative proportion of the variances of the principal components exceeded 80%.
2)See the second footnote to Table 1.
*P0.05; **P0.01; ***P0.001, by a two-tailed bootstrap test.
Table 7. Solution obtained through normal varimax rotation of the first five principal components for the correla- tion matrix on the second set of craniofacial measurements from Japanese males.1)
Factor loadings Variable2)
Fac I II III IV V
1 Cranial length 0.10 0.22 0.10 0.70 0.40
8 Cranial breadth 0.18 0.78** 0.03 0.14 0.29
17 Basi-bregmatic height 0.05 0.12 0.23 0.80* 0.06
50 Interorbital breadth 0.73 0.04 0.09 0.15 0.50*
49 Posterior interorbital breadth 0.74 0.02 0.24 0.10 0.46*
49(1) Upper ethmoid bone breadth 0.82* 0.14 0.02 0.37 0.17
49(2) Lower ethmoid bone breadth 0.68* 0.35 0.02 0.03 0.11
51 Orbital breadth 0.19 0.77 0.30 0.32 0.07
K72 Horizontal breadth of orbital inlet 0.01 0.85 0.08 0.36 0.07
52 Orbital height 0.17 0.10 0.89 0.17 0.08
K73 Vertical height of orbital inlet 0.02 0.15 0.93 0.00 0.02
53 Orbital depth 0.29 0.10 0.01 0.10 0.90***
53a Orbital axial length 0.08 0.00 0.15 0.24 0.90***
1)The sample size is 30. The cumulative proportion of the variances of the five principal components is 80.94%.
2)See the second footnote to Table 1.
*P0.05; **P0.01; ***P0.001, by a two-tailed bootstrap test.
Table 8. Principal component analysis of the correlation matrix on the second set of craniofacial measurements from Japanese females.1)
Factor loadings Total
Variable2) variance
PC I II III IV (%)
1 Cranial length 0.23 0.52 0.63 0.12 73.88
8 Cranial breadth 0.16 0.30 0.89 0.07 91.41
17 Basi-bregmatic height 0.39 0.09 0.45 0.76 93.43
50 Interorbital breadth 0.80*** 0.02 0.21 0.13 69.55
49 Posterior interorbital breadth 0.82*** 0.08 0.17 0.06 71.00 49(1) Upper ethmoid bone breadth 0.84*** 0.29 0.09 0.04 79.24 49(2) Lower ethmoid bone breadth 0.83*** 0.26 0.12 0.25 82.39
51 Orbital breadth 0.76* 0.24 0.26 0.35 82.84
K72 Horizontal breadth of orbital inlet 0.91*** 0.12 0.01 0.26 91.13
52 Orbital height 0.56* 0.64 0.22 0.20 81.74
K73 Vertical height of orbital inlet 0.46 0.78 0.20 0.16 89.21
53 Orbital depth 0.49 0.76 0.03 0.09 82.51
53a Orbital axial length 0.47 0.74 0.25 0.10 84.17
Total contribution (%) 40.89 21.17 13.12 7.32 82.50
Cumulative proportion (%) 40.89 62.06 75.18 82.50 82.50
1)The sample size is 18. The number of principal components shown here was determined so that the cumulative proportion of the variances of the principal components exceeded 80%.
2)See the second footnote to Table 1.
*P0.05; **P0.01; ***P0.001, by a two-tailed bootstrap test.
Table 9. Solution obtained through normal varimax rotation of the first four principal components for the correla- tion matrix on the second set of craniofacial measurements from Japanese females.1)
Factor loadings Variable2)
Fac I II III IV
1 Cranial length 0.21 0.09 0.83 0.08
8 Cranial breadth 0.20 0.00 0.91 0.22
17 Basi-bregmatic height 0.09 0.14 0.17 0.94
50 Interorbital breadth 0.61 0.44 0.26 0.25
49 Posterior interorbital breadth 0.69 0.32 0.26 0.24
49(1) Upper ethmoid bone breadth 0.67 0.58 0.01 0.09
49(2) Lower ethmoid bone breadth 0.78** 0.43 0.20 0.00
51 Orbital breadth 0.89* 0.08 0.12 0.09
K72 Horizontal breadth of orbital inlet 0.93** 0.19 0.08 0.07
52 Orbital height 0.22 0.87 0.01 0.07
K73 Vertical height of orbital inlet 0.12 0.93 0.11 0.02
53 Orbital depth 0.57 0.41 0.38 0.43
53a Orbital axial length 0.57 0.47 0.17 0.52*
1)The sample size is 18. The cumulative proportion of the variances of the four principal components is 82.50%.
2)See the second footnote to Table 1.
Table 10. Principal component analysis of the correlation matrix on the third set of craniofacial measurements from Japanese males.1)
Factor loadings Total
Variable2) variance
PC I II III IV V VI (%)
1 Cranial length 0.36 0.41 0.46 0.09 0.41 0.18 71.40
8 Cranial breadth 0.50 0.24 0.03 0.66 0.01 0.15 76.22
17 Basi-bregmatic height 0.05 0.79 0.21 0.06 0.18 0.07 70.86
54 Nasal breadth 0.50 0.31 0.46 0.29 0.34 0.07 76.36
55 Nasal height 0.75* 0.12 0.51 0.27 0.04 0.21 96.33
55(1) Height of piriform aperture 0.23 0.10 0.63 0.28 0.22 0.58* 92.35
56 Nasal bone length 0.74** 0.06 0.39 0.18 0.16 0.42* 94.88
57(2) Superior nasal bone width 0.67* 0.38 0.07 0.39 0.19 0.14 79.66 57 Minimum nasal bone width 0.53 0.69 0.19 0.23 0.07 0.12 85.60 57(1) Maximum nasal bone width 0.17 0.39 0.51 0.50 0.43 0.09 87.41 59(1) Maximum breadth of posterior choanae 0.34 0.49 0.29 0.20 0.58 0.28 88.48 59 Height of posterior choana 0.38 0.57 0.27 0.30 0.19 0.34 78.16 Total contribution (%) 23.40 19.07 14.55 10.77 8.21 7.16 83.14 Cumulative proportion (%) 23.40 42.46 57.01 67.78 75.98 83.14 83.14
1)The sample size is 30. The number of principal components shown here was determined so that the cumulative proportion of the variances of the principal components exceeded 80%.
2)See the second footnote to Table 1.
*P0.05; **P0.01; ***P0.001, by a two-tailed bootstrap test.
Table 11. Solution obtained through normal varimax rotation of the first six principal components for the correla- tion matrix on the third set of craniofacial measurements from Japanese males.1)
Factor loadings Variable2)
Fac I II III IV V VI
1 Cranial length 0.03 0.83** 0.05 0.06 0.05 0.09
8 Cranial breadth 0.36 0.19 0.09 0.50 0.58* 0.05
17 Basi-bregmatic height 0.35 0.57 0.04 0.38 0.32 0.11
54 Nasal breadth 0.27 0.51 0.20 0.44 0.42 0.16
55 Nasal height 0.07 0.06 0.93* 0.11 0.03 0.29
55(1) Height of piriform aperture 0.09 0.07 0.22 0.01 0.08 0.93**
56 Nasal bone length 0.06 0.06 0.96** 0.15 0.04 0.00
57(2) Superior nasal bone width 0.19 0.03 0.16 0.85*** 0.01 0.08
57 Minimum nasal bone width 0.19 0.03 0.09 0.88*** 0.18 0.11
57(1) Maximum nasal bone width 0.16 0.02 0.05 0.19 0.90*** 0.04 59(1) Maximum breadth of posterior choanae 0.92*** 0.13 0.10 0.03 0.04 0.08
59 Height of posterior choana 0.41 0.64 0.04 0.08 0.15 0.41
1)The sample size is 30. The cumulative proportion of the variances of the six principal components is 83.14%.
2)See the second footnote to Table 1.
*P0.05; **P0.01; **P0.001, by a two-tailed bootstrap test.
Table 12. Principal component analysis of the correlation matrix on the third set of craniofacial measurements from Japanese females.1)
Factor loadings Total
Variable2) variance
PC I II III IV V (%)
1 Cranial length 0.41 0.62 0.18 0.41 0.28 82.86
8 Cranial breadth 0.67 0.32 0.38 0.28 0.05 76.66
17 Basi-bregmatic height 0.49 0.10 0.43 0.22 0.56 79.69
54 Nasal breadth 0.13 0.79 0.10 0.42 0.17 85.25
55 Nasal height 0.68 0.21 0.30 0.31 0.46 90.91
55(1) Height of piriform aperture 0.79 0.09 0.06 0.52 0.00 89.60
56 Nasal bone length 0.20 0.44 0.33 0.36 0.63 85.93
57(2) Superior nasal bone width 0.59 0.02 0.65 0.27 0.02 84.25
57 Minimum nasal bone width 0.51 0.14 0.74 0.21 0.07 87.38
57(1) Maximum nasal bone width 0.17 0.72 0.41 0.29 0.34 92.33
59(1) Maximum breadth of posterior choanae 0.29 0.63 0.25 0.48 0.21 80.76
59 Height of posterior choana 0.72 0.44 0.01 0.10 0.24 77.25
Total contribution (%) 26.88 20.71 14.62 11.74 10.45 84.41
Cumulative proportion (%) 26.88 47.59 62.21 73.95 84.41 84.41
1)The sample size is 20. The number of principal components shown here was determined so that the cumulative proportion of the variances of the principal components exceeded 80%.
2)See the second footnote to Table 1.
*P0.05; **P0.01; ***P0.001, by a two-tailed bootstrap test.
Table 13. Solution obtained through normal varimax rotation of the first five principal components for the corre- lation matrix on the third set of craniofacial measurements from Japanese females.1)
Factor loadings Variable2)
Fac I II III IV V
1 Cranial length 0.12 0.28 0.11 0.84*** 0.16
8 Cranial breadth 0.34 0.13 0.04 0.78** 0.16
17 Basi-bregmatic height 0.33 0.42 0.19 0.20 0.66*
54 Nasal breadth 0.00 0.82 0.33 0.20 0.19
55 Nasal height 0.94* 0.04 0.03 0.10 0.09
55(1) Height of piriform aperture 0.75 0.18 0.23 0.08 0.48
56 Nasal bone length 0.15 0.29 0.23 0.02 0.84
57(2) Superior nasal bone width 0.15 0.01 0.89* 0.17 0.04
57 Minimum nasal bone width 0.10 0.08 0.92* 0.02 0.09
57(1) Maximum nasal bone width 0.11 0.95* 0.12 0.02 0.02
59(1) Maximum breadth of posterior choanae 0.19 0.05 0.02 0.86*** 0.17
59 Height of posterior choana 0.76 0.30 0.31 0.00 0.04
1)The sample size is 20. The cumulative proportion of the variances of the five principal components is 84.41%.
2)See the second footnote to Table 1.
*P0.05; **P0.01; ***P0.001, by a two-tailed bootstrap test.
Table 14. Principal component analysis of the correlation matrix on the fourth set of craniofacial measurements from Japanese males.1)
Factor loadings Total
Variable2) variance
PC I II III IV V (%)
1 Cranial length 0.58* 0.07 0.57 0.31 0.27 84.48
8 Cranial breadth 0.47* 0.30 0.13 0.21 0.47 59.32
17 Basi-bregmatic height 0.17 0.09 0.13 0.84* 0.08 77.03
K87 Maximum height of zygomatic bone 0.66*** 0.14 0.65 0.16 0.20 93.65 K88 Height of maxillary process 0.70*** 0.03 0.50 0.24 0.33 91.41
K89 Height of temporal process 0.64*** 0.20 0.17 0.51 0.12 75.42
K90 Superior breadth of zygomatic bone 0.22 0.75 0.40 0.06 0.35 90.25 K91 Middle breadth of zygomatic bone 0.24 0.79 0.20 0.04 0.30 81.10 K92 Inferior breadth of zygomatic bone 0.55* 0.43 0.38 0.34 0.18 78.08
60 Maxillo-alveolar length 0.62** 0.61 0.32 0.16 0.16 90.04
61 Maxillo-alveolar breadth 0.85*** 0.21 0.02 0.24 0.26 88.99 61(2) Anterior maxillo-alveolar breadth 0.70*** 0.25 0.10 0.03 0.29 65.12
K96 Orbit-canine height 0.75*** 0.03 0.07 0.33 0.08 67.73
Total contribution (%) 34.56 15.51 11.74 11.51 6.88 80.20
Cumulative proportion (%) 34.56 50.07 61.81 73.32 80.20 80.20
1)The sample size is 23. The number of principal components shown here was determined so that the cumulative proportion of the variances of the principal components exceeded 80%.
2)See the second footnote to Table 1.
*P0.05; **P0.01; ***P0.001, by a two-tailed bootstrap test.
Table 15. Solution obtained through normal varimax rotation of the first five principal components for the corre- lation matrix on the fourth set of craniofacial measurements from Japanese males.1)
Factor loadings Variable2)
Fac I II III IV V
1 Cranial length 0.43 0.66 0.04 0.47 0.07
8 Cranial breadth 0.22 0.01 0.12 0.21 0.70
17 Basi-bregmatic height 0.04 0.09 0.04 0.87 0.00
K87 Maximum height of zygomatic bone 0.06 0.04 0.89*** 0.24 0.29
K88 Height of maxillary process 0.26 0.06 0.91*** 0.09 0.07
K89 Height of temporal process 0.38 0.11 0.35 0.65 0.24
K90 Superior breadth of zygomatic bone 0.16 0.91* 0.05 0.01 0.21
K91 Middle breadth of zygomatic bone 0.20 0.29 0.17 0.09 0.81**
K92 Inferior breadth of zygomatic bone 0.47 0.55 0.02 0.27 0.42
60 Maxillo-alveolar length 0.92* 0.09 0.03 0.12 0.18
61 Maxillo-alveolar breadth 0.69* 0.24 0.59 0.03 0.10
61(2) Anterior maxillo-alveolar breadth 0.72 0.03 0.16 0.22 0.23
K96 Orbit-canine height 0.68 0.19 0.36 0.14 0.20
1)The sample size is 23. The cumulative proportion of the variances of the five principal components is 80.20%.
2)See the second footnote to Table 1.
*P0.05; *P0.01; ***P0.001, by a two-tailed bootstrap test.
Table 16. Principal component analysis of the correlation matrix on the fourth set of craniofacial measurements from Japanese females.1)
Factor loadings Total
Variable2) variance
PC I II III IV V (%)
1 Cranial length 0.15 0.53 0.49 0.13 0.61 93.28
8 Cranial breadth 0.02 0.86 0.03 0.23 0.12 81.28
17 Basi-bregmatic height 0.01 0.49 0.40 0.53 0.12 69.84
K87 Maximum height of zygomatic bone 0.08 0.45 0.79 0.21 0.02 87.22
K88 Height of maxillary process 0.70 0.19 0.59 0.11 0.21 92.92
K89 Height of temporal process 0.69 0.14 0.17 0.00 0.39 67.52
K90 Superior breadth of zygomatic bone 0.01 0.53 0.74 0.09 0.10 84.62 K91 Middle breadth of zygomatic bone 0.85 0.33 0.12 0.32 0.00 94.02 K92 Inferior breadth of zygomatic bone 0.77 0.42 0.15 0.39 0.04 94.79
60 Maxillo-alveolar length 0.47 0.43 0.37 0.09 0.02 55.02
61 Maxillo-alveolar breadth 0.63 0.26 0.33 0.50 0.29 90.62
61(2) Anterior maxillo-alveolar breadth 0.67 0.17 0.17 0.51 0.21 80.12
K96 Orbit-canine height 0.33 0.65 0.06 0.09 0.40 70.06
Total contribution (%) 26.71 21.48 17.34 9.17 6.94 81.64
Cumulative proportion (%) 26.71 48.19 65.53 74.70 81.64 81.64
1)The sample size is 16. The number of principal components shown here was determined so that the cumulative proportion of the variances of the principal components exceeded 80%.
2)See the second footnote to Table 1.
*P0.05; **P0.01; ***P0.001, by a two-tailed bootstrap test.
Table 17. Solution obtained through normal varimax rotation of the first five principal components for the corre- lation matrix on the fourth set of craniofacial measurements from Japanese females.1)
Factor loadings Variable2)
Fac I II III IV V
1 Cranial length 0.00 0.05 0.07 0.09 0.96***
8 Cranial breadth 0.21 0.67 0.06 0.10 0.56
17 Basi-bregmatic height 0.07 0.79** 0.23 0.08 0.05
K87 Maximum height of zygomatic bone 0.18 0.55 0.26 0.64* 0.24
K88 Height of maxillary process 0.62 0.17 0.69 0.13 0.15
K89 Height of temporal process 0.64 0.10 0.07 0.47 0.16
K90 Superior breadth of zygomatic bone 0.21 0.16 0.58 0.29 0.59*
K91 Middle breadth of zygomatic bone 0.95 0.05 0.11 0.15 0.09 K92 Inferior breadth of zygomatic bone 0.96 0.04 0.05 0.05 0.17
60 Maxillo-alveolar length 0.17 0.47 0.10 0.54 0.02
61 Maxillo-alveolar breadth 0.10 0.01 0.84** 0.43 0.06
61(2) Anterior maxillo-alveolar breadth 0.24 0.05 0.25 0.82 0.09
K96 Orbit-canine height 0.01 0.70 0.43 0.16 0.06
1)The sample size is 16. The cumulative proportion of the variances of the five principal components is 81.64%.
2)See the second footnote to Table 1.
Table 18. Principal component analysis of the correlation matrix on the fifth set of craniofacial measurements from Japanese males.1)
Factor loadings Total
Variable2) variance
PC I II III IV V (%)
1 Cranial length 0.02 0.29 0.74 0.40 0.34 91.72
8 Cranial breadth 0.20 0.08 0.50 0.26 0.78* 97.19
17 Basi-bregmatic height 0.08 0.57 0.54 0.16 0.04 65.06
62 Palatal length (ol-sta) 0.86* 0.37 0.06 0.29 0.15 98.73
62a Palatal length (ol-posterior nasal spine) 0.81 0.49 0.02 0.02 0.08 90.51
63 Palatal breadth 0.01 0.51 0.28 0.77 0.10 94.10
63(2) Anterior palatal breadth 0.15 0.41 0.74 0.22 0.25 85.46
64 Palatal height 0.73 0.55 0.06 0.23 0.06 90.58
64a Anterior palatal height 0.49 0.63 0.08 0.39 0.06 79.99
Total contribution (%) 24.94 21.42 19.33 13.13 9.32 88.15
Cumulative proportion (%) 24.94 46.36 65.70 78.83 88.15 88.15
1)The sample size is 20. The number of principal components shown here was determined so that the cumulative proportion of the variances of the principal components exceeded 80%.
2)See the second footnote to Table 1.
*P0.05; **P0.01; ***P0.001, by a two-tailed bootstrap test.
Table 19. Solution obtained through normal varimax rotation of the first five principal components for the corre- lation matrix on the fifth set of craniofacial measurements from Japanese males.1)
Factor loadings Variable2)
Fac I II III IV V
1 Cranial length 0.02 0.02 0.95** 0.10 0.08
8 Cranial breadth 0.10 0.02 0.11 0.04 0.97*
17 Basi-bregmatic height 0.41 0.42 0.51 0.10 0.18
62 Palatal length (ol-sta) 0.98* 0.10 0.09 0.06 0.09
62a Palatal length (ol-posterior nasal spine) 0.92 0.11 0.12 0.17 0.06
63 Palatal breadth 0.04 0.01 0.20 0.95 0.04
63(2) Anterior palatal breadth 0.07 0.27 0.53 0.70* 0.02
64 Palatal height 0.25 0.91* 0.07 0.09 0.11
64a Anterior palatal height 0.00 0.88 0.02 0.06 0.13
1)The sample size is 20. The cumulative proportion of the variances of the five principal components is 88.15%.
2)See the second footnote to Table 1.
*P0.05; **P0.01; ***P0.001, by a two-tailed bootstrap test.
Table 20. Principal component analysis of the correlation matrix on the fifth set of craniofacial measurements from Japanese females.1)
Factor loadings Total
Variable2) variance
PC I II III IV (%)
1 Cranial length 0.37 0.19 0.83 0.14 88.17
8 Cranial breadth 0.73 0.15 0.58 0.08 90.12
17 Basi-bregmatic height 0.56 0.54 0.19 0.30 72.94
62 Palatal length (ol-sta) 0.78 0.39 0.30 0.19 88.79
62a Palatal length (ol-posterior nasal spine) 0.89* 0.35 0.10 0.12 94.50
63 Palatal breadth 0.22 0.75 0.36 0.24 80.62
63(2) Anterior palatal breadth 0.56 0.62 0.24 0.30 84.88
64 Palatal height 0.40 0.74 0.15 0.26 79.83
64a Anterior palatal height 0.11 0.20 0.30 0.88** 91.67
Total contribution (%) 32.59 24.20 16.14 12.79 85.73
Cumulative proportion (%) 32.59 56.79 72.93 85.73 85.73
1)The sample size is 14. The number of principal components shown here was determined so that the cumulative proportion of the variances of the principal components exceeded 80%.
2)See the second footnote to Table 1.
*P0.05; **P0.01; ***P0.001, by a two-tailed bootstrap test.
Table 21. Solution obtained through normal varimax rotation of the first four principal components for the corre- lation matrix on the fifth set of craniofacial measurements from Japanese females.1)
Factor loadings Variable2)
Fac I II III IV
1 Cranial length 0.07 0.02 0.94 0.01
8 Cranial breadth 0.32 0.20 0.87 0.01
17 Basi-bregmatic height 0.22 0.81 0.15 0.09
62 Palatal length (ol-sta) 0.93 0.14 0.01 0.11
62a Palatal length (ol-posterior nasal spine) 0.93 0.14 0.24 0.08
63 Palatal breadth 0.10 0.89 0.10 0.02
63(2) Anterior palatal breadth 0.83 0.28 0.01 0.28
64 Palatal height 0.05 0.74 0.23 0.45
64a Anterior palatal height 0.02 0.06 0.03 0.95*
1)The sample size is 14. The cumulative proportion of the variances of the four principal components is 85.73%.
2)See the second footnote to Table 1.
*P0.05; **P0.01; ***P0.001, by a two-tailed bootstrap test.
Table 22. Principal component analysis of the correlation matrix on the sixth set of craniofacial measurements from Japanese males.1)
Factor loadings Total
Variable2) variance
PC I II III IV V VI VII (%)
1 Cranial length 0.59** 0.32 0.05 0.29 0.20 0.24 0.07 64.03
8 Cranial breadth 0.51* 0.05 0.28 0.04 0.20 0.65 0.27 88.34
17 Basi-bregmatic height 0.49* 0.14 0.40 0.28 0.25 0.31 0.05 65.94 68 Mandibular length 0.52 0.61 0.32 0.32 0.04 0.18 0.22 93.44 65 Bicondylar breadth 0.56* 0.01 0.03 0.06 0.64 0.13 0.41 90.45 65(1) Bicoronoid breadth 0.65** 0.30 0.40 0.37 0.00 0.17 0.23 89.05
66 Bigonial breadth 0.27 0.26 0.73 0.34 0.06 0.10 0.19 84.97
67 Bimental breadth 0.35 0.30 0.23 0.40 0.50 0.31 0.07 78.56
69 Chin height 0.42 0.57 0.31 0.10 0.37 0.11 0.27 81.97
69(1) Mandibular body height 0.43 0.56 0.53 0.11 0.07 0.25 0.07 85.89 69(3) Mandibular body thickness 0.39 0.30 0.06 0.63 0.15 0.22 0.43 89.74 71 Minimum ramus breadth 0.60* 0.62 0.03 0.18 0.15 0.19 0.14 85.82
70 Ramus height 0.64*** 0.13 0.14 0.52* 0.09 0.05 0.14 74.44
70(1) Coronoid height 0.84*** 0.06 0.07 0.18 0.22 0.02 0.33 90.69 71(1) Mandibular notch width 0.19 0.57 0.15 0.53 0.06 0.17 0.12 71.07 70(3) Mandibular notch height 0.14 0.27 0.45 0.23 0.51 0.48 0.06 84.02 Cubic root of mandible weight 0.67** 0.15 0.36 0.13 0.22 0.05 0.24 73.54 Total contribution (%) 26.81 13.52 10.89 10.53 7.95 7.04 5.12 81.88 Cumulative proportion (%) 26.81 40.34 51.23 61.76 69.72 76.76 81.88 81.88
1)The sample size is 27. The number of principal components shown here was determined so that the cumulative proportion of the variances of the principal components exceeded 80%.
2)See the second footnote to Table 1.
Table 24. Principal component analysis of the correlation matrix on the sixth set of craniofacial measurements from Japanese females.1)
Factor loadings Total
Variable2) variance
PC I II III IV V VI VII (%)
1 Cranial length 0.03 0.27 0.73 0.44 0.02 0.22 0.10 85.93
8 Cranial breadth 0.02 0.14 0.65 0.47 0.45 0.15 0.05 89.23
17 Basi-bregmatic height 0.10 0.63 0.01 0.26 0.56 0.08 0.11 80.69
68 Mandibular length 0.48 0.20 0.01 0.25 0.45 0.61 0.10 91.40
65 Bicondylar breadth 0.44 0.17 0.48 0.36 0.34 0.11 0.07 71.61
65(1) Bicoronoid breadth 0.31 0.81 0.11 0.27 0.00 0.03 0.06 84.45
66 Bigonial breadth 0.11 0.62 0.44 0.27 0.30 0.33 0.13 88.69
67 Bimental breadth 0.02 0.06 0.72 0.48 0.08 0.24 0.26 88.62
69 Chin height 0.29 0.62 0.47 0.22 0.04 0.01 0.29 81.81
69(1) Mandibular body height 0.05 0.54 0.61 0.20 0.36 0.04 0.30 92.24 69(3) Mandibular body thickness 0.05 0.37 0.13 0.43 0.30 0.65 0.14 87.34 71 Minimum ramus breadth 0.81* 0.17 0.21 0.11 0.09 0.13 0.35 88.75
70 Ramus height 0.72 0.23 0.14 0.34 0.23 0.15 0.14 79.90
70(1) Coronoid height 0.85* 0.07 0.08 0.18 0.00 0.16 0.14 80.74
71(1) Mandibular notch width 0.72* 0.14 0.09 0.38 0.23 0.14 0.28 83.70 70(3) Mandibular notch height 0.62 0.39 0.14 0.01 0.10 0.04 0.58* 91.97 Cubic root of mandible weight 0.51 0.29 0.23 0.39 0.48 0.13 0.01 79.32 Total contribution (%) 21.68 16.30 15.74 10.43 8.89 6.75 5.30 85.08 Cumulative proportion (%) 21.68 37.98 53.72 64.15 73.04 79.78 85.08 85.08
1)The sample size is 20. The number of principal components shown here was determined so that the cumulative proportion of the variances of the principal components exceeded 80%.
2)See the second footnote to Table 1.
*P0.05; **P0.01; ***P0.001, by a two-tailed bootstrap test.
Table 23. Solution obtained through normal varimax rotation of the first seven principal components for the cor- relation matrix on the sixth set of craniofacial measurements from Japanese males.1)
Factor loadings Variable2)
Fac I II III IV V VI VII
1 Cranial length 0.16 0.57 0.35 0.26 0.27 0.03 0.18
8 Cranial breadth 0.05 0.07 0.15 0.37 0.06 0.83*** 0.14
17 Basi-bregmatic height 0.24 0.20 0.73** 0.03 0.08 0.12 0.05
68 Mandibular length 0.03 0.90 0.28 0.04 0.14 0.14 0.01
65 Bicondylar breadth 0.03 0.19 0.08 0.34 0.58 0.58* 0.25
65(1) Bicoronoid breadth 0.20 0.16 0.30 0.24 0.09 0.72** 0.38
66 Bigonial breadth 0.12 0.19 0.86*** 0.12 0.11 0.14 0.04
67 Bimental breadth 0.09 0.67** 0.30 0.04 0.40 0.09 0.28
69 Chin height 0.86** 0.03 0.15 0.11 0.09 0.15 0.07
69(1) Mandibular body height 0.83 0.01 0.01 0.03 0.39* 0.10 0.09 69(3) Mandibular body thickness 0.13 0.06 0.06 0.00 0.10 0.16 0.92***
71 Minimum ramus breadth 0.25 0.82 0.04 0.02 0.33 0.05 0.12
70 Ramus height 0.24 0.06 0.33 0.24 0.71*** 0.08 0.07
70(1) Coronoid height 0.03 0.36 0.25 0.11 0.62* 0.25 0.50
71(1) Mandibular notch width 0.42 0.22 0.27 0.49 0.24 0.01 0.34 70(3) Mandibular notch height 0.12 0.08 0.19 0.88*** 0.06 0.06 0.01 Cubic root of mandible weight 0.27 0.17 0.01 0.09 0.76*** 0.05 0.22
1)The sample size is 27. The cumulative proportion of the variances of the seven principal components is 81.88%.
2)See the second footnote to Table 1.
*P0.05; **P0.01; ***P0.001, by a two-tailed bootstrap test.
Table 25. Solution obtained through normal varimax rotation of the first seven principal components for the cor- relation matrix on the sixth set of craniofacial measurements from Japanese females.1)
Factor loadings Variable2)
Fac I II III IV V VI VII
1 Cranial length 0.01 0.00 0.84* 0.18 0.23 0.19 0.19
8 Cranial breadth 0.04 0.50 0.71 0.19 0.17 0.23 0.13
17 Basi-bregmatic height 0.01 0.85 0.09 0.13 0.08 0.21 0.12
68 Mandibular length 0.15 0.04 0.06 0.05 0.92*** 0.17 0.09
65 Bicondylar breadth 0.18 0.25 0.07 0.57* 0.02 0.04 0.54
65(1) Bicoronoid breadth 0.29 0.80 0.29 0.09 0.18 0.03 0.05
66 Bigonial breadth 0.01 0.33 0.87* 0.10 0.04 0.12 0.01
67 Bimental breadth 0.21 0.15 0.25 0.78*** 0.39 0.00 0.00
69 Chin height 0.10 0.61 0.06 0.55 0.00 0.08 0.35
69(1) Mandibular body height 0.06 0.20 0.01 0.89*** 0.27 0.02 0.11 69(3) Mandibular body thickness 0.09 0.18 0.13 0.09 0.09 0.89 0.09
71 Minimum ramus breadth 0.85 0.04 0.01 0.08 0.32 0.20 0.14
70 Ramus height 0.78 0.29 0.18 0.04 0.02 0.25 0.13
70(1) Coronoid height 0.52 0.19 0.09 0.20 0.23 0.22 0.60*
71(1) Mandibular notch width 0.89 0.04 0.09 0.04 0.03 0.08 0.15 70(3) Mandibular notch height 0.23 0.08 0.13 0.11 0.13 0.16 0.89***
Cubic root of mandible weight 0.21 0.10 0.04 0.19 0.62* 0.48 0.32
1)The sample size is 20. The cumulative proportion of the variances of the seven principal components is 85.08%.
2)See the second footnote to Table 1.
*P0.05; **P0.01; ***P0.001, by a two-tailed bootstrap test.
Table 26. Principal component analysis of the correlation matrix on the eighth set of craniofacial measurements from Japanese males.1)
Factor loadings Total
Variable2) variance
PC I II III IV (%)
1 Cranial length 0.03 0.22 0.71 0.46 76.20
8 Cranial breadth 0.31 0.48 0.25 0.25 45.30
17 Basi-bregmatic height 0.24 0.43 0.48 0.38 61.58
72 Facial profile angle 0.96*** 0.06 0.13 0.05 94.60
73 Nasal profile angle (n-ns-FH) 0.72* 0.46 0.28 0.29 88.92
K147 Nasal profile angle (n-ss-FH) 0.90** 0.31 0.17 0.01 92.69
74 Alveolar profile angle (ns-pr-FH) 0.65* 0.50 0.08 0.40 83.41
K149 Alveolar profile angle (ss-pr-FH) 0.64* 0.57 0.19 0.00 76.60
75 Profile angle of nasal dorsum 0.25 0.79 0.17 0.51 98.66
75(1) Angle of nasal dorsum with nasion-prosthion line 0.26 0.80 0.23 0.47 97.82
74(2) Maxillary incisor inclination 0.34 0.32 0.74 0.20 81.54
Total contribution (%) 31.55 24.74 14.42 10.86 81.57
Cumulative proportion (%) 31.55 56.29 70.71 81.57 81.57
1)The sample size is 28. The number of principal components shown here was determined so that the cumulative proportion of the variances of the principal components exceeded 80%.
2)See the second footnote to Table 1.
Table 27. Solution obtained through normal varimax rotation of the first four principal components for the corre- lation matrix on the eighth set of craniofacial measurements from Japanese males.1)
Factor loadings Variable2)
Fac I II III IV
1 Cranial length 0.04 0.00 0.87 0.01
8 Cranial breadth 0.62 0.23 0.09 0.09
17 Basi-bregmatic height 0.27 0.02 0.72 0.15
72 Facial profile angle 0.72 0.65 0.07 0.06
73 Nasal profile angle (n-ns-FH) 0.93 0.03 0.12 0.04
K147 Nasal profile angle (n-ss-FH) 0.87 0.39 0.01 0.16
74 Alveolar profile angle (ns-pr-FH) 0.11 0.87 0.25 0.07
K149 Alveolar profile angle (ss-pr-FH) 0.14 0.78 0.05 0.37
75 Profile angle of nasal dorsum 0.33 0.04 0.08 0.93***
75(1) Angle of nasal dorsum with nasion-prosthion line 0.06 0.30 0.11 0.93***
74(2) Maxillary incisor inclination 0.26 0.76 0.41 0.08
1)The sample size is 28. The cumulative proportion of the variances of the four principal components is 81.57%.
2)See the second footnote to Table 1.
*P0.05; **P0.01; ***P0.001, by a two-tailed bootstrap test.
Table 28. Principal component analysis of the correlation matrix on the eighth set of craniofacial measurements from Japanese females.1)
Factor loadings Total
Variable2) variance
PC I II III IV (%)
1 Cranial length 0.13 0.13 0.59 0.71 88.58
8 Cranial breadth 0.44 0.35 0.70 0.31 89.87
17 Basi-bregmatic height 0.27 0.19 0.51 0.29 45.15
72 Facial profile angle 0.30 0.92* 0.02 0.11 94.28
73 Nasal profile angle (n-ns-FH) 0.76 0.56 0.03 0.19 92.11
K147 Nasal profile angle (n-ss-FH) 0.63 0.59 0.20 0.25 85.28
74 Alveolar profile angle (ns-pr-FH) 0.47 0.81 0.19 0.13 91.92
K149 Alveolar profile angle (ss-pr-FH) 0.47 0.79 0.13 0.08 86.37
75 Profile angle of nasal dorsum 0.84 0.21 0.38 0.28 97.44
75(1) Angle of nasal dorsum with nasion-prosthion line 0.77 0.22 0.43 0.36 96.18
74(2) Maxillary incisor inclination 0.44 0.32 0.40 0.52 72.83
Total contribution (%) 29.79 28.55 15.25 11.86 85.46
Cumulative proportion (%) 29.79 58.34 73.59 85.46 85.46
1)The sample size is 19. The number of principal components shown here was determined so that the cumulative proportion of the variances of the principal components exceeded 80%.
2)See the second footnote to Table 1.
*P0.05; **P0.01; ***P0.001, by a two-tailed bootstrap test.
Table 29. Solution obtained through normal varimax rotation of the first four principal components for the corre- lation matrix on the eighth set of craniofacial measurements from Japanese females.1)
Factor loadings Variable2)
Fac I II III IV
1 Cranial length 0.06 0.07 0.07 0.93*
8 Cranial breadth 0.06 0.22 0.54 0.75
17 Basi-bregmatic height 0.07 0.04 0.65 0.15
72 Facial profile angle 0.92 0.26 0.18 0.00
73 Nasal profile angle (n-ns-FH) 0.92 0.23 0.13 0.02
K147 Nasal profile angle (n-ss-FH) 0.89 0.00 0.25 0.06
74 Alveolar profile angle (ns-pr-FH) 0.33 0.76 0.45* 0.15
K149 Alveolar profile angle (ss-pr-FH) 0.32 0.74 0.45 0.07
75 Profile angle of nasal dorsum 0.61 0.74 0.19 0.11
75(1) Angle of nasal dorsum with nasion-prosthion line 0.23 0.94* 0.11 0.13
74(2) Maxillary incisor inclination 0.10 0.14 0.83* 0.07
1)The sample size is 19. The cumulative proportion of the variances of the four principal components is 85.46%.
2)See the second footnote to Table 1.
*P0.05; **P0.01; ***P0.001, by a two-tailed bootstrap test.
Table 30. Principal component analysis of the correlation matrix on the ninth set of craniofacial measurements from Japanese males.1)
Factor loadings Total
Variable2) variance
PC I II III IV V VI (%)
1 Cranial length 0.02 0.77 0.39 0.06 0.14 0.25 83.42
8 Cranial breadth 0.16 0.01 0.61 0.45 0.13 0.28 69.62
17 Basi-bregmatic height 0.02 0.41 0.12 0.09 0.72 0.49 94.42
76(1) Orbit-canine angle 0.58 0.41 0.11 0.46 0.11 0.29 82.70
77 Transverse profile angle of upper face 0.69 0.46 0.12 0.11 0.14 0.05 72.55 76 Zygomatic profile angle 0.33 0.60 0.23 0.29 0.20 0.40 80.65 K155 Angle between zygomatic bones 0.56 0.29 0.14 0.68 0.01 0.01 88.83 78 Sagittal inclination of orbital inlet 0.32 0.20 0.72 0.05 0.00 0.24 72.50 78(1) Coronal inclination of orbital inlet 0.87 0.05 0.08 0.29 0.00 0.01 85.03 78(2) Horizontal inclination of orbital inlet 0.42 0.17 0.43 0.15 0.59 0.18 79.40 78(3) Angle between orbital axes 0.44 0.57 0.08 0.45 0.24 0.22 83.60 K160 Inclination of orbital axis plane to FH 0.15 0.20 0.70 0.01 0.25 0.44 81.51 Total contribution (%) 21.00 16.93 15.36 10.82 9.12 7.94 81.19 Cumulative proportion (%) 21.00 37.94 53.30 64.12 73.24 81.19 81.19
1)The sample size is 26. The number of principal components shown here was determined so that the cumulative proportion of the variances of the principal components exceeded 80%.
2)See the second footnote to Table 1.
*P0.05; **P0.01; ***P0.001, by a two-tailed bootstrap test.
Table 31. Solution obtained through normal varimax rotation of the first six principal components for the correla- tion matrix on the ninth set of craniofacial measurements from Japanese males.1)
Factor loadings Variable2)
Fac I II III IV V VI
1 Cranial length 0.08 0.26 0.01 0.50 0.58 0.41
8 Cranial breadth 0.12 0.17 0.78*** 0.22 0.05 0.06
17 Basi-bregmatic height 0.03 0.07 0.02 0.02 0.08 0.97***
76(1) Orbit-canine angle 0.10 0.85* 0.02 0.18 0.26 0.03
77 Transverse profile angle of upper face 0.54 0.04 0.01 0.63*** 0.07 0.15
76 Zygomatic profile angle 0.11 0.86* 0.13 0.16 0.10 0.07
K155 Angle between zygomatic bones 0.91* 0.06 0.03 0.22 0.04 0.10 78 Sagittal inclination of orbital inlet 0.06 0.12 0.41 0.40 0.59** 0.16 78(1) Coronal inclination of orbital inlet 0.82 0.19 0.07 0.33 0.16 0.05 78(2) Horizontal inclination of orbital inlet 0.13 0.10 0.03 0.02 0.85** 0.20 78(3) Angle between orbital axes 0.06 0.02 0.06 0.90*** 0.10 0.03 K160 Inclination of orbital axis plane to FH 0.21 0.06 0.87*** 0.12 0.02 0.05
1)The sample size is 26. The cumulative proportion of the variances of the six principal components is 81.19%.
2)See the second footnote to Table 1.
*P0.05; **P0.01; ***P0.001, by a two-tailed bootstrap test.
Table 33. Solution obtained through normal varimax rotation of the first six principal components for the correla- tion matrix on the ninth set of craniofacial measurements from Japanese females.1)
Factor loadings Variable2)
Fac I II III IV V VI
1 Cranial length 0.02 0.52 0.01 0.78* 0.03 0.24
8 Cranial breadth 0.26 0.54 0.13 0.19 0.49 0.49
17 Basi-bregmatic height 0.02 0.09 0.19 0.06 0.91** 0.14
76(1) Orbit-canine angle 0.02 0.24 0.10 0.91 0.08 0.21
77 Transverse profile angle of upper face 0.22 0.17 0.80 0.17 0.07 0.12
76 Zygomatic profile angle 0.73 0.10 0.37 0.01 0.13 0.23
K155 Angle between zygomatic bones 0.84* 0.26 0.06 0.07 0.14 0.16 78 Sagittal inclination of orbital inlet 0.25 0.05 0.08 0.08 0.13 0.91***
78(1) Coronal inclination of orbital inlet 0.06 0.90 0.12 0.02 0.03 0.08 78(2) Horizontal inclination of orbital inlet 0.00 0.04 0.88 0.00 0.12 0.02 78(3) Angle between orbital axes 0.18 0.87* 0.03 0.02 0.19 0.15 K160 Inclination of orbital axis plane to FH 0.48 0.13 0.58* 0.15 0.51 0.04
1)The sample size is 18. The cumulative proportion of the variances of the six principal components is 85.82%.
2)See the second footnote to Table 1.
*P0.05; **P0.01; ***P0.001, by a two-tailed bootstrap test.
Table 32. Principal component analysis of the correlation matrix on the ninth set of craniofacial measurements from Japanese females.1)
Factor loadings Total
Variable2) variance
PC I II III IV V VI (%)
1 Cranial length 0.57 0.16 0.58 0.45 0.20 0.10 93.90
8 Cranial breadth 0.86 0.24 0.10 0.02 0.28 0.06 89.13
17 Basi-bregmatic height 0.26 0.30 0.47 0.04 0.68 0.25 90.37
76(1) Orbit-canine angle 0.16 0.08 0.51 0.79 0.04 0.18 95.05
77 Transverse profile angle of upper face 0.23 0.60 0.57 0.11 0.01 0.16 76.87 76 Zygomatic profile angle 0.38 0.02 0.47 0.36 0.50 0.04 74.57 K155 Angle between zygomatic bones 0.71 0.23 0.13 0.14 0.42 0.24 82.94 78 Sagittal inclination of orbital inlet 0.50 0.46 0.26 0.05 0.02 0.63* 92.58 78(1) Coronal inclination of orbital inlet 0.63 0.47 0.27 0.35 0.15 0.00 83.54 78(2) Horizontal inclination of orbital inlet 0.06 0.56 0.57 0.32 0.21 0.01 79.39 78(3) Angle between orbital axes 0.57 0.49 0.35 0.32 0.20 0.17 85.31 K160 Inclination of orbital axis plane to FH 0.23 0.77 0.07 0.16 0.08 0.42 86.22 Total contribution (%) 24.05 18.08 16.54 11.17 9.38 6.60 85.82 Cumulative proportion (%) 24.05 42.14 58.67 69.84 79.22 85.82 85.82
1)The sample size is 18. The number of principal components shown here was determined so that the cumulative proportion of the variances of the principal components exceeded 80%.
2)See the second footnote to Table 1.
*P0.05; **P0.01; ***P0.001, by a two-tailed bootstrap test.
Table 34. Principal component analysis of the correlation matrix on the tenth set of craniofacial measurements from Japanese males.1)
Factor loadings Total
Variable2) variance
PC I II III IV (%)
1 Cranial length 0.58 0.33 0.36 0.54 86.57
8 Cranial breadth 0.59 0.03 0.54 0.07 65.43
17 Basi-bregmatic height 0.39 0.47 0.49 0.58 94.72
79(1) Profile angle of mandible 0.13 0.80 0.49 0.01 89.67
K163 Chin angle 0.84* 0.16 0.40 0.12 90.75
79 Mandibular angle 0.75 0.36 0.36 0.07 82.71
79(1a) Symphysial angle 0.73 0.54 0.24 0.11 88.94
Total contribution (%) 37.98 20.31 17.74 9.50 85.54
Cumulative proportion (%) 37.98 58.29 76.04 85.54 85.54
1)The sample size is 26. The number of principal components shown here was determined so that the cumulative proportion of the variances of the principal components exceeded 80%.
2)See the second footnote to Table 1.
*P0.05; **P0.01; ***P0.001, by a two-tailed bootstrap test.
Table 35. Solution obtained through normal varimax rotation of the first four principal components for the corre- lation matrix on the tenth set of craniofacial measurements from Japanese males.1)
Factor loadings Variable2)
Fac I II III IV
1 Cranial length 0.06 0.11 0.92* 0.09
8 Cranial breadth 0.36 0.20 0.58 0.38
17 Basi-bregmatic height 0.07 0.04 0.16 0.96
79(1) Profile angle of mandible 0.94*** 0.07 0.04 0.04
K163 Chin angle 0.03 0.94*** 0.13 0.08
79 Mandibular angle 0.46 0.68 0.38 0.13
79(1a) Symphysial angle 0.36 0.87*** 0.04 0.03
1)The sample size is 26. The cumulative proportion of the variances of the four principal components is 85.54%.
2)See the second footnote to Table 1.
*P0.05; **P0.01; ***P0.001, by a two-tailed bootstrap test.
Table 36. Principal component analysis of the correlation matrix on the tenth set of craniofacial measurements from Japanese females.1)
Factor loadings Total
Variable2) variance
PC I II III (%)
1 Cranial length 0.21 0.45 0.79 86.68
8 Cranial breadth 0.02 0.87 0.34 86.29
17 Basi-bregmatic height 0.41 0.62 0.14 57.07
79(1) Profile angle of mandible 0.58 0.52 0.51 86.39
K163 Chin angle 0.96*** 0.01 0.08 93.30
79 Mandibular angle 0.51 0.59 0.48 83.24
79(1a) Symphysial angle 0.96*** 0.13 0.10 95.29
Total contribution (%) 37.92 28.16 17.95 84.04
Cumulative proportion (%) 37.92 66.08 84.04 84.04
1)The sample size is 19. The number of principal components shown here was determined so that the cumulative proportion of the variances of the principal components exceeded 80%.
2)See the second footnote to Table 1.
Table 37. Solution obtained through normal varimax rotation of the first three principal components for the cor- relation matrix on the tenth set of craniofacial measurements from Japanese females.1)
Factor loadings Variable2)
Fac I II III
1 Cranial length 0.02 0.13 0.92
8 Cranial breadth 0.15 0.48 0.78
17 Basi-bregmatic height 0.13 0.72 0.20
79(1) Profile angle of mandible 0.85 0.37 0.02
K163 Chin angle 0.88*** 0.39* 0.07
79 Mandibular angle 0.09 0.90 0.10
79(1a) Symphysial angle 0.92*** 0.29 0.13
1)The sample size is 19. The cumulative proportion of the variances of the three principal components is 84.04%.
2)See the second footnote to Table 1.
*P0.05; **P0.01; ***P0.001, by a two-tailed bootstrap test.
Table 38. Spearman’s rank correlation coefficients between males and females in the variation pattern of factor loadings on the principal components and/or rotated factors obtained from the first sets of craniofacial mea- surements.1)
Male PC I II III IV Fac I II III IV
Female PC I .66* – – .62* – – – –
II – – .72** – – – – –
III – – – – – – – –
IV – – – – – – – –
V – – – .67* – – – –
Fac I .58* – – – – – – –
II – – .70** – – – – –
III – – .72** – – – – –
IV – – – – – – – –
V – – .60* – – – – –
1)Only those rank correlation coefficients significant at the 5% level are listed here. The signs of rank correlation coefficients are removed because the signs of factor loadings are reversible. The original factor loadings are listed in Tables 2, 3, 4, and 5.
*P0.05; **P0.01; ***P0.001, by a two-tailed test.
Table 39. Spearman’s rank correlation coefficients between males and females in the variation pattern of factor loadings on the principal components and/or rotated factors obtained from the second sets of craniofacial mea- surements.1)
Male PC I II III IV V Fac I II III IV V
Female PC I – – – – – – – – – –
II – – .68* – – – – – – –
III – – – – – – – – – –
IV – – – .81*** – – .61* – – –
Fac I – – – .65* – – – – – –
II – – .73** – – – – .58* – –
III .55* .60* – – – – – – – .65*
IV – .62* – – – – .55* – – .74**
1)Only those rank correlation coefficients significant at the 5% level are listed here. The signs of rank correlation coefficients are removed because the signs of factor loadings are reversible. The original factor loadings are listed in Tables 6, 7, 8, and 9.
*P0.05; **P0.01; ***P0.001, by a two-tailed test.
Table 40. Spearman’s rank correlation coefficients between males and females in the variation pattern of factor loadings on the principal components and/or rotated factors obtained from the third sets of craniofacial mea- surements.1)
Male PC I II III IV V VI Fac I II III IV V VI
Female PC I – – .62* – – – – – – – – .73**
II – – .77** .59* – – – – – – .71** –
III – – – – – – – – – – – –
IV – – – – – – – – – .61* – –
V .65* – .58* – – – – – .69* – – .64*
Fac I – – .62* – – – – – – – – .73**
II – – .68* – – – – – – – – –
III – – – – – – – – – – – –
IV – – .63* – – – – – – – – –
V – – – – – .62* – – – – – –
1)Only those rank correlation coefficients significant at the 5% level are listed here. The signs of rank correlation coefficients are removed because the signs of factor loadings are reversible. The original factor loadings are listed in Tables 10, 11, 12, and 13.
*P0.05; **P0.01; ***P0.001, by a two-tailed test.
Table 41. Spearman’s rank correlation coefficients between males and females in the variation pattern of factor loadings on the principal components and/or rotated factors obtained from the fourth sets of craniofacial mea- surements.1)
Male PC I II III IV V Fac I II III IV V
Female PC I – – – – .68* – – – – –
II – – – – – – – – – –
III – – – – .59* – – – – –
IV .66* – – – – – – – – –
V – – – – – – – – – –
Fac I – – – – – – – – – –
II – – – – – – – – – –
III – – – – .55* .57* – – – –
IV – – – – – – .59* – – –
V – – – – .59* – .57* – – –
1)Only those rank correlation coefficients significant at the 5% level are listed here. The signs of rank correlation coefficients are removed because the signs of factor loadings are reversible. The original factor loadings are listed in Tables 14, 15, 16, and 17.
*P0.05; **P0.01; ***P0.001, by a two-tailed test.
Table 42. Spearman’s rank correlation coefficients between males and females in the variation pattern of factor loadings on the principal components and/or rotated factors obtained from the fifth sets of craniofacial mea- surements.1)
Male PC I II III IV V Fac I II III IV V
Female PC I – – – – – .68* – – – –
II – .87** – – – – .73* – – –
III – – – – .80** – – – – –
IV – – – .68* – – – – – –
Fac I – – – – – – – – – –
II – – – – – – – – – .80**
III – – – – .70* – – – – –
IV – – – – – – – – – –
1)Only those rank correlation coefficients significant at the 5% level are listed here. The signs of rank correlation coefficients are removed because the signs of factor loadings are reversible. The original factor loadings are listed in Tables 18, 19, 20, and 21.