九州大学学術情報リポジトリ
Kyushu University Institutional Repository
水中カウンターコリジョンにより得られるセルロー スナノファイバーがポリビニルアルコールとの相互 作用で誘発する特異なナノサイズ効果
石川, 元人
https://doi.org/10.15017/1931971
出版情報:Kyushu University, 2017, 博士(農学), 課程博士 バージョン:
権利関係:
Unique Nano-size Effects on Interaction of Poly(vinyl alcohol) with Cellulose Nanofibers
Prepared by Aqueous Counter Collision
(水中カウンターコリジョンにより得られるセルロースナノファイバーが ポリビニルアルコールとの相互作用で誘発する特異なナノサイズ効果)
Gento Ishikawa
2017
Contents
General Introduction
1. Interaction in hierarchical structure formation of plant cell walls 1
2. Nano-size effects based on interaction of nanomaterial 2
3. Significance of nanocellulose from historical viewpoints 4
4. Aqueous counter collision (ACC) method as physicochemical process to provide unique ACC-nanocellulose 10
5. Objective and outline of this thesis 12
Chapter 1
: Dual Nano-size Effects of ACC-wood Nanocellulose with Poly(vinyl alcohol) (PVA) Induced by Aqueous Counter Collision 17 1.1. Introduction 171.2. Experimental 21
1.3. Results and discussion 25
1.4. Conclusion 45
1.5. References 47
Chapter 2:
Dependence of Crystalline Phases on Thermodynamic Interactions between Size-controlled ACC-bacterial Nanocellulose and PVA49
2.1. Introduction 50
2.2. Experimental 51
2.3. Results and discussion 56
2.4. Conclusion 69
2.5. References 70
Summary
73List of publications
76Acknowledgements (Reconocimiento)
77General Introduction
1. Interaction in hierarchical structure formation of plant cell walls
Interactions are required to fabricate materials with the hierarchical structure from molecules or building blocks, and the properties are mostly dependent on the interfaces between the components. In nature, for example, plant cell wall is hierarchically constructed by cellulose microfibrils as building blocks in collaboration with various intermolecular interactions as described below.1-3Cellulose molecule is a liner homo-polymer composed of D-glucopyranosyl residues linked by the β-(1→4) glycolsidic linkages, in which every unit is 21-helix with respect to neighboring unit. Hence, the repeating unit is a dimer of glucose, which has amphiphilic properties: hydrophilic plane of hydroxy groups and hydrophobic plane of glucose units. In nature, cellulose microfibrils are hierarchically biosynthesized from the cellulose molecules with various interactions.4-9 Basically, on the formation process of microfibrils, self-organization occurs by intermolecular interactions as driving force.
Namely, hydrogen bonding and van der Waals forces become a glue for engaging each cellulose chain. Strong hydrogen bond contributes to form a plane of glucan sheet.
Subsequently, the glucan sheets are stacked by themselves in the perpendicular direction to the plane by van der Waals forces10-13: On the plasma membrane, there are linear arranged terminal complexes (TCs), which are cellulose synthase complexes.
Each TC consists of six TC subunits in a rosette pattern. TC subunits synthesize cellulose molecular chains, which subsequently form an elementary fibril by
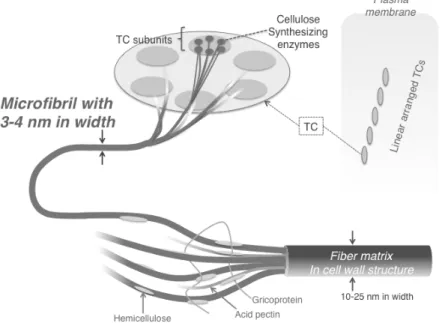
self-assembly. The elementary fibrils are further aggregated by themselves into one microfibril with 3-4 nm in width (Fig. 1).
Figure 1. Hierarchical structure of wood cellulose microfibrils and fiber matrix of cell wall.9
Further, cellulose microfibrils are assembled to form a bundle with 10-25 nm in width.14-17, which creates storing frame body structures of plants. Namely, plant cell walls are hierarchically made up by building blocks of cellulose microfibrils by engagements with various intermolecular interactions to result in the creation of strong frames of the plant body. In other words, an understanding of such a hierarchical structure is required to elucidate the characteristics of the interactions.
2. Nano-size effects based on interaction of nanomaterial
In teams of interaction, the initial stage for the cell wall formation is the establishment of intermolecular interaction to engage a nano-sized object. Therefore, it
is needed to concern interaction at the nano-scales. From the end of 1990s,
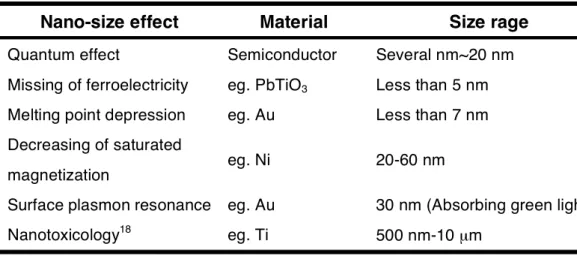
“nanotechnology”, which handles matters in the range of 10-7~10-9 m has been widely considered in various scientific fields. Regardless of organic, inorganic, and metal substances, the nanomaterials often show characteristic effects on the surfaces with size dependence at the nano-scale. In other words, it is often seen that extraordinary nano-size effects based on changes in interaction energy are induced by a decrease in the size as well as large specific surface areas (Table 1).
Table 1. Nano-size effects of nanomaterials with their sizes at the nano-scale
In Table 1, various nano-size effects can be commonly understood by focusing on interactions derived from such nanomaterials. For example, such interaction can have effect on living body. Metal titan usually shows well biocompatibility such as dental implant and artificial joint. However, living body changes bio-interactivity against nano-sized titan component; then the biointeractable particle of nano-titan induces the intrinsic functions and reactions of biological organisms, which is known as
Nano-size effect Material Size rage Quantum effect Semiconductor Several nm~20 nm Missing of ferroelectricity eg. PbTiO3 Less than 5 nm Melting point depression eg. Au Less than 7 nm Decreasing of saturated
magnetization eg. Ni 20-60 nm
Surface plasmon resonance eg. Au 30 nm (Absorbing green light)
Nanotoxicology18 eg. Ti 500 nm-10 µm
“nanotoxicology”.18 Nano-size effects are also often observed in the interaction between nano-particles and light. Gold nanoparticles can interact with optical wave by surface plasmon resonance (SPR), which has a dependence on particle size at the nano-scale.
Gold nanoparticle with 30 nm in diameter absorbs green light wave by SPR and simultaneously it reflects red light in 700 nm: glass composite with the gold nanoparticle is observed as red-colored stained glass. SPR is exhibited in clay nanocomposite at wall paint in ancient Maya.19 The paint material “Maya blue” was composed of natural clay, indigo and iron oxide nanoparticles with several nm. Through the nano-size effect was achieved by iron oxide particle, the Maya blue nanocomposite shows beautiful color and remarkable time-proof.
In this way, unconventional nano-size effect can be captured by consideration of interaction with dependence on the size of nano-objects including cellulose nanofiber.
3. Significance of nanocellulose from historical viewpoints
Among various materials with nano-sized dimension, nanocellulose, which is cellulose nanofiber less than 100 nm in width with aspect ratio over 100 has attracted much attention, because of the reasons as follows: (1) cellulose itself is the most abundant renewable biopolymer mostly synthesized in plants, which produces about 1011 t/year all over the world,3,20 (2), nanocellulose exhibits excellent properties such as thermal stability,21 high crystalline elastic modulus with low density,22 and the reflective index as well as common resins. Additionally, significance of nanocellulose
in society has been developed through the long history of cellulosic materials as follows.
With the progress in composite materials, cellulose has been often employed as reinforcement filler. Even the origin of composite material included cellulose fiber; it was clay composites reinforced with woods and other natural fibers. Owing to the latest excavation,23 the origin of cellulose composites can be traced back to 20,000 years ago:
Fragments of the oldest pottery were found in southern China. For some time since then, fragments of wood or plants were employed to compound with clay matrix as well as other natural products such like stones, shells, bones, tendons, and skins for prevention of cracking during the dry process. In Mesopotamia, Egypt and China, adobe blocks were also produced with fragments of straw fiber as filler in mud clay.24 Moreover 2,300 years ago in China, primitive paper was invented. Accompanying with the development of science, natural cellulose fiber processed into fine size by mechanical treatment together with some simple chemical treatment.
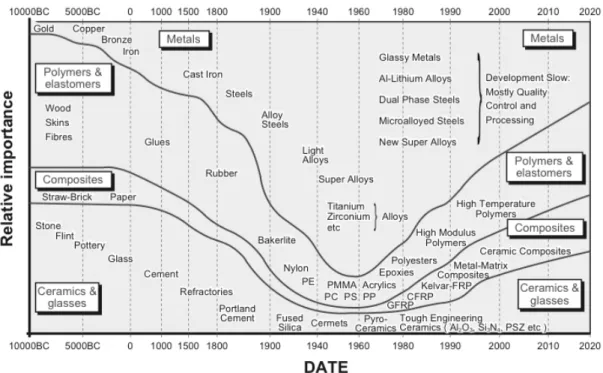
In the 20th century (see Fig. 3),25 on behalf of old materials such as metals, ceramics or glasses, polymeric materials started to be widely applied for composite materials after the appearance of phenolic resin in 1907,26 poly(vinyl alcohol) in 1924,27 nylon in 1935,28 and polyester in 1941.29-30 Ahead of these developments of polymeric materials, the presence of cellulose was first discovered and isolated in 1838.31 Further, various studies about the cellulose had become a foundation of polymer science, which was started from the demonstration of macromolecules by Staudinger in 1926.32
Figure 3. Transition of relative importance of materials: Reprinted from ref. 25 © 1992, 1999, 2005 Michael F. Ashby.
Gradually from 1930s, petroleum-derived polymeric materials began to be produced on commercial basics, which became to be mixed with micro or nano-sized objects such as carbon materials, asbestos, glass fibers, and cellulose fibers for improvement of the mechanical or thermal properties. Particularly, much attention to carbon fibers and aramid fibers was paid because of their stiffer and stronger, but lighter properties than aluminum and steels.In the first case of industrial products with use of cellulose fiber, aircraft parts were manufactured from phenolic plastics reinforced with hemp cellulose fibers at England in 1937.33 Additionally, decorative laminates and plastic dinnerware, which were based on phenol-formaldehyde, urea-formaldehyde, melamine-formaldehyde resins, widely employed cellulose fibers in the form of wood flour or purified cellulose.34
The main benefits of cellulose fibers used in phenolic and amino plastics were diminishment of shrinkage and thermal energy during curing. Other benefits were improved impact resistance, stiffness, and lower costs than other reinforcement filler.
Further, because the Young’s modulus of cellulose fillers was estimated to increase with thinner width, cellulose nanofibers or cellulose molecules were assumed to have more potential than microfibers. The theoretical calculations of the elastic moduli of cellulose chains gave values of ca. 160 GPa,35 which surpass elastic modulus of steels and aramid fibers. Throughout much of the 20th century, many kinds of cellulose filler were prepared mechanically or chemically. Until 1980s, the size of cellulose microfibers obtained from mechanical process was up to 0.1 mm and the aspect ratio was 100-200.36 However, such cellulose filler also showed poor solubility and high hygroscopic property.
On the other hand, chemical method for cellulose pulverization was invented:
Cellulose nanocrystals were firstly prepared from woods by refluxing with 2.5 N of sulfuric acid by Nickerson and Habrle in 1947.37 The whisker form was first observed through a transmission electron microscope by Mukherjee and Woods in 1953.38 Around the same time, filled polymer design was started to garner attention.
Accompanying with the development of unfilled polymer, filled thermoplastics can be designed at low cost and with the easier improvement of the properties. The increased use of filled polymer was conduced to much focus on filler, coupling agents, and compound techniques. Because of the background, much attention was also paid to
various chemical modifications for cellulose fibers for mixing with hydrophobic resins.39
It was difficult to isolate cellulose molecules and cellulose nanofibers at low energy until 1990s. However, until the start of the 21st century, an array of method for producing nanocellulose was devised. Now in the last decades, the preparation method developed at low energy cost (Table 2).40 Production pathway of nanocelluloses can be classified mechanical, chemical, and physicochemical process. Nanocelluloses have become attractive materials as commercial products in comparison to other nanomaterials (Fig. 4).
Table 2. Proposed pulverization process for preparing nanocellulose.
Pulverization method Specific treatment
Chemical Carboxylation / TEMPO-mediated oxidation41,42 Carboxylation / Periodate-chlorite oxidation43 Sulfonation44
Carboxymethylation45 Quaternization46
Mechanical Homogenization47
Microfluidization48 Refining49
Grinding50,51
Physicochemical Aqueous counter collision52,53 Supporting method Microemulsions54
Bio-based deep eutectic solvent55 Alkali aqueous solution56
Enzymatic treatments57,58
Figure 4. Domestic product amounts of nanomaterials with scale estimation to increasing use of nanocellulose.59
In this way, cellulosic materials and nanocellulose have become to be developed. In particular, only chemical treatment have been considered appropriate to modify nanocellulose surface, which can alter the interaction with other components in the nanocomposite in order to use as filler without coupling agents or compatibilizer.
Further, hidden potential ability of nano-sized cellulose such as nano-size effects has not been studied fully because of the difficulty in controlling the width size at the nano-scale until the emergence of aqueous counter collision method.52
4. Aqueous counter collision (ACC) method as physicochemical process to provide unique ACC-nanocellulose
The ACC system invented by Kondo et al. is a unique physicochemical method to provide amphiphilic nanocellulose with controlling the width size at the nano-scale without any chemical modification.52,53 Overview of the ACC nano-pulverization system is described as below (Fig. 5): Two aqueous suspensions containing the micro-sized csamples are expelled through dual nozzles, whereupon the two streams collide against each other under high pressure, resulting in a moment, wet pulverization forms an aqueous dispersion of nano-sized objects. Namely, the energy generated from the counter collision with controlled by ejecting pressure becomes a driving force to the instant pulverization of the cellulose microfibrils into cellulose nanofibers.
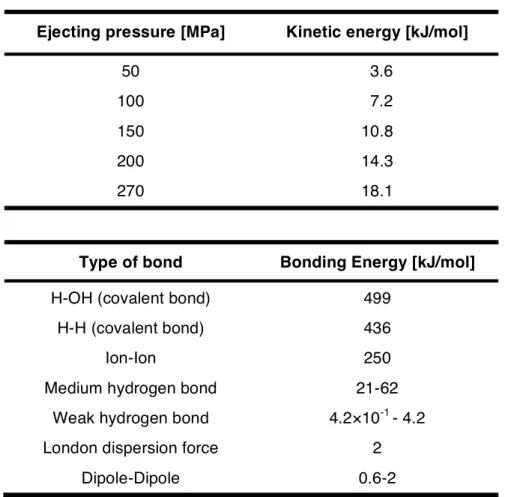
As mentioned in section 1 of this introduction, natural cellulose microfibrils are hierarchically formed via various intermolecular interactions such as van der Waals forces and hydrogen bond: The van der Waals forces link laminated a lot of glucan sheets, which were individually formed by hydrogen bonding between glucan units. For example, under the condition of 200 MPa as ejecting pressure in ACC treatment, the hydrogen bond connecting glucan units is not disconnected, but only van der Waals forces that link outside of the glucan sheets are forced to be cleaved. Kondo et al. have reported a relationship between the water ejection pressure and calculated kinetic energy of water molecules in ACC process, together with a summary of bond energies as shown in Table 3.53 The ACC nano-pulverization is allowed to selectively cleavage of the interaction. Simultaneously, ACC treatment can impart amphiphilic Janus type
surface into ACC-nanocellulose. Namely, after the selective cleavage of van der Waals forces, obtained cellulosic fraction exposes both hydrophobic plane derived from glucan sheets and hydrophilic area based on hydroxy groups on the fiber surface. Therefore, the obtained ACC-nanocellulose shows amphiphilic property on the surface.60
Figure 5. Cyclic diagram of ACC system (A), which can split and pulverizing hydrophilic cellulose microfibers by the counter collision (B and C) into amphiphilic nanocellulose by exposing hydrophobic plane of glucan sheets on the fiber surface (D).
Table 3. Relationship between water ejection pressure and calculated kinetic energy of water molecules, in addition to a summary of bond energies.53
Physicochemical ACC method has a potential to reveal surface characteristics of ACC-nanocellulose by controlling the width size at the nano-scale. In fact, Kose and Kondo firstly revealed nano-size effects of ACC-nanocellulose derived from bacterial nanocellulose mixed with poly(lactic acid) (PLA).61 By kinetic analysis, they claimed that ACC-nanocellulose with c. a. 60 nm in width is the most effective nucleating agents for PLA among various nanocelluloses sized at the nano scale.
5. Objective and outline of this thesis
Ejecting pressure [MPa] Kinetic energy [kJ/mol]
50 3.6
100 7.2
150 10.8
200 14.3
270 18.1
Type of bond Bonding Energy [kJ/mol]
H-OH (covalent bond) 499
H-H (covalent bond) 436
Ion-Ion 250
Medium hydrogen bond 21-62
Weak hydrogen bond 4.2×10⁻¹ - 4.2
London dispersion force 2
Dipole-Dipole 0.6-2
This thesis attempts to reveal nano-size effects by focusing on interaction of amphiphilic ACC-nanocellulose with PVA, which is expected to form strong interaction of hydrogen bonding.62,63 Namely, the crystallization behavior of PVA was used as a probe of surface characteristics of ACC-nanocellulose. The nano-size effects based on the interaction induced by ACC would provide a prospective acquired to better use of nanocellulose in the nanocomposite.
In Chapter 1, in order to elucidate and quantify nano-size effects from the viewpoints of thermodynamic interaction, ACC-wood nanocellulose was prepared through ACC treatment and subsequently centrifugation. The ACC-nanocellulose with precisely controlled width at the nano-scale was mixed with PVA to prepare nanocomposite film. Then, the interaction between the two components in their nanocomposite was proven by crystallization behavior of PVA.
In Chapter 2, with aiming to reveal influence of the cellulose crystalline phase on the nano-size effects of ACC-nanocellulose interacting with PVA, PVA crystallization was thermodynamically estimated in the nanocomposite of PVA/ACC-nanocellulose of bacterial nanocellulose (ACC-BNC), which has composition of cellulose Iβ/Iα
crystalline phases. Namely, BNC was nano-pulverized by ACC with controlling the width size at the nano-scale, simultaneously mixed with PVA in the ACC system, which induced formation of interaction between ACC-BNC surface and PVA component. The effects of crystalline phase were surveyed in comparison to the case of interaction between Iβ-dominant ACC-wood nanocellulose/PVA.
References
(1) Emons, A. M. C.; Mulder, B., M. Trends Plant Sci. 2000, 5, 35-40.
(2) Taylor, N. G. New Phytologist 2008, 178, 239-252.
(3) Habibi, Y. Chem. Rev. 2010, 110, 3479-3500.
(4) Delmer, D. P.; Amor, Y. Plant Cell 1995, 7, 987-1000.
(5) Brown, R. M. Jr. J. Mcaromol. Sci. A 1996, 33, 1345-1373.
(6) Brown, R. M. Jr. Pure Apply. Chem. 1999, 71, 767-775.
(7) Wasteneys, G. O. Curr. Opin. Plant Biol. 2004, 7, 651-660.
(8) Paredez, A. R.; Somerville, C. R.; Enrhardt, D. W. Science 2006, 312, 1491-1495.
(9) Gibson, L. J. J. R. Soc. Interface 2012, 9, 2749-2766.
(10) Cousins, S. K.; Brown, R. M. Jr. Polymer 1995, 36, 3885-3888.
(11) Nishiyama, Y.; Langan, P.; Chanzy, H. J. Am. Chem. Soc. 2002, 124, 9074-9082.
(12) Nishiyama, Y.; Sugiyama, J.; Chanzy, H.; Langan, P. J. Am. Chem. Soc. 2003, 125, 14300-14306.
(13) Li, Y.; Lin, M.; Davenport, J. W. J. Phys. Chem. C 2011, 115, 11533-11539.
(14) Fahlen, J.; Salmen, L. J. Mater. Sci. 2003, 38, 119-126.
(15) Cosgrove, D. Nat. Rev. Mol. Cell. Biol. 2005, 6, 850-861.
(16) Donaldson, L. Wood Sci. Technol. 2007, 41, 443-460.
(17) Moon, R. J.; Martini, A.; Nairn, J.; Simonsen, J.; Youngblood, J. Chem. Soc.
Rev. 2011, 40, 3941-3944.
(18) Watari, F.; Takashi, N.; Yokoyama, A.; Uo, M.; Akasaka, T.; Sato, Y.; Abe, S.; Totsuka, Y.; Tohji, K. J. R. Soc. Interface 2009, 6, S371-S388.
(19) JoseYacaman, M.; Rendon, L.; Arenas, J.; Puche, MCS. Sience 1996, 273, 223-225.
(20) Vilaplana, F.; Stromberg, E.: Karlsson, S. Polym. Degrad. Stb. 2010, 95, 2147-2161.
(21) Nishino, T.; Matsuda I.; Hirao, K. Macromolecules 2004, 37, 7683-7687.
(22) Saito, T.; Kuramae, R.; Wohlert, J.; Berglund, L.A.; Isogai, A.
Biomacromolecules 2013, 14, 248-253.
(23) Wu, X.; Zhang, C.; Goldberg, P.; Cohen, D.; Pan, Y.; Arpin, T.; Bar-Yosef, O.
Science 2012, 336, 1696-1700.
(24) Masahiko, U. J. Japan Soc. Compos. Mater. 1996, 22, 165-173.
(25) Ashby, M. F. Materials Selection in Mechanical Design;
Butterworth-Heinemann, Linacre House, Jordan Hill, Oxford, 1992; p. 1.
(26) Baekeland, L. H. Ind. Eng. Chem. 1909, 1, 149-161.
(27) Cons. für Elektrochem. Ind. GmbH, 1924, DRP 450,286.
(28) American Chemical Society National Historic Chemical Landmarks,
“Foundations of Polymer Science: Wallance Carothers and the Development of Nylon” 2000.
(29) Whinfield J. R.; Dickson, J. T. 1941, UK patent No.578,079.
(30) Whinfield J. R.; Dickson, J. T. 1941, US patent No.2,465,319.
(31) Payen, A. Comp. Remd. 1838, 7, 1052-1056.
(32) Staudinger, H. Ber. Deut. Chem. Ges. 1920, 53, 1073-1085.
(33) Mcmullen, P. Composites 1984, 15, 222-230.
(34) Zadorecki, P. Polymer Composites, 1989, 10, 97-77.
(35) Matsuo, M.; Sawatari, C.; Iwai, Y.; Ozaki, F. Macromolecules 1990, 23, 3266-3275.
(36) Dalvag, H.; Kalson, C.; Stromwall. H. E. Int. J. Polym. Mater. 1985, 11, 9-38.
(37) Nickerson, R. F.; Harble, J. A. Ind. Eng. Chem. 1947, 39, 1507-1512.
(38) Muckherjee, S. M.; Woods, H. J. Biochem. Biophys. Acta 1953, 10, 499-511.
(39) Habibi, Y. Chem. Soc. Rev. 2014. 43, 1519-1542.
(40) Nechyporchuk, O.; Belgacem, M. N.; Bras, J. Ind. Crops Prod. 2016, 93, 2-25.
(41) Saito, T.; Isogai A. Biomacromolecules 2004, 5, 1983-1989.
(42) Saito, T.; Nishiyama, Y.; Putaux, J. L.; Vignon, M.; Isogai, A.
Biomacromolecules 2006, 7, 1687-1691.
(43) Liimatainen, H.; Visanko, M.; Sirviö, J.A.; Hormi, O.E.; Niinimäki, J.
Biomacromolecules 2012, 13, 1592-1597.
(44) Liimatainen, H.; Visanko, M.; Sirviö, J.; Hormi, O.; Niinimäki, J. Cellulose 2013, 20, 741-749.
(45) Aulin, C.; Ahola, S.; Josefsson, P.; Nishino, T.; Hirose, Y.; Osterberg, M.;
Wågberg, L. Langmuir 2009, 25, 7675-7685.
(46) Liimatainen, H.; Suopajärvi, T.; Sirviö, J.; Hormi, O.; Niinimäki, J. Carbohydr.
Polym. 2014, 103, 187-192.
(47) Turbak, A.F.; Sandberg, K. R. US Patent 4,374,702, 1983.
(48) Zimmermann, T.; Pöhler, E.; Geiger, T. Adv. Eng. Mater. 2004, 6, 754-761.
(49) Karande, V.S.; Bharimalla, A.K.; Hadge, G.B.; Mhaske, S.T.; Vigneshwaran, N. Fibers Polym. 2011, 12, 399-404.
(50) Yano, H.; Nakahara, S. J. Mater. Sci. 2004, 39, 1635-1638.
(51) Nakagaito, A. N.; Yano, H. Appl. Phys. A 2005, 80, 155-159.
(52) Kondo, T.; Morita, M.; Hayakawa, K.; Onda Y. US Patent 7,357,339, 2005.
(53) Kondo, T.: Kose, R.; Naito, H.; Kawai, W.; Kondo, T. Carbohydr. Polym.
2014, 112, 284-290.
(54) Carrillo, C.A.; Laine, J.; Rojas, O. J. ACS Appl. Mater. Interfaces 2014, 6, 22622-22627.
(55) Sirviö, J. A.; Visanko, M.; Liimatainen, H. Green Chem. 2015, 17, 3401-3406.
(56) Hassan, M. L.; Hassan, E. A.; Oksman, K. N. J. Mater. Sci. 2011, 46, 1732-1740.
(57) Pääkkö, M.; Ankerfors, M.; Kosonen, H.; Nykänen, A.; Ahola, S.; Österberg, M.; Ruokolainen, J.; Laine, J.; Larsson, P. T.; Ikkala, O.; Lindström, T.
Biomacromolecules 2007, 8, 1934-1941.
(58) Nechyporchuk, O.; Pignon, F.; Belgacem, M. N. J. Mater. Sci. 2015, 50, 531-541.
(59) HP of Ministry of Economy, Trade and Industry
(www.meti.go.jp/policy/chemical_management/other/nano.html)<2017-2-19>
(60) Tsuboi, K.; Yokota, S.; Kondo, T. Nord. Pulp. Paper Res. J. 2014, 29, 69-76.
(61) Kose, R.; Kondo, T. J Appl. Polym. Sci. 2013, 128, 1200-1205.
(62) Nishio, Y.; Haratani, T.; Takahashi, T. Macromolecules, 1989, 22, 2547–2549.
(63) Kondo, T.; Sawatari, C.; Manley, R. St. J.; Grey, D. G. Macromolecules 1994, 27, 210-215.
Chapter 1
Dual Nano-size Effects of ACC-wood Nanocellulose
with Poly(vinyl alcohol) (PVA) Induced by Aqueous Counter Collision
ABSTRACT: This chapter describes dual nano-size effects induced by Janus type of amphiphilic ACC-wood nanocellulose derived from microcrystalline cellulose. The ACC-wood nanocelluloses of widths 12, 51, and 99 nm were prepared by ACC treatment and subsequent centrifugation, mixed with PVA, and cast from aqueous mixtures. The interactions between two components in the nanocomposite films were investigated thermodynamically. Surface properties of the ACC-wood nanocellulose depended on the width but not the cross-sectional shape. Melting point depression of the PVA component showed that for ACC-wood nanocelluloses of widths 12 and 51 nm, nucleation resulted in PVA nanocrystallization, whereas ACC-wood nanocellulose of width 99 nm diluted PVA. This dual effect with dependence on the fiber width was complementary studied through kinetic analysis of PVA crystallization and investigation of stability parameter of the crystalline domains of PVA.
1.1. Introduction
In the last decade, cellulose nanofibers, i.e., nanocellulose, of width less than 50 nm and with an aspect ratio greater than 100, have attracted increasing attention in both basic and applied fields, e.g., in composites,1–5 paper and board,6 medicine,7 coatings,8–
10 aerogels,11,12 filtration,13 electronics,14 and rheological modifiers.15 Nanocellulose has the following advantages: (1) it is produced from the most abundant sustainable natural source; (2) thermal stability in the range of −200 to 200 °C,16 (3) a high crystalline elastic modulus and a low specific density,17 and (4) a desirable refractive index similar to those of common resins, enabling production of transparent nanocomposites.
Nanocellulose is typically manufactured by TEMPO-mediated oxidation,18,19 which is a chemical process, a grinding method,20,21 which is a mechanical process, and the aqueous counter collision (ACC) method,22,23 which is a physicochemical process.
Recently, it has been shown that the characteristics of nanocellulose depend on the preparation process. Most nanocellulose generally poses hydrophilic surfaces,24 but the ACC process can create hydrophobic planes on nanocellulose surfaces.25
The ACC process, which was developed by Kondo et al.,22,23,26 involves repeated cycles of counter collisions using dual aqueous suspension jets containing samples under high pressure. The energy generated through collisions, typically at an ejection pressure of 200 MPa, enables destruction and/or continuous disruption of weak molecular interactions such as van der Waals forces; micro samples are pulverized to nanoscale samples. The destruction of interactions and the subsequent miniaturizing depend on the ejection pressure of the ACC water jets.26
Native cellulose fibers have a hierarchical structure built on various interactions.
A combination of hydrogen bonding and van der Waals forces stabilizes micro-sized cellulose fibers. In particular, hydrogen bonding among the equatorial hydroxy groups in individual anhydroglucose units provides glucan sheets with hydrophobic surfaces.
Macrofibers are assembled by van der Waals interactions between the hydrophobic faces of the glucan sheets. Destruction and disruption of the weaker van der Waals forces in microfibers caused by ACC expose the hydrophobic faces on the resulting nanocellulose surfaces. The ACC process therefore creates amphiphilic Janus type nanocellulose surfaces, and this enables their use as surfactants, emulsifiers, and dispersers. The ACC process exposes the inherent surface properties of natural materials with hierarchical structures (see Scheme 1).
Scheme 1-1. ACC system for Janus type amphiphilic nanocellulose production
Amphiphilic ACC-nanocellulose can be used in a wide range of applications without chemical modification of its surface. ACC-nanocellulose can also be used in nanocomposites; for example, ACC-nanocellulose can be dispersed in a hydrophobic
polypropylene polymer matrix.27, 28 Clarification of the interfacial interactions between the filler and matrix is necessary for the production of improved nanocomposites. In terms of the nano-size effect, it has generally been thought that smaller particles give better nanocomposite properties by increasing the surface area of the filler. The relationship between the mechanical properties and nanocomposite filler size has been studied.29,30 However, there have been few studies of the nano-size effect in nanocellulose composites, except in the case of ACC-nanocelluloses.31
The ACC method can provide nanocellulose of a desirable width. Kose and Kondo reported size effects in the interfacial interactions between ACC-nanocellulose and poly(lactic acid) (PLA).31 They examined size effect on PLA crystallization rate of PLA/ACC-nanocellulose derived from microbial cellulose (ACC-BNC) from viewpoints of kinetic and microscopic study. They reported that ACC-BNC with widths within a certain nanoscale range were more effective nucleating agents than microfibers.
They also reported that nanocelluloses with widths below this nanoscale range were not necessarily better nucleating agents for PLA; PLA crystallization in the presence of nanocellulose of width 60 nm was better than that in other systems with smaller nanocelluloses.
The aim of this chapter was to elucidate and quantify nano-size effect of amphiphilic ACC-wood nanocellulose by investigating thermodynamic interactions.
The surface property of ACC-wood nanocellulose was investigated by using poly(vinyl alcohol) (PVA) as the probe, whicih can interact with ACC-nanocellulose.32,33 ACC-wood nanocelluloses of three sizes were prepared and
mixed with PVA. The interactions between the ACC-nanocellulose surface and PVA molecules were investigated thermodynamically. The results show that the ACC-wood nanocellulose surface has a dual nano-size effect on PVA crystallization.
1.2. Experimental
1.2.1. Preparation of ACC-wood nanocellulose
Microcrystalline cellulose (FUNACEL II®, Funakoshi Co., Ltd., Tokyo, Japan), which was suspended in water, was used directly, without purification, for ACC treatments, as follows. The microcrystalline cellulose was dispersed in ultrapure water at 0.4 wt.%. The number of collisions is expressed as a pass number (Pass). The ACC treatment conditions were 120 MPa with 30 Pass, and 240 MPa with 30 Pass. The suspensions obtained by ACC treatment were selectively fractionated to a defined width by centrifugation for 10 min at 25 °C and 400 G for the suspension obtained at 120 MPa, and at 51.1 kG for the suspension treated at 240 MPa.
1.2.2. Transmission electron microscopy (TEM) examination of ACC-wood nanocellulose
ACC-treated cellulose aqueous suspensions were dropped onto copper grids covered with formvar. The samples were negatively stained with uranyl acetate aqueous solution and air-dried before examination using TEM to determine the shapes and sizes of the fibers obtained by ACC treatment. The sizes were taken as the average of 50 cellulose fiber specimens in the images.
1.2.3. Preparation of nanocomposites of ACC-wood nanocellulose with PVA
Prior to mixing, PVA was saponified with 0.1 N sodium hydroxide aqueous solution to remove residual acetates. The PVA purity was reached to 99.9%. Aqueous suspensions of ACC-wood nanocellulose and PVA aqueous solution were prepared separately.
A PVA solution (1.2 wt%) was mixed with an aqueous suspension of ACC- wood nanocellulose by stirring overnight. The weight fraction of the treated cellulose in the mixture was controlled in the range of 5–25%. When added over 25%, the endothermic peak derived from PVA fusion in the nanocomposite was hard to be experimentally observed in differential scanning calorimetry. The mixture was poured into polyethylene cups, and degassed using a water aspirator in a warm bath at 50 °C for overnight. The suspension was dried in an oven at 50 °C for casting.
1.2.4. Measurement of nanocomposite film density
The specific density (d) of the cast film was measured to determine the volume fraction of cellulose fibers in the composite using pycnometry. Density measurements were performed at 25 °C using p-xylene (0.86 g/cm3, Wako Pure Chemical Industries, Ltd., Tokyo, Japan) and tetrachloromethane (1.59 g/cm3).
1.2.5. Skin volume fraction of ACC-wood nanocellulose components
To investigate the effects of ACC-nanocellulose surface interactions with PVA, the skin volume of the nanocellulose components (VNC-sur) was used as a thermodynamic index. The treated cellulose fibers were assumed to be n-sided prisms for investigating the effect of the cross-sectional shape of the cellulose fibers produced by ACC treatment (see Scheme 1-1). A schematic diagram is shown in Figure 1-1. The surface volume fraction, VNC-sur/Vcom, was estimated using Eq. (1-1), i.e., cellulose nanofiber (CNF) number × (skin volume of single CNF) / total volume of nanocomposite:
𝑉!"!!"#/𝑉!"#= CNF number × 𝑙𝑅!!!sin!!! −(𝑙−2𝑡)(𝑅−𝑡)!!!sin!!! /𝑉!"# (1-1)
where Vcom is the total volume of nanocomposite, l is the nanocellulose length, R is the cross-sectional radius, and t is the effective skin thickness. The number of nanocellulose fibers in a composite film, i.e., the CNF number, is assumed to be proportional to the volume fraction of nanocellulose components. Based on this assumption, the CNF number can be given as
CNF number= 𝑘!!!"##
!"# (1-2)
The parameter k is the ratio of the weight of the composite body to that of a single nanocellulose fiber. If Wcom is the weight of the nanocomposite film, the volume fraction of the ACC-nanocellulose skin can be obtained from Eq. (1-1) and Eq. (1-2) as 𝑉!"!!"#/𝑉!"# =𝑘𝑉!"##
𝑉!"#× 𝑙𝑅!−(𝑙−2𝑡)(𝑅−𝑡)! 𝑛
2sin2𝜋 𝑛 /𝑉!"#
Then, dividing both sides by the parameter k, and subsequently transforming Vcell and Vcom using their weights and densities, gives
𝑉!"!!"#
𝑘𝑉!"# = 𝑙𝑅!− 𝑙−2𝑡 𝑅−𝑡 ! ×𝑛
2sin2𝜋 𝑛 ×
𝑓𝑊!"#
𝑑!"##
𝑊!"#
𝑑
!
Here, f is the weight fraction of ACC-nanocellulose in the nanocomposite and dcell is the density of microcrystalline cellulose as 1.50 g/cm3; Eq. (1-3) is finally obtained:
V!"!!"#/𝑘V!"#= 𝑙𝑅!−(𝑙−2𝑡)(𝑅−𝑡)! ×!!sin!!! ×!!/!!"##
!"#/!! (1-3)
Figure 1-1. Schematic diagram of cross-sectional image of nanocellulose. Left image is used for calculation of whole volume of single nanocellulose fiber, and right image represents calculation of interior volume of single nanocellulose fiber. Difference between the two volumes indicates surface volume of a single nanocellulose fiber.
1.2.6. Thermodynamic measurements to obtain equilibrium melting
points
Differential scanning calorimetry (DSC) was used to investigate the interfacial interactions between ACC-wood nanocellulose and PVA. DSC of the composite was performed under a nitrogen atmosphere using a Perkin-Elmer DSC-7 instrument (PerkinElmer, Inc., Waltham, MA, USA). The instrument was calibrated with an indium standard. The equilibrium melting point of the PVA component mixed with ACC-wood nanocellulose was determined from the DSC measurements as follows. Film specimens (5.00–6.67 mg) were placed in aluminum sample pans and heated to 235 °C; this temperature was maintained for 5 min to eliminate any PVA crystalline residues. The samples were quenched to the selected isothermal crystallization temperature and the temperature was held for 7 hr to allow complete crystallization. The samples were then cooled to 20 °C. After isothermal crystallization of the sample, the melting point was measured using a heating rate of 10 °C/min. Hoffman–Weeks plots of the obtained melting points34 were used to determine the equilibrium melting points of the films.
1.3. Results and discussion
1.3.1 ACC-wood nanocelluloses with different nanoscale widths
The starting micro-sized cellulose samples were fractured into various nano-objects, depending on the ACC ejection pressure. The pass number was used to minimize the nano-object distribution, and the ejection pressure was used to control the fiber width. TEM images and average widths of the ACC-wood nanocellulose samples after centrifugation are shown in Figure 1-2. The average ACC-wood nanocellulose widths and lengths are listed in Table 1-1.
Figure 1-2. TEM images of negatively stained ACC-wood nanocelluloses: (a) width 12.31
± 4.47 nm, (b) width 51 ± 13.80 nm, and (c) width 99 ± 40.00 nm.
Figure 1-2 and the data in Table 1-1 show that three types of nanocellulose with different sizes were successfully prepared by ACC treatment and subsequent centrifugation. Generally, for colloidal particles or proteins, the sedimentation time (T) for centrifugation of spheres of diameter (diam) can be described by the Stokes equation.35
!
! =!"#$!×(!!!!!)!"
!"! (1-4)
𝑉 =𝜋𝑟!𝐿 (1-5)
𝑆=𝜋𝑟! (1-6)
where V is the sedimentation volume, ρp is the particle density, ρf is the fluid density, S is the sedimentation area, g is the gravitational acceleration constant (980.7 cm/s2), η is the fluid viscosity, L is the length of the centrifugation tube (10.7 cm), and r is the tube diameter (2.8 cm). If the ACC-wood nanocellulose can be regarded as a fine particcle with the same density as that of microcrystalline cellulose in the aqueous phase, under centrifugation at F G, Eq. (1-4) can be transformed as follows:
𝑑𝑖𝑎𝑚! =!.!"×!"!!
!×! (1-7)
Based on the above, the diam values under the centrifugation conditions described in the Experimental Section are calculated to be 1280 nm for the sample treated at 120 MPa and 113.2 nm for the sample treated at 240 MPa. These diam values are reasonable based on the average lengths in Table 1-1, which were obtained from TEM images. The Stokes equation generally assumes sedimentation of ideal spherical particles, but asymmetric specimens do not necessarily follow this equation. However, Eq. (1-7), based on the Stokes equation, can be roughly applied in this case because of the anticipated sizes of the ACC-wood nanocellulose fractionated by centrifugation forces.
Table 1-1. Densities of ACC-wood nanocellulose/PVA composite films
1.3.2. Nano-size effect in crystallization rate for PVA component mixed with ACC-nanocellulose
In order to elucidate nano-size effects of ACC-wood nanocellulose on PVA crystallization from the viewpoint of crystallization kinetics and mechanisms, crystallization behavior of PVA component in nanocomposite of ACC-wood
ACC-wood nanocellulose (Averaged width × length)
Weight fraction of nanocellulose (%)
Composite density [g/cm3] ACCNC-12
(12.3 nm × 230 nm)
15 1.492
10 1.482
15 1.471
20 1.462
ACCNC-51 (51.7 nm × 500 nm)
5 1.491
10 1.481
15 1.470
20 1.459
ACCNC-99 (99.4 nm× 1000 nm)
10 1.480
15 1.468
20 1.457
25 1.453
nanocellulose with different width at the nanoscale was investigated through DSC measurement. Namely, the relative crystallinity of PVA (X(t)) was evaluated as a function of isothermal crystallization time (t) :
𝑋(𝑡)= 𝐴!/𝐴! ×100 (1-8)
where At is the exothermic areas under DSC thermograms from t = A to t = t, while A∞
is the total areas surrounded by the thermograms and the baseline. Half time of crystallization (t1/2) was also defined as the time to reach X(t) = 50%. Table 1-2 shows a set of representative t1/2 data of the PVA/ACC-wood nanocellulose composite (= 95/5 in weight), whose PVA component was isothermal crystallized at the different crystallization temperatures.
In Table 1-2, PVA in the system of ACC-wood nanocellulose nanocomposite crystallized faster than neat PVA. To compare values of the crystallization rate and determine crystallization mechanism of the PVA component in the ACC-nanocellulose nanocomposite, Avrami theory was applied to the isothermal crystallization process. In the theory, relative crystallinity (X(t)) was described as follows:
1−𝑋(𝑡)= exp(−𝐾𝑡!) (1-9)
ln(−𝑙𝑛(1−𝑋(𝑡))= 𝑛 𝑙𝑛𝑡+𝑙𝑛𝐾 (1-10)
where K is the overall kinetic rate constant, and n is the Avrami exponent. These parameters are considered to be diagnostic to the mechanism of crystallization, because the two parameters, K and n, are respectively related to the crystallization rate and to the type of nucleation together with the geometry of the crystal growth. Avrami parameters were calculated according to the Eq. (1-9) and Eq. (1-10) (Table 1-2); the Avrami
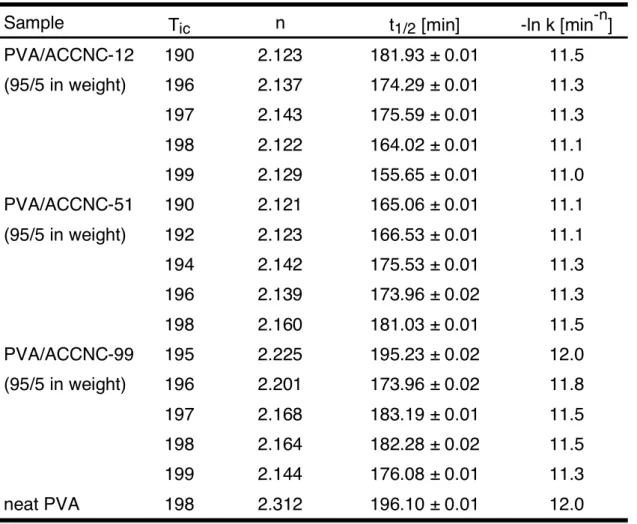
exponents of all samples are ranged in 2.1 < n < 2.3, which suggests that disk-like or rod-like lamella crystal was formed during the isothermal crystallization. The kinetic parameter in the system of PVA/ACC-wood nanocellulose nanocomposite was improved with comparison to the value of neat PVA. Namely, crystallization rate of PVA was accelerated by loading ACC-wood nanocellulose. Especially, ACCNC-12 and ACCNC-51 enhanced crystallization rate better than the thickest ACCNC-99.
Table 1-2. Avrami parameters for isothermally crystallized PVA mixed with ACC-nanocellulose having different width at the nanoscale
Sample Tic n t1/2 [min] -ln k [min-n]
PVA/ACCNC-12 190 2.123 181.93 ± 0.01 11.5 (95/5 in weight) 196 2.137 174.29 ± 0.01 11.3
197 2.143 175.59 ± 0.01 11.3
198 2.122 164.02 ± 0.01 11.1
199 2.129 155.65 ± 0.01 11.0
PVA/ACCNC-51 190 2.121 165.06 ± 0.01 11.1 (95/5 in weight) 192 2.123 166.53 ± 0.01 11.1
194 2.142 175.53 ± 0.01 11.3
196 2.139 173.96 ± 0.02 11.3
198 2.160 181.03 ± 0.01 11.5
PVA/ACCNC-99 195 2.225 195.23 ± 0.02 12.0 (95/5 in weight) 196 2.201 173.96 ± 0.02 11.8
197 2.168 183.19 ± 0.01 11.5
198 2.164 182.28 ± 0.02 11.5
199 2.144 176.08 ± 0.01 11.3
neat PVA 198 2.312 196.10 ± 0.01 12.0
Particularly under 196 oC of crystallization temperature, ACCNC-51 played a better roll to improve crystallization rate for PVA than the thinnest ACCNC-12.
Contrarily over 196 oC, crystallization rate of PVA loaded ACCNC-12 was faster than the case of ACCNC-51. In short, the crystallization rate of PVA in ACC-nanocellulose nanocomposite did not be improved necessarily in proportion to thinness of ACC-nanocellulose at the nanoscale. Under 196 oC of crystallization temperature, relationship between enhancement of PVA crystallization rate and width-size of ACC-nanocellulose much corresponds to previous study of PLA/ACC-nanocellulose nanocomposite system,31 which demonstrated that the most optimal width-size of ACC-nanocellulose for PLA crystallization was at ca. 60 nm.
1.3.3. Interactions between ACC-wood nanocellulose and PVA in the nanocomposites, based on PVA melting point depression
The nano-size effects of ACC-wood nanocellulose on the PVA components were investigated based on thermodynamic interactions. If a thermodynamic interaction occurs between the two components, the equilibrium melting point (Tmeq) of the crystalline PVA component mixed with ACC-wood nanocellulose will be depressed.
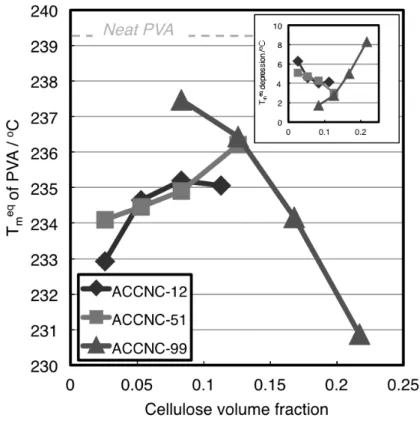
The Tmeq values of the individual samples were obtained from Hoffman–Weeks plots33 for isothermally crystallized PVA. Changes in the Tmeq values compared with that of neat PVA were clearly observed. The Tmeq for the individual composite samples were plotted against the cellulose volume fractions, as described in the Experimental Section (Figure 1-3).
The changing behaviors of the melting points observed using the samples of different widths, except in the case of ACCNC-99, did not show the changes typically observed for molecular blend systems.32,33,37 Only increasing addition of ACCNC-99 resulted in increasing depression of Tmeq compared with that of neat PVA (Inset of Fig.1-3), indicating good miscibility between the two components and thus a diluent effect of the ACC-wood nanocellulose component. The opposite behavior was observed in the other two cases. The more ACC-wood nanocellulose was added to the nanocomposites, the more the melting point was increased, resulting in increased melting temperatures. This indicates that these thicker ACC-wood nanocellulose samples acted as nucleating agents. This is presumably because only the surfaces, and not the inner domains, of the individual ACC-nanocellulose components interacted with PVA. The volume fraction parameters in Figure 1-3 therefore need to be modified by considering the interior volumes in the fibers.
Figure 1-3. Equilibrium melting point (Tmeq) of PVA components as function of cellulose volume fractions. The inset indicates relationship between the Tmeq depression and cellulose volume fraction to be applied to Eq.(1-11-2)
Eq. (1-1) was used to modify the volume fractions of the nanocellulose components. The parameter k was introduced to calculate the entire volume of the nanocomposite (Eq. 1-2). The parameter k indicates the volume ratio of a single ACC-wood nanocellulose compared with the entire nanocomposite body volume. The calculated k values were nearly constant, indicating that k does not necessarily depend on the ACC-nanocellulose size. The volume fractions of the ACC-nanocellulose components were therefore modified by Eq. (1-3) using k. In Figure 4, the horizontal
axis shows the surface index, which represents the skin volume fractions of the ACC-wood nanocelluloses in the nanocomposites.
Figure 1-4. Tmeq of PVA components against index representing skin volume fractions of three ACC-wood nanocelluloses with different widths; “n” is the number of sides in the prisms of cross-sections for ACC-wood nanocellulose as indicated Fig.1-1.
The figure shows that the melting point were not significantly affected by the cross-sectional shape of the nanofiber, which is assumed to be an n-sided prism (n = 5–
9) in the volume calculation as indicated Figure 1-1 and which could be provided by the down-sizing ACC process, i.e., the usual trend in the Tmeq change was obtained, irrespective of the cross-sectional shape of the ACC-wood nanocellulose. However, the change in the melting point of PVA clearly showed two different behavior against
increasing of surface index of ACC-wood nanocellulose, corresponding to Figure 1-3.
The Tmeq values of the PVA components mixed with ACCNC-12 and ACCNC-51 increased greatly with increasing nanocellulose surface volume fraction. In contrast, Tmeq decreased proportionally with increasing total surface amount of ACCNC-99 in the PVA matrix,
This change depending on the fiber width can be explained as follows. As mentioned above, the melting point changes of isothermally crystallized PVA samples suggest interfacial interactions among the components in the nanocomposites. For the two thinner samples, i.e., ACCNC-12 and ACCNC-51, with PVA, the Tmeq increased with increasing skin volume fraction of ACC-wood nanocellulose (see Figure 1-4). This behavior is considered to be the result of a nucleating effect. The surfaces of ACCNC-12 and ACCNC-51 may provide scaffolds for epitaxial crystalline growth of PVA. In contrast, increasing the skin volume fraction of the thicker ACCNC-99 enhanced the interactions between ACC-wood nanocellulose and PVA, resulting in Tmeq
depression. The effect of the ACCNC-99 surface is assumed to be similar to a diluent effect.
These two conflicting results indicate that the surface characteristics of ACC-nanocellulose in contact with PVA differ depending on the width of the Janus type of amphiphilic ACC-nanocellulose.25 The ACC-nanocellulose has a unique dual nano-size effect on PVA, depending on its width and amphiphilic properties. Previous studies on cellulosic molecular blends have shown that hydrophilic intermolecular interactions such as hydrogen bonding occur between PVA and nanocellulose33 and in
nanocomposites of TEMPO-oxidized cellulose nanofibrils (TOCNs).36 In addition, hydrophobic sites are exposed on the ACC-nanocellulose surface, and these may disturb hydrogen bonding with PVA. The nanoscale effects of hydrophilicity and hydrophobicity on interactions with PVA components need to be understood to clarify the mechanism of the unique nano-size effects of amphiphilic ACC-nanocelluloses.
In terms of the diluent effect, a cellulose molecule, i.e., the smallest cellulose component, is miscible with PVA.32,33,37 In the present study, ACCNC-99 functioned in the same way as a cellulose molecule. The thinner ACCNC-12 and ACCNC-51 ACC-nanocelluloses only acted as nucleating agents for PVA. The width range indicates the sizes that increase the nucleating ability.
1.3.4. Stability parameters of crystalline PVA in nanocomposites
The stability parameter (φ) is represented by the slope in a Hoffman–Weeks plot.
This parameter is related to morphological factors such as the size or perfection of the crystal. Inverse value of stability parameter (γ) represents called as thickening coefficient, which is ratio of the lamella thickness to the lamella thickness of critical nucleus. The obtained φ and γ values for each sample were plotted against the cellulose surface index, as shown in Figure 1-5.
The stability parameters and thickening coefficients of the PVA/ACCNC-12 and PVA/ACCNC-51 nanocomposites did not change significantly with increasing surface volume of the nanocellulose. This suggests that the sizes and perfection of PVA crystal were almost constant in the nanocomposite with ACCNC-12 and -51. However, φ and γ
of PVA/ACCNC-99 varied significantly. For example, γ of PVA/ACCNC-99 became lower, which indicates that much crystalline PVA became more unstable after crystallization on the ACCNC-99 surface. In other words, ACCNC-12 and -51 surfaces acted better as the scaffold for PVA crystalline growth than ACCNC-99. These trends correspond to those already described for the melting point depressions. Besides, the results indicate that the crystalline morphologies of PVA mixed with ACCNC-12 and ACCNC-51 clearly differ from that of PVA grown with ACCNC-99. The melting point depression of PVA with ACCNC-99 can therefore be attributed to thermodynamic and some morphological effects.
Figure 1-5. Stability parameters (φ) and thickening coefficient (γ) of PVA against surface index, representing skin volume fractions of ACC-wood nanocellulose; “n” is the number of sides in the prisms of cross-sections for ACC-wood nanocellulose as indicated Fig.1-1.
1.3.5. Crystallinity of isothermally crystallized PVA component mixed with ACC-wood nanocellulose
In order to evaluate dual nano-size effects of ACC-wood nanocellulose surface on crystallinity of PVA, the crystallinity (XC) was estimated by using the fusion enthalpy:
𝑋! =∆!∆!!"#
!"" (11)
ΔHobs is observed enthalpy of melting and ΔH100 is melting enthalpy of perfect crystal which was estimated from fusion enthalpy of repeating unit 1.64 [kcal/mol].32 Obtained Xc values at each crystallization temperature was showed in Figure 1-6.
Figure 1-6. PVA crystallinity (XC) against isothermal crystallization temperature for PVA/ACC-wood nanocellulose with different width size at the nanoscale.
The figure shows that ACCNC-12 and -51 contributed to enhance crystallinity of PVA up to ca. 55%, which is 1.4~1.8 times higher than the crystallinity of neat PVA of ca. 30%~40%. ACCNC-12 and ACCNC-51 also improved PVA crystallization rate (see Table 2). These results indicate that two thinner ACC-nanocellulose actually worked as nucleating agent in the nanocomposite system. In contrast, PVA crystallinity loaded with the thickest ACC-nanocellulose, ACCNC-99, was below 40%. However ACCNC-99 never caused delay of crystallization of PVA (Table 2). It indicates that the surface of ACCNC-99, nevertheless the wide value of S.D. in average width, acted such as diluent rather than plasticizer for PVA.
1.3.6. Interaction parameters of ACC-wood nanocellulose and PVA
Unlike ACCNC-12 and ACCNC-51, which have nucleating effects, ACCNC-99 acts as a diluent for PVA. To further understand this type of interaction between ACC-wood nanocellulose and PVA, the interaction parameter, χ12, was used, in an extension of the Flory–Huggins approximation.38 Scott proposed an equation for the thermodynamic depression of the melting point caused by a diluent:391/𝑇!−1/𝑇!! = −𝑅∆!!!!
!!
!"!!
!! +(!!
!−!!
!)𝑣!+!!!!!!
! (1-12-1) where Tm0 is the melting point of neat PVA (= 512.36 K); Tm is the observed Tmeq for PVA mixed with a diluent; R is the gas constant [1.987 cal/(mol K)]; “1” and “2” refer to the non-crystallizable component and the crystalline component, respectively; v1 and
v2 are the volume fractions; V1 and V2 are the molar volumes; V2u is the molar volume of a repeating unit of 2; and ΔH2u is the enthalpy of fusion per mole of repeating unit of 2.
ACC-wood nanocellulose and PVA are assumed to be the non-crystallizable component and crystalline component, respectively. When V1 and V2 are 1 × 104 cm3/mol to 1 × 106 cm3/mol, the entropy term in Eq. (1-12-1) can be entirely neglected.40 The degree of polymerization of cellulose molecules in ACC-nanocellulose was estimated to be 200–250 because covalent bonds in the starting material (FUNACEL II®) cannot be cleaved by the provided ACC energy; V1 was estimated to be ca. 2 × 104 cm3/mol. The Mw of PVA was 31,000–50,000 and V2 was ca. 3 × 106 cm3/mol. Eq. (1-12-1) can therefore be rearranged to Eq. (1-12-2), and the enthalpic contribution to the melting point depression can be evaluated:
∆𝑇!!" =−𝑇!! ∆!!!!
!!𝐵𝑣!! (1-12-2)
ΔH2u/V2u for the PVA component was calculated to be 45.4 cal/cm3 by Nishio et al.32 Eq. (1-12-2) is related to the parameter B, which indicates the interaction energy density characteristics of the two components. The interaction parameter, χ12, is described as
𝜒!" =!!!"!! (1-12-3)
The molar volume of cellulose per repeating unit, V1u, is 107 cm3/mol, therefore χ12 at 512.36 K can be calculated:
𝜒!" =!.!"#×!"#.!"!×!"# (1-12-3')
In the case of the ACCNC-99/PVA nanocomposite, the volume fraction of the nanocellulose component (v1) can be calculated by three different ways: ν1 is (1)
considered to be the ratio of the whole cellulose volume (Vcell) to the entire composite volume (Vcom), (2) the ratio of the volume fraction of nanocellulose skin (VNC-sur) to Vcom, or (3) the ration of VNC-sur to sum of volume fraction of nanocellulose skin and PVA (VNC-sur + VPVA). These three different nanocellulose volume fraction can be used to calculate the values of B and χ12, which are listed in Table 1-3.
Table 1-3. Interaction energy density and interaction parameter for ACC-wood nanocellulose with PVA at 512K.
ν1
Interaction energy density, B [cal/cm3]
Interaction parameter, χ12
ACCNC-99/PVA Vcell/Vcom -12.15 -1.27
ACCNC-99/PVA VNC-sur/Vcom -17,973.12 -1889.00 ACCNC-99/PVA VNC-sur/(VNC-sur +VPVA) -9,916.48 -1042.24
ACCNC-51/PVA Vcell/Vcom 5.23 0.55
ACCNC-12/PVA Vcell/Vcom 4.53 0.48
molecular blend32 (at 513 K) -9.38 -0.985
Negative values of B and χ12 indicate the presence of attractive interactions between the two components. The data in Table 1-3 show that the ACCNC-99 surface interacted with PVA much better than ACCNC-51 and ACCNC-12. A comparison of the sets of data of ACCNC-99/PVA and molecular blend in the table shows that the thermodynamic indexes of ACC-wood nanocellulose/PVA were larger than those for a