R & D Subsidy in Japanese SMEs : A Preliminary Analysis
著者 Koga Tadahisa
journal or
publication title
Kansai University review of economics
volume 8
page range 63‑81
year 2006‑03
URL http://hdl.handle.net/10112/12262
Kansai University Review of Economics No. 8 (March 2006), pp. 63‑81
R&D Subsidy in Japanese SMEs : A Preliminary Analysis*
Tadahisa Koga
In this paper, the actual situation of R&D subsidy in Japanese SMEs is reported. We examine what type of firm awards R&D subsidies and to what industries R&D subsidies are mainly allocated. Simple analysis finds no significant difference in the level of R&D between subsidized firms and non‑subsidized firms. This suggests that endogeneuity problems are not so serious in our samples. The allocation of subsidy in industries might be influenced by appropriability condition and technological opportunity. We find that R&D subsidy tends to be distributed to industries where appropriability is relatively effective, or where technological opportunity is relatively abundant.
Keywords: NIKKEi Almanac of Venture Business, spillover,
Mean comparison test, Japanese national innovation survey
1. Introduction
New knowledge and technology, which are gained through a firm's R&D activities, bring positive benefits to other producers and consumers in the economy via spillover. According to Jaffe (2003), there are three kinds of spillover, that is, knowledge spillover, market spillover, and network spillover. Each type of spillover causes a discrepancy between the social rate of return and the private rate of return to a firm's R&D.
The existence of knowledge and market spillovers has already been identified by empirical studies which have also shown that the absolute level of these spillovers is quite high. For example, Griliches (1998) found evidence that the private rate of return for industrial R&D
* Any errors or omissions are the responsibility of the author.
63
64
ranges from 9 to 69 %, whereas the social rate of return is from 10 to 160%. Thus far, we are aware of empirical studies in which the combined effects of knowledge and market spillovers have been measured. If we consider these spillovers simultaneously, we expect to find a greater gap between the social rate of return and the private
rate of return for industrial R&D1.
These gaps may be partly filled by strengthening the appropriability conditions through patent systems. However, as Levin et al. (1987) suggested, a patent system does not always work in practice as it does in theory. An appropriability condition ensured by a patent system is not perfect, partly because many patents can be circumvented and partly because a patent needs stringent legal enforcement to prove that it is valid or that it is being infringed乞 R&D subsidy is another policy instrument which aims to correct such market failures and raise industrial R&D to socially optimal levels.
The above discussion regarding the expectation that subsidy would promote corporate R&D implicitly assumes the complementarity of subsidy to firm R&D. In the real word, however, subsidy sometimes replaces corporate R&D. In previous studies, at least two instances where subsidy may crowd out private R&D have been pointed out. The first instance is related to the funding process, and the second, to the inelastic supply of researchers in the labor market3.
Since subsidies are financed by tax payers'money, in the funding process, public funds tend to be awarded to projects with a high probability of success or projects whose performance is easy to assess ex post facto. However, these kinds of projects can often be financed by the firms'own money and do not need public support. In such a case, the government is simply supporting R&D projects that could actually be conducted without public funds. In other words, subsidy substitutes for self‑financed R&D.
Usually, firms must hire additional researchers when they launch new R&D projects. However, in an environment where the supply of
1 Jaffe (2003)
2 Cohen et al. (2000, 2002)
3 For example, Busan (2000), David et al. (1999), David and Hall (2000), Gonzalez et al. (2004), Irwin and Kienow (1996}, Lach (2002), Lichtenberg (1984, 1987, 1988), Mamuneas and Nadiri (1996), and Wallsten (2000).
65 researchers is inelastic, it is difficult for firms to recruit additional researchers from the labor market. Thus, firms are forced to re‑ allocate their existing researchers from in‑house R&D to subsidy projects. This means that a firm must discontinue their ongoing projects in order to carry out the publicly funded R&D projects. In this case, new projects or subsidy projects crowd out in‑house R&D4.
The literature suggests that, in theory, any publicly funded R&D and private R&D can be either complementary or substitutive. Hence, previous studies have focused on clarifying these relationships empirically. The relationship between the subsidy and private R&D has been examined on the basis of various levels of data, such as a national level, industry level, or firm level5. Almost half of the U.S.
studies indicate complementarity, between the two types of funding, whereas only two studies indicate it in other countries. In particular, five of twelve U.S studies, which are conducted based on firm level data, suggest complementarity
互
As the previous studies show, the results of empirical analyses are also diversified. In addition to simply examining substitutability or complementarity, recent empirical studies have involved attempts to investigate determinants of subsides more closely. For example, Buson (2000) considered what type of firms participate in R&D subsidy programs. Gonzalez et al. (2004) showed that R&D subsidy not only affects the level of R&D expenditures, but also the decision of whether a firm conducts R&D or not.
There have not been enough studies on the effectiveness of R&D subsidies in Japanese small and medium enterprises (SMEs). In addition, we do not understand what kind of firms receive subsides, or even to what industries R&D subsidies are allocated. Thus, the purpose of this paper is to summarize the actual situation of R&D subsidies in Japanese SMEs through a simple analysis.
This paper is organized as follows. The next section is a briefly explanation of the characteristics of the data on which our analysis is based. Then, we summarize what type of firm is awarded R&D
4 Jaffe (2003) suggested that the government must fund projects that have a high social rate of return, and that there is a low probability that public funds are displacing private funds.
5 David et al. (1999)
6 See for example Lichtenberg (1984) and Wallsten (2000).
66
subsidies, taking into account endogeneuity problems. In the section three, we consider to what industries R&D subsides are allocated.
Here, our interests are devoted to examining whether R&D subsidies are allocated to the industries that have strong appropriability regimes, or abundant technological opportunities. The final section concludes our discussions and notes future areas of research.
2. Subsidy and firm characteristics 2.1. Data
In this section, we briefly explain the source of data and how the sample firms are selected. Our 2,034 sample firms are collected from various volumes of NIKKEi Almanac of Venture Business (hereinafter Almanac) published by Nihon Keizai Shinbunsha.
Nihon Keizai Shinbunsha conducts a questionnaire survey to approximately 5,000 Japanese SMEs every year. Almanac reports the results of this survey. Almanac is the only publicly available source of information on R&D expenditures in Japanese SMEs.
The target of this survey is firms that (1) do not go public, (2) have unique technologies or know‑how, (3) have shown a high growth rate of sales in recent years, (4) are relatively immature, or, have started new businesses recently even if they are mature. The number of respondents to this survey differs every year, and, on annual average, nearly 2,000 firms respond to this survey each year. This means that the respondents are not necessarily the same every year.
Our sample firms are the firms that report their R&D expenditures some of the observed years. Firms that show their R&D expenditures as zero are also included. In other words, we exclude from our samples, the firms which do not respond to the question concerning R&D expenditures in Almanac.
Our 2,034 sample firms are collected from various industries.
Among them, the 1,322 manufacturing firms are classified into the following industries. food (96 firms:4. 7%), textile (43:2.1 %), wood products/paper (23:1.1 %), chemical/drugs (92:4.5%), glass/ceramic (30:1.5%), iron/no‑ferrous metals/fabricated metals (99:4.9%), general machinery (168:8.3%), electrical machinery (316: 15.5%), transportation equipment (46:2.3%), precision instruments (123:6.0%),
67
printing (30: 1.5%), and miscellaneous manufacturing industries (256:12.6%). On the other hand, the 712 non manufacturing firms are in housing/construction (75:3. 7%), information service (61 :3.0%), software (250: 12.3%), retailing (151 :7 .4%), services/others (175:8.6%). The percentage in parenthesis indicates the ratio of firms in each industry to all sample firms.
Some firms belong to a different industry in different years. For example, one firm was categorized under electrical machinery industry in Almanac 2003 and information service industry in Almanac 2004. In this case, we followed the industrial classification of the newest Almanac. Furthermore, some firms change their names or are acquired by other firms during the periods under consideration. In such cases, we confirmed the identity of these firms by checking their addresses and the names of their chief executive officers listed in these Almanacs.
Almanacs show both actual and scheduled values of R&D expenditures. W e revised scheduled values when the later volumes of Almanacs provided information on actual values. This means that all data on R&D in 2003 are scheduled values. Table 1 shows the number of R&D performing and non performing firms in our samples.
Table 2 displays the number of stable performers and occasional performers. Stable firms are defined as the firms reporting non‑zero R&D expenditures every observed year, and occasional performers are the firms reporting R&D some of the observed years7.
Table 1 Sample Firms
1999 2000 2001 2002 2003 1999‑2003 R&D Performers (1> 935 1,221 1,513 1,353 1,094 1,639
Non R&D Performers <2> 242 305 415 500 373 395
Total Samples 1,177 1,526 1,928 1,853 1,467 2,034
<1> Firms reporting non‑zero R&D expenditures
<2> Firms reporting zero R&D expenditures
7 Gonzalez et al. (2004)
Table 2 R&D Performers
Industries Stable Performers<1>
All 586
Manufacturing 467
Food 27
Textile 17 Wood products/Paper 4 Chemical/Drugs 39 Glass/Ceramic 11 Iron/No‑ferrous metals/Fabricated metals 28 General machinery 67 日ectricalmachinery 118 Transportation equipment 7 Precision instruments 57 Printing 8 Miscellaneous manufacturing 84
119 Housing/Construction 15 Information service 8 Software 48 Retailing 21 Services/Others 27
<1> Firms reporting non zero R&D expenditures every observed year
<2> Firms reporting R&D expenditures some of the observed years
Occasional Periormers(2l 1,053
703 63 6 13 46 15 54 85 173 33 55 12 148 350 32 38 161
49 70
~
All Performers 1,639 1,170 90 23 17 85 26 82 152 291 40 112 20 232 469 47 46 209 70 97
69 Almanacs report the name, year, and amounts of subsidies/public loans which were awarded to the firms. Here we concentrate on R&D‑
related subsides granted by national or local governments, or government‑affiliated institutions. In a strict sense, it may be necessary to distinguish subsidies from guarantee debt or public loans provided by government‑affiliated financial institutions.
Therefore, we include, in our samples, guarantee debts and public loans which are clearly related to R&D activity.
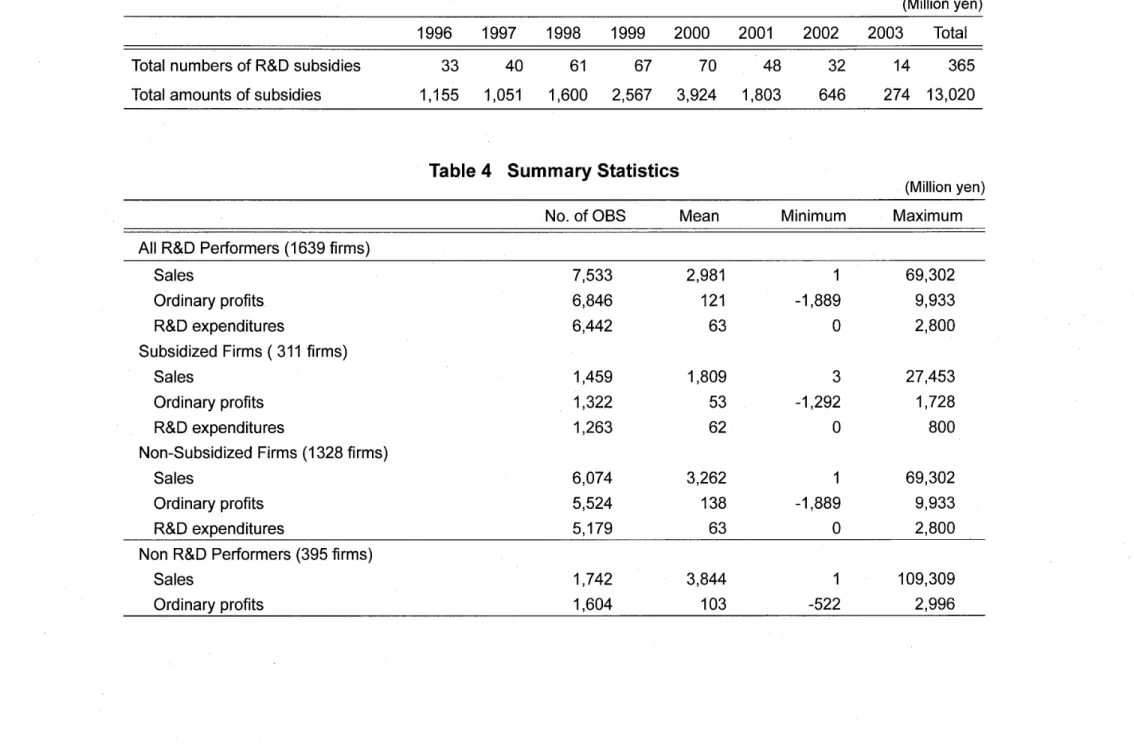
Some data on R&D are considered to be incorrect. In such cases, we corrected only those for which we obtained additional information on the data concerned. W e removed, from our samples, the data that do not include any information on the name and the amount of subsidy. Table 3 shows the number of R&D subsidies in a time series. 2.2. Subsidy and endogeneuity
Summary statistics for subsidized and non subsidized firms are shown in table 4. According to the statistics, sales and ordinary profits are higher in non‑subsidized firms than in subsidized firms. On the other hand, there might not be any significant differences in R&D expenditures between two groups.
Table5‑1 shows the results of the mean comparison test we conducted on all R&D performing firms. As clearly evident from this table, a considerable disparity in the number of samples between the two groups exists: 1,328 samples in the group of non‑subsidized firms as opposed to only 311 samples in the group of subsidized firms.
To eliminate this problem, we attempted to select 311 non subsidized firms in two manners. Random sampling is the first method to select firms. W e continued choosing firms randomly among 1,328 non‑subsidized firms until we selected 311 firms. Then, we compared subsidized firms with non‑subsidized firms. Table 5‑2 shows the results of mean comparison test in this case.
The second method is to make up a pair of companies that are similar in the age of the firm8. W e did so by selecting one from subsidized and the other from non‑subsidized firms. W e eventually created a total of 311 pairs, each consisting of a subsidized firm and
8 W e use the foundation year to determine the age of the firm
Table 3 R&D Subsides
70
(Million yen) 1996 1997 1998 1999 2000 2001 2002 2003 Total Total numbers of R&D subsidies
Total amounts of subsidies
33 40 61 67 70 48 1,155 1,051 1,600 2,567 3,924 1,803
32 646
14 365 274 13,020
Table 4 Summary Statistics
(Million yen) No. of OBS Mean Minimum Maximum All R&D Performers
Sales 7,533 2,981 1 69,302
Ordinary profits 6,846 121 ‑1,889 9,933
R&D expenditures 6,442 63
゜
2,800Subsidized Firms (311 firms)
Sales 1,459 1,809 3 27,453
Ordinary profits 1,322 53 ‑1,292 1,728 R&D expenditures 1,263 62
゜
800Non‑Subsidized Firms (1328 firms)
Sales 6,074 3,262 1 69,302
Ordinary profits 5,524 138 ‑1,889 9,933 R&D expenditures 5,179 63
゜
2,800Non R&D Performers (395 firms)
Sales 1,742 3,844 1 109,309
Ordinary profits 1,604 103 ‑522 2,996