Tes t i ng l oc al i z at i on of Thai aut om
obi l e
i ndus t r i es
著者
Kur oi w
a I kuo, Tec hakanont Kr i engkr ai , Keol a
Soukni l anh
権利
Copyr i ght s 日本貿易振興機構(ジェトロ)アジア
経済研究所 / I ns t i t ut e of D
evel opi ng
Ec onom
i es , J apan Ext er nal Tr ade O
r gani z at i on
( I D
E- J ETRO
) ht t p: / / w
w
w
. i de. go. j p
j our nal or
publ i c at i on t i t l e
I D
E D
i s c us s i on Paper
vol um
e
693
year
2018- 03
INSTITUTE OF DEVELOPING ECONOMIES
IDE Discussion Papers are preliminary materials circulated to stimulate discussions and critical comments
Keywords: automobiles, localization, industrial clusters JEL classification: C12, L62, R12
1 Chief Senior Researcher, Development Studies Centre, IDE-JETRO 2 Associate Professor, Thammasat University
3 Research Fellow, Bangkok Research Centre, IDE-JETRO
IDE DISCUSSION PAPER No. 693
Testing localization of Thai Automobile
Industries
Ikuo KUROIWA,
1Kriengkrai Techakanont,
2Souknilanh KEOLA
3March 2018
AbstractThe development of industrial clusters is crucially important for industries such as
automobiles. However, it is still doubtful whether all parts suppliers should be localized,
regardless of the parts categories. We tested the above hypotheses using data compiled from
the Thailand Automotive Industry Directory 2014. First, the factors affecting the location of
the Thai automobile industry were reviewed. Second, the kernel density of the bilateral
distances between parts suppliers was estimated. Finally, hypothesis testing on the
The Institute of Developing Economies (IDE) is a semigovernmental,
nonpartisan, nonprofit research institute, founded in 1958. The Institute merged
with the Japan External Trade Organization (JETRO) on July 1, 1998. The
Institute conducts basic and comprehensive studies on economic and related
affairs in all developing countries and regions, including Asia, the Middle East,
Africa, Latin America, Oceania, and Eastern Europe.
The views expressed in this publication are those of the author(s). Publication does not imply endorsement by the Institute of Developing Economies of any of the views expressed within.
INSTITUTE OF DEVELOPING ECONOMIES (IDE), JETRO 3-2-2, WAKABA,MIHAMA-KU,CHIBA-SHI
CHIBA 261-8545, JAPAN
©2018 by Institute of Developing Economies, JETRO
1
1. Introduction
The development of a local supplier base and the formation of an industrial cluster are
crucially important for strengthening the competitiveness of the industry and sustaining
industrial growth. The formation of an industrial cluster increases the competitiveness of
downstream industries by delivering parts and components at lower costs, in a shorter
time, and with more flexibility. In particular, development of an industrial cluster is
critical for industries such as automobiles, where parts and components are heavy and
bulky, and the just-in-time manufacturing system is effective for reducing inventory.
However, it is still doubtful if all the parts suppliers should be localized,
regardless of the category of the parts. Some parts―such as car seats and body
panels―are heavy and bulky, so their close proximity to the customer could be more
critical. Physical distance, on the other hand, may be less important if the parts are small,
light with high value added in relation to the transport costs. As a result, the physical
distance to the customers and the geographical spread of firms could be different,
depending on the characteristics of the parts.
This study tests the above hypotheses using the data compiled from the Thailand
Automotive Industry Directory 2014, which is a unique data set providing information
regarding the location, year of establishment, and ownership structure of firms.
The method we employed is based on Duranton and Overman (2005). As shown
below, this method departs radically from the traditional measures of spatial concentration,
which include the Gini, Isard, Herfindhal, and Thile indices. These indices measure
departure from the distribution benchmark of industrial activities: for instance, the Isard
index is based on the absolute distance between the actual and benchmark employment
2
(1997) because they do not identify whether any unevenness comes from localization or
industrial concentration.1 Ellison and Glaser introduced a new measure of localization
that controls for industrial concentration.2 However, the above measures still face a range
of aggregation problems, because they allocate establishments to geographical units at a
given level of aggregation, such as countries, regions, or states.3 The method developed
by Duranton and Overman avoids these problems by discarding any geographical
classification and basing the approach on the actual distance separating establishments.4
Many studies, including Duranton and Overman (2005), have tested the
localization of different industries, but none of them have focused on parts and
components within the same industry. This study tests the localization of auto parts
suppliers in Thailand. First, this study considers the factors that affect the locations of
1 For example, in the US vacuum cleaner industry, about 75 percent of the
employees work in one of the four largest plants. Obviously, it cannot be considered as geographically concentrated simply because 75 percent of the employees are concentrated in only four states. The concept of spatial concentration should be separated from that of industrial concentration (Ellison and Glaser, 1997).
2 In addition, localization measures with the same properties as those by Ellison
and Glaser (1997) have been developed by Maurel and Sédillot (1999) and Devereux, Griffith, and Simpson (2004).
3 As a result, it is difficult to compare the result across different spatial scales
because the existing indices are usually not easily additive across different levels of aggregation. Moreover, most existing geographical units are defined according to administrative needs, not economic relevance. Other problems facing the existing analytical methods include the fact that aggregating establishments at any spatial level leads to spurious correlations across aggregated variables and that downward bias is created when dealing with localized industries that cross an administrative boundary (Duranton and Overman 2005).
4 Duranton and Overman (2005) assert that their measure satisfies the five
3
auto parts suppliers. It then investigates the bilateral distance between them. Moreover, it
measures the distance between the parts suppliers and the nearest international port.
Finally, we conduct hypothesis testing on the localization of parts suppliers, using the
method based on Duranton and Overman (2005).
The study found that the automobile industry as a whole was significantly
localized. Concurrently, all categories of automobile firms were localized. In contrast,
only four categories of automobile firms―most notably services―were significantly
localized after controlling for the overall localization of the automobile industry.
Moreover, co-localization was identified between five pairs of different parts categories.
The paper consists of the following: First, the data set is introduced, followed by
the analysis method. Second, the factors affecting the localization of firms are considered
from the viewpoint of government policy and geographical factors. Third, the results of
an empirical analysis on the spatial distribution of firms are presented. Finally, the paper
concludes with the important findings.
2. Data
This study utilized data compiled from several sources. We began with data from the
Thailand Automotive Industry Directory 2014, which contains information about
automotive-related firms in Thailand5. The directory includes data on 1,954 firms. All the
firms have address information, including postal codes in Thailand. However, several
fields of information were lacking for our analysis. There were only 1,406 firms in the
directory that specified their year of establishment. Some entries had no information
5 The data set, Thailand Automotive Industry Directory 2014, was constructed
4
about their ownership structure.
We searched for each missing item and updated the relevant fields for our
analysis of the evolution of the firms in the industry over time, that is, the year of
establishment, ownership structure, and parts category. For the ownership structure, we
classified firms according to the nationality of ownership: 1) Thai firm (T) refers to a firm
with a Thai share larger than 80 percent, 2) Joint venture (JV) refers to a firm with a Thai
share between 20 and 80 percent, and 3) Foreign (F) refers to a firm with the Thai share
less than 20 percent. We utilized information from the database published online on the
Thailand Automotive Institute website.6
Regarding the parts category in the directory, the firms are classified according
to the categories related to their business. As a result, firms in the directory can have as
many as 225 categories of parts and/or activities. To make our analysis practical, we
classified and regrouped the parts into smaller groups of parts, as indicated in our previous
work (see Kuroiwa and Techakanont 2017).7
Although this data set includes the latest updates and is the most complete, some
6 Based on our interview with the Thai Automotive Institute, the database has been
compiled and updated, but the number of entries is less than those in the directory. In addition, the TAI database contained information about the ownership structure, i.e., the share of ownership by nationality. This information is the same as the business registration information at the Ministry of Commerce.
7 In this study, we followed the auto parts classification at www.marklines.com,
5
limitations remain. It is a snapshot of the firms that existed at the time of writing this
paper. It cannot reflect the actual evolution of firms from the past. Some firms that may
have been operating in the past, but no longer exist at present, do not show up in this data
set. In addition, information about the main business or main parts produced concerns
about the firms’ current production. Thus, when interpreting the evolutionary result of
localization and agglomeration of firms in this study, this limitation should be noted.
Location data is necessary for the analysis of localization (dispersion) and
co-localization (co-dispersion) of firms. Location in this paper is represented by geographical
coordinates, that is, longitude and latitude. The process of assigning geographical
coordinates to data is generally called “geocoding’.” For automobile firms, postal codes
obtained from the Thailand Automotive Industry Directory 2014 and other sources are
matched with postal codes from GeoNames Postal Code files
(http://www.geonames.org/postal-codes/) to generate the geographical coordinates of
automobile firms. There are 770 unique postal codes, and geographical coordinates from
the GeoNames Postal Code file for Thailand were downloaded for this study as they
appeared in December 2016. Each automotive firm would be assigned one of these
coordinates. On the other hand, the location of all manufacturing firms is based on
Thailand’s 2007 Industrial Census, which contains addresses of firms up to the district
(or the second administrative) level. There are 929 unique second administrative level
divisions, out of which 645 districts include one or more manufacturing firms. The second
administrative level divisions mostly, though not always, coincide with the districts. The
geographical coordinates of manufacturing firms are then generated by matching the
6
the GeoNames Postal Code files.8 The geocoding process in this study is summarized in
Figure 1 as follows:
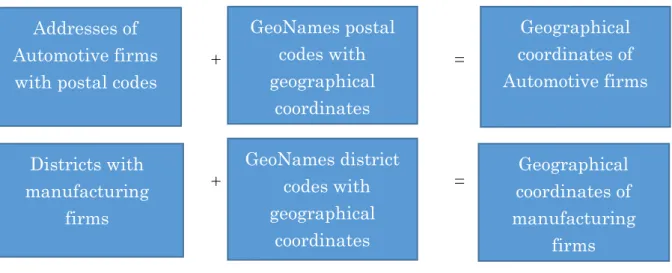
Figure 1: The geocoding process
+ =
+ =
Source: The authors
3. Method of analysis
The analysis framework of this study relies on the methodology proposed by Duranton
and Overman (2005). This consists of (i) the estimation of the kernel density distribution
of the bilateral distance between firms, (ii) the construction of counterfactuals and
confidence intervals, and (iii) a comparison of the above two distributions.
According to this methodology, the algorithm to identify localization (or
dispersion) of any n firms in any specific category is as follows: First, we estimated the
kernel density distribution of the bilateral distance between all pairs of firms using the
following formula:
8 Geographical coordinates of postal codes are simultaneously used by those of
districts. Therefore, the same geographical coordinates are used for both automobile firms and manufacturing firms.
Addresses of Automotive firms
with postal codes
7
���(�) =
1
�(� −1)ℎ � � � �
� − ��� ℎ � � �=�+1 �−1 �=1
, (1)
where ���(�) is the estimator of the kernel density at distance d, n is the number of firms
in a specific category, ��� is the Euclidean distance between firms � and �, � is the
Gaussian kernel function, and ℎ is an optimal bandwidth based on Silverman (1986).
Second, we constructed the counterfactuals by randomly assigning the n firms to
selected sites 1,000 times. A set of sites used as a benchmark, where firms could be
assigned randomly, was chosen depending on the objective of the analysis. For instance,
the benchmark can be the sites of postal codes where there are at least one or more
manufacturing firms. Kernel density was estimated for each of 1,000 simulations. As a
result, there would be 1,000 kernel density distributions of bilateral distances between
manufacturing firms. Two confidence intervals, namely, local and global, were
constructed based on these distributions. As in Duranton and Overman (2005), 5% global
confidence intervals were constructed so that 5% of the randomly generated kernel
densities lie above or below the boundaries across all distances between 0 and 180kms.9
10 The upper and lower global confidence intervals were denoted by ��
�(�) and ��(�),
respectively.
Third, we identified localization (or dispersion) by comparing the kernel density
distributions of bilateral distances (between firms in the specific category) to the
confidence intervals. Then the index of global localization Γ�(�) and the index of global
9 Meanwhile, the local confidence interval is defined as follows: For each industry,
for each kilometer in the interval, we rank our simulations in ascending order and select the 5th and 95th percentile to obtain a lower 5% and an upper 5% confidence
bound.
10 Following Duranton and Overman (2005) and Nakajima, Saito, and Uesugi
8
dispersion Ψ�(�) were computed using formulae (2) and (3), respectively.
Γ�(�) =�������(�)− ���(�), 0� (2)
Ψ_A (d) = �������(�)− ���(�), 0� if ∑�=180�=0 Γ�(�) = 0
0 otherwise (3)
Note that global localization is detected when the kernel density of an industry lies above
its upper confidence bound. Global dispersion is detected when the kernel density lies
below the lower confidence bound and never lies above the upper confidence bound in
the distance between 0 and 180 km.
4. Factors affecting the location of firms
4.1 Influence of government policy
The car industry requires thousands of parts and components. Location choice is crucial
in order to manage the supply chain and production efficiently. In this section, we discuss
the influence of government policies that have affected the evolution of automotive firms’
choice of location. In particular, we focus on the specific policies that shaped the
agglomeration of automotive clusters in the central and eastern regions of Thailand. In
addition to the local content requirement regulation, which was the most crucial policy in
developing the industry, infrastructure development, such as seaports, industrial estates,
road networks, and regional development within the eastern region, was equally
important for the industry.
Historically, manufacturing activities have always been concentrated in Bangkok,
because of its locational advantages, that is, proximity to the important Klong Toey Port
and its capital city status. Most firms chose to locate near Bangkok, and this caused
chronic congestion problems in the city. In 1972, the Industrial Estate Authority of
9
manufacturing activities around Bangkok, such as in Samut Prakarn, Bang Chan, and Lad
Krabang. Assemblers chose these locations for their production plants, and localization
of firms around these areas was observed during the 1970s. In the 1980s, IEAT established
regional IEs in the northern region and eastern provinces, in line with the rural area
development objectives.
The most important infrastructure development policy for the automotive
industry was the Eastern Seaboard Project (ESB). Although this project was initiated in
the mid-1980s, due to the chronic congestion problems in Bangkok and the port, it
remained inactive until the early 1990s (Poapongsakorn and Techakanont 2008). Then
industrial activities began to spread to the ESB area. The project received several sources
of finance, including Japanese Official Development Assistance (ODA) and World Bank
Loans. The Japanese government provided ODA and technical assistance for
infrastructure construction from the 1980s onwards (Watanabe 2003, p. 142). The Board
of Investment granted higher zoning incentives to firms in Zones Two and Three, and
these were major drivers for industrial decentralization toward the eastern provinces.
Since the 1990s, industrialization in the ESB, which includes Chonburi,
Chachoengsao, and Rayong, has accelerated. Lecler (2002) reported that the number of
factories in these three ESB provinces increased rapidly during the 1990s, after
completion of the ESB Development Plan I in 1990. The new seaport, Laem Chabang
Port in Chonburi province, started operating in 1991. This is the largest seaport in
Thailand and is the gateway for Thailand’s exports at present.
Later, between 1996 and 2005, the number of IE and non-IE factories established
in the ESB increased by about 19% (Poapongsakorn and Techakanont 2008). Chonburi
10
emerged naturally to the location of the major clusters of automotive factories, implying
that there are strong agglomeration economies that attract manufacturing establishments
to locate within the same cluster. Such economies include the flexibility of a large labor
market and the availability of relevant inputs. Automotive-related firms chose to locate
their new plants along the eastern highways to benefit from agglomeration economies and
save transportation costs. In sum, the location of automotive-related firms has been
shaped since the 1970s by a combination and streamlining of the government policies,
including the establishment of IEAT, regional development schemes through the BOI’s
zoning investment incentives, and the infrastructure development for the ESB Project.
4.2 Evolution of spatial distribution of automobile firms
In the previous section, we laid out the evolution of the automotive cluster and the
influence of government policies. It is clear how the latter, especially infrastructure
development in the eastern seaboard, stimulated the agglomeration of firms. To capture
these dynamics in greater detail, we examine and present the spatial distribution of firms
during the past five decades. We follow Kuroiwa and Techakanont (2017) to divide the
stages of industrialization of Thailand's automotive industry into four periods: 1)
1960-1975 (the initial stage of import substitution), 2) 1976-1985 (early stage of the
rationalization policy), 3) 1986-1999 (the second stage of rationalization and export
promotion), and 4) 2000-2014 (liberalization).
From our data, we analyzed 1,406 firms in the automotive industry with
complete information about the firms’ location, year of establishment, and type of
business.
11
and its vicinity, as well as in the central and eastern regions during 1960-75. Automobile
assemblers started to invest in Thailand due to the import substitution policy initiated in
the early 1960s. Firms chose the metropolitan area because it was the only area where
infrastructure facilities and access to local markets could attract investors. For instance,
Toyota, Isuzu, Hino, and Nissan set up assembly factories in Samut Prakan through the
1960s and up to the 1970s. Concurrently, parts manufacturing factories were established
in nearby vicinities.
Figure 2: Maps of automotive firms established in each period (from 1960 to 2014)
Source: Calculated from the Thailand Automotive Industry Directory 2014.
From 1975 to 1985, the trend of the previous period was accelerated by the
introduction of the local content policy in 1975 (which continued until 1999). This made
12
to Thailand, or provide technological assistance to the local suppliers. However, in-house
production remained prevalent during this period.
The locations of firms spread geographically after 1985. In the 3rd period,
1986-1999, newly established firms concentrated in the Bangkok metropolitan area and along
the Bangna-Trad road, which connects the area to the eastern region of Thailand.
According to Kuroiwa and Techakanont (2017), the number of establishments, both
foreign and local, surged in this period due to the appreciation of the Japanese yen after
the Plaza Accord and the rapid economic growth of Thailand in the early 1990s.
The momentum continued in the 4th period, due to the rapid recovery of the
automotive industry after the economic crisis in 1997. The process was spurred after
Toyota decided to increase export-orientation and make Thailand its production and
engineering hub for the Asia-Pacific region, and other key manufacturers, such as Honda
and Nissan, followed this initiative.
As suggested by spatial economics, trade liberalization and economic integration
are likely to decrease the locational advantage of the metropolitan area11, while increasing
the locational advantage of the frontier regions, such as port cities and border regions,
which offer superior access to international markets. A notable example was the eastern
region where the Laem Chabang Port opened in 1991, and Chonburi and Rayong became
frontier regions for newly established export-oriented firms. Most notably, Mitsubishi set
up an assembly factory in Chonburi in 1992, followed by Ford–Mazda and General
11During the period of import substitution, both inputs and markets were provided
13
Motors, each of which established factories in Rayong in 1998 and 2000, respectively.12
Infrastructure development and tax incentives increased the locational
advantages of the eastern region. Moreover, the Asian Financial Crisis was the tipping
point that increased the export orientation of the Thai automotive industry and enhanced
the locational advantages of the eastern region.
5. Results of the analysis
5.1 Kernel density distribution of the bilateral distance between firms
As discussed in Section 3, this study estimated the kernel density distribution of the
bilateral distance between firms. As we used data from the Thailand Automotive
Directory, we assumed to have included all the firms in the industry. Using Equation (1),
the kernel density distributions of bilateral distances between automotive-related firms
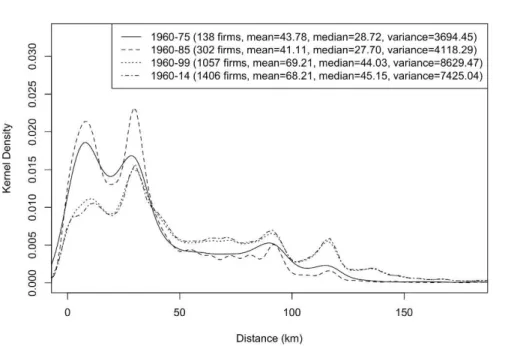
from 1960 to 2014 (divided into 4 periods with cumulative data) were calculated and are
displayed in Figure 3. Consistent with the previous discussion, before 1986, firms tended
to locate in the Bangkok metropolitan area. The spatial distribution of firms was
characterized by a cluster of plants separated by an average of 41-43 kilometers, and a
median of about 28 kilometers. As time passed, the bilateral distances between firms in
the industry became more dispersed. The average distance increased to 69 kilometers and
the median to 45 kilometers in the 3rd and 4th periods.
12 Note that the assemblers that set up factories in Rayong and Laem Chabang were
14
Figure 3: Kernel density distribution of bilateral distances between firms by period
(Cumulative)
Source: Calculated from the Thailand Automotive Industry Directory 2014.
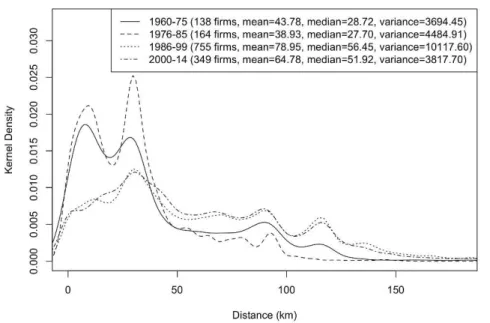
When analyzing the kernel density distribution of bilateral distances in each
period in Figure 4, we found a clear dispersion tendency by the firms. Between the first
and second period, there was a clear agglomeration of the firms, especially in the Bangkok
area. Then, chronic traffic problems caused the government to promote regional industrial
estates and infrastructure policy. The road network to the eastern seaboard played a crucial
role in attracting firms to locate to that region. This was perhaps the key reason for the
increase in the bilateral distance between firms during the second and third periods, as
the average distance increased from 39 to 79 kilometers. The agglomeration of firms
increased further as indicated by the shorter bilateral distance, in both the average and
15
Figure 4: Kernel density distribution of bilateral distances between firms by period
Source: Calculated from the Thailand Automotive Industry Directory 2014.
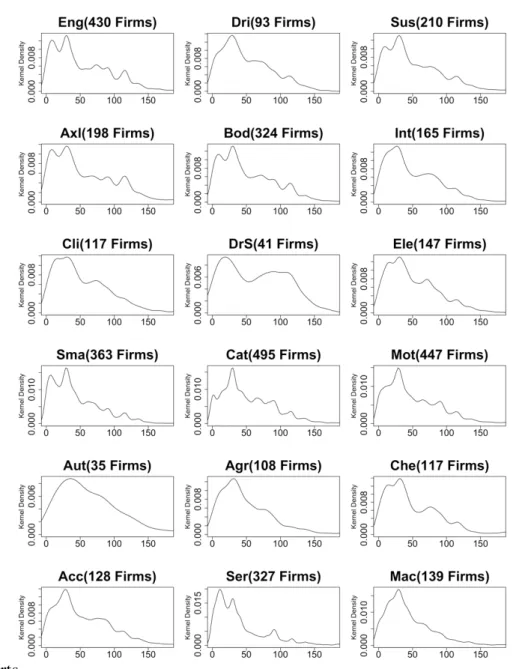
Is there a different location pattern based on the categories of parts and/or
activities? To answer this question, we need to calculate the kernel density distribution of
bilateral distances in all categories of parts. These are: 1) engine (Eng); 2) drive train
(Dri); 3) suspension/steering/wheels and tires (Sus); 4) axle/brake/body control (Axl); 5)
body and exterior (Bod); 6) interior (Int); 7) climate control (Cli); 8) driving support and
security (DrS); 9) electronic/electrical parts (Ele); 10) small/general parts (Sma); 11)
support activities and categories by production process (Cat); 12) clean energy system
(we omit this since there was no firm in this category); 13) motorcycle parts (Mot); 14)
automobile assembly (Aut); 15) agricultural machinery and other transport machinery
(Agr); 16) chemicals, oils, lubricants, and paint (Che); 17) accessories (Acc); 18) services
(trading, logistics, trade shows, training, etc.) (Ser); and 19) machine tools, jigs and
16
As can be seen in Figure 5 below, the automotive-related firms tended to locate
close to each other—in most cases less than 150 kilometers apart. It is undeniable that the
Bangkok metropolitan area is still the most attractive location for firms in this industry.
Our data (geographical mapping in Figure 3) revealed the same pattern of location shift
from Bangkok to the eastern region. However, some sectors deserve further discussion,
for instance, the automobile assembly (Aut) parts firms located in the central and eastern
region. Their factories are often in the same area or in the same industrial estate. For
example, Toyota and Isuzu have factories in Samut Prakarn in close proximity, whereas
several car manufacturers have factories in the Eastern Seaboard Industrial Estate. In
contrast, the longest bilateral distance is about 500 kilometers (not shown in the Figure),
thus showing weak dispersion beyond 150 kilometers, because there are some truck and
bus manufacturers located in Nakon Ratchasima and Khon Kaen.
17
Figure 5: Kernel density distribution of the bilateral distance between firms by category
of parts
Source: Calculated from the Thailand Automotive Industry Directory 2014.
Some sectors show a clear localization. These are: drive train (Dri); interior (Int);
climate control (Cli); driving support (DrS); support activities, categorized by production
process (Cat), chemicals (Che), accessories (Acc) and services (Ser). Some automotive
specifics, such as drive train, axles, brakes, and driving support, may need to stay close
18
region. In the next section, we test whether the categories of parts affect the localization
pattern of firms.
As infrastructure is important, the ESB project is hypothesized to be a crucial factor in
the agglomeration of firms. The Laem Chabang seaport and industrial estate was
constructed in the 1980s and started operating in the early 1990s, in the third period of
our classification. Instead of estimating the bilateral distance between firms, we
calculated the kernel density distribution of distance between firms and Laem Chabang
Port. Since we used Euclidean distance, one limitation should be noted. The distance
between Laem Chabang Port and Bangkok Port is about 74 kilometers according to our
calculation, but in fact the actual driving distance is about 116 kilometers. In Figure 6
below, the peak of the location of automotive firms in the first and second periods (1960
to 1985) was in Bangkok, about 80 kilometers from Laem Chabang Port. In the third and
fourth periods (1986-2014), the average distance of firms to this port increased to 87
kilometers in the period 1986 to 1999, but later dropped to 77 kilometers after 2000.
Nevertheless, the density of firms in Bangkok and its vicinity decreased significantly over
the various periods, indicating that automobile firms have located away from the Bangkok
metropolitan area and moved closer to Laem Chabang Port (which is indicated by the
left-hand side of the distribution). Particularly, locations such as Rayong (Eastern Seaboard
Industrial Estate) and Chachoengsao, which are about 36 and 70 kilometers from Laem
Chabang, respectively, increased their density. The location choice in the ESB seems to
be naturally suitable for automotive-related firms to agglomerate and reap the benefits of
19
Figure 6: Kernel density distribution of the distance (of firms) to Laem Chabang Port by
period
Source: Calculated from the Thailand Automotive Industry Directory 2014.
5.2 Hypothesis testing on the localization of automobile firms
5.2.1 Testing the localization of automobile firms (1)
In this section, we conduct various tests on the localization of the automobile firms, using
the method explained in Section 3.
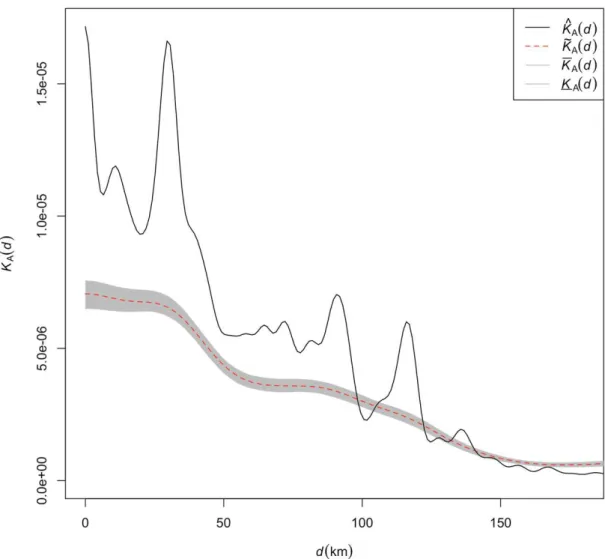
Figure 7 shows the result of the hypothesis testing on the localization of
automobile firms (for all categories of automobile parts combined) when a set of all the
existing (postal code) sites occupied by the manufacturing establishments is used as a
20
indicates a multiplicity of clusters tens of kilometers apart from each other―and
particularly the peak around 30 km is very high. The kernel density lies above the upper
confidence boundary from 0 to around 100 km. Since the existing sites of the
automotive-related firms are geographically concentrated in Bangkok and its vicinity, as well as in
the eastern region, the kernel density of the bilateral distances deviates significantly from
21
Figure 7: Hypothesis testing on the localization of automotive-related firms (Benchmark:
manufacturing establishments)
Source: Calculated from the Thailand Automotive Industry Directory 2014.
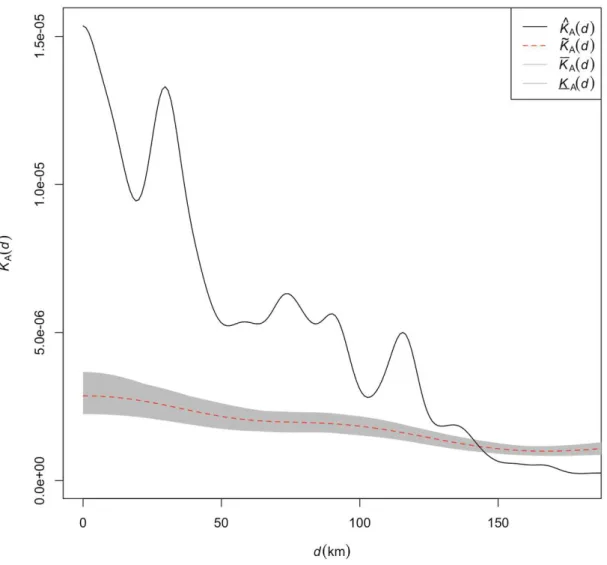
Next, we conducted hypothesis testing on the localization of automobile firms
by the categories of parts. The result shows that all categories (18 categories) of
automobile firms are significantly localized, as shown by the example of the engine parts,
22
Figure 8: Hypothesis testing on the localization of engine parts (Benchmark:
manufacturing establishments)
Source: Calculated from the Thailand Automotive Industry Directory 2014.
5.2.2 Measures of localization
Two measures of localization are introduced in this section. First, for each industry �,
we can define the following cross-distance indices: Γ� =∑180�=0Γ�(�) , and Ψ� =
23
measures are respectively the sum of each industry's index of global localization and
dispersion across all levels of distances (i.e., 0-180 km).
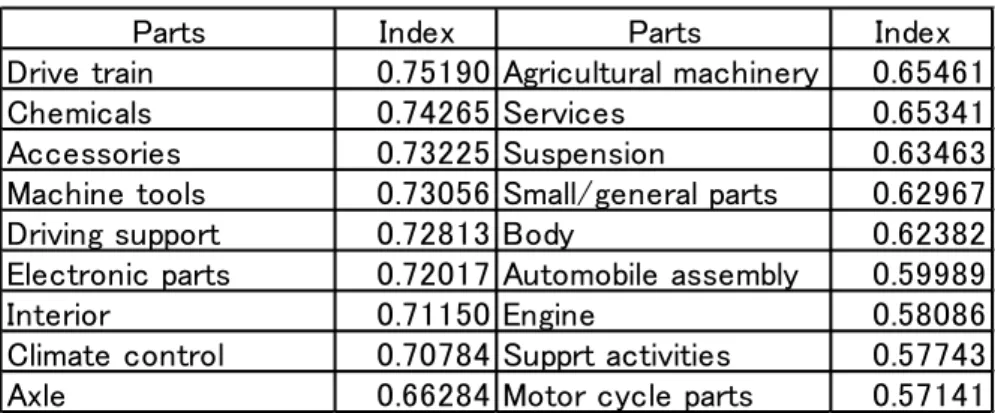
Table 1 shows that, as discussed in Section 5.2.1, all parts categories are
significantly localized, and the highest localization is exhibited by drive trains (Γ� =
0.75). Moreover, all other parts categories have very high index figures, exceeding 0.57.
Therefore, it can be concluded that automobile firms are strongly localized, regardless of
the parts category, when the spatial distribution of all manufacturing establishments is
used as a benchmark.
Table 1: Localization Index Γ�
Source: Calculated from the Thailand Automotive Industry Directory 2014.
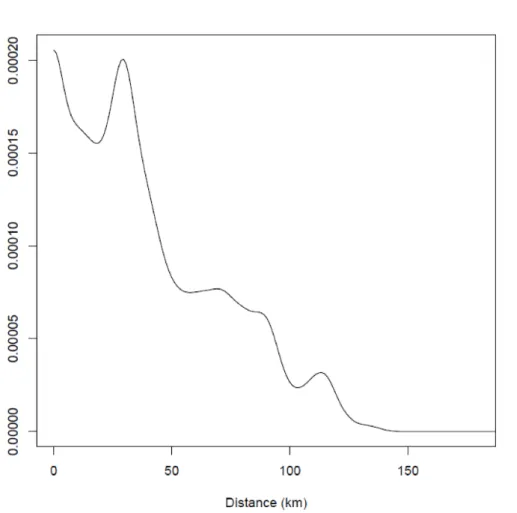
The second measure of localization is defined as follows: Γ(�) =∑ Γ� �(�) and
Ψ(�) =∑ Ψ� �(�) . These measures respectively indicate the extent of cross-industry
localization and dispersion at any given distance �. Figure 9 shows that, as in Duranton
and Overman (2005), the extent of localization is much greater over shorter than over
longer distances. Moreover, in terms of bilateral distances between firms, statistically
significant localization occurs only within 150 kilometers.
Parts Index Parts Index
Drive train 0.75190 Agricultural machinery 0.65461
Chemicals 0.74265 Services 0.65341
Accessories 0.73225 Suspension 0.63463
Machine tools 0.73056 Small/general parts 0.62967
Driving support 0.72813 Body 0.62382
Electronic parts 0.72017 Automobile assembly 0.59989
Interior 0.71150 Engine 0.58086
Climate control 0.70784 Supprt activities 0.57743
24
Figure 9: Index of localization by distance Γ(�)
Source: Calculated from the Thailand Automotive Industry Directory 2014.
5.2.3 Testing the localization of automobile firms (2)
In the previous section, hypothesis testing was conducted using the set of all the existing
sites occupied by the manufacturing establishments as a benchmark. However, it would
be more meaningful to sample the counterfactuals only from a set of the sites occupied
by the automotive-related firms and test the localization of automobile firms by the
category of parts. This test will show whether each category of automobile parts still
exhibits localization even after controlling for the overall localization tendency of the
25
As expected, the result indicates less localization. Only four categories of
parts―services, small/general parts, support activities, and machine tools―exhibit
localization.13 Table 2 shows the localization index Γ� of all the localized parts.
Services has by far the largest localization index, exceeding 0.06. For example, services
exhibit significant localization between 0 and 30kms, as shown in Figure 10. Note that
services tend to be concentrated in large cities like Bangkok, because service activities
have a greater potential for external economies in a metropolitan area and use less land
per employee (World Bank 2009).
Table 2 Localization index Γ�
Source: Calculated from the Thailand Automotive Industry Directory 2014.
13 It is already shown that industries belonging to the same branch tend to have a
similar localization pattern (Duranton and Overman 2005). It is thus
understandable that automotive parts indicate similar localization patterns, and only a few categories of parts deviate from randomness in the above test.
Parts Index
Services 0.06853
Small/general parts 0.00900
Support activities 0.00724
26
Figure 10: Hypothesis test on the localization of services (Benchmark: automobile
establishments)
Source: Calculated from the Thailand Automotive Industry Directory 2014.
On the other hand, only motorcycles indicate significant dispersion (see Table
3); the data show that the majority of motorcycle firms are located in Bangkok, Samut
Prakarn, Chonburi, Chachoengsao, and Rayong, but some are located far away, such as
27
Table 3 Dispersion index Ψ�
Source: Calculated from the Thailand Automotive Industry Directory 2014.
Moreover, the categories of parts and services that exhibit localization are all
general activities related to all parts and components, whereas none of the specific parts
and components―such as engine parts and drive trains―demonstrate significant
localization (Table 2). It should also be noted that only motorcycles indicates significant
dispersion, but its dispersion index is very small―less than 0.001 (Table 3).
5.2.4 Testing the co-localization of the parts suppliers
Some industries may locate closer to each other, and their clusters are located in the same
or nearby areas. This co-location of clusters occurs as a result of the location choice by
firms. For instance, co-location may occur because firms in different industries by chance
happen to be close to each other, or because the factors driving localization in different
industries share some similarity, which leads the firms to cluster together although there
is no interrelation between them.
Alternatively, this can occur if firms in an industry decide to locate close to firms
in an interrelated industry. For instance, such interrelated firms may have interactions,
such as input-output linkages, labor market pooling, or knowledge spillover across the
industry. Thus, these location patterns across industries are no longer independent.
Duranton and Overman (2005) respectively called the former two cases
“joint-localization” and the latter case “localization.” Obviously, of particular interest is
co-Parts Index
28
localization, because it is a reflection of the agglomeration economies that accrue across
different industries. Since our focus is placed on the co-localization of different parts
categories, we apply the following formula to estimate the kernel density distribution of
the bilateral distance between firms in two automotive parts categories:
��(�,�)(�) = � 1
���ℎ ∑ ∑ �(
�−���
ℎ ) ��
�=1 ��
�=1 ,
where bandwidth (ℎ) and kernel density function (�) are chosen as in Equation (1). �
and � are the automotive parts categories tested for co-localization, and �� and ��
are their respective numbers.
To conduct hypothesis testing on co-localization, Duranton and Overman (2005)
suggest that the counterfactuals should be sampled from a set of the sites occupied by
firms in either of the two automotive parts categories, that is, � ∪ �, because this allows
us to determine whether there are some interactions between parts categories � and �,
such that the parts suppliers in category �, for example, have a tendency to be closer to
the parts suppliers in category � than to the parts suppliers in the same category.
Table 4 shows that there are five pairs of parts categories that exhibit
co-localization. Table 5 shows three pairs of co-dispersion. The pair of support activities and
body parts indicates the strongest co-localization, followed by the pair of climate controls
and engines parts, and a pair of small/general parts and suspension/steering/wheels and
tires. In contrast, the pair of support activities and engines parts indicates the strongest
co-dispersion, but its co-dispersion index is very low.
29
Source: Calculated from the Thailand Automotive Industry Directory 2014.
Table 5: Pairs of co-dispersion
Source: Calculated from the Thailand Automotive Industry Directory 2014.
6. Conclusion
We analyzed the spatial distribution of the automotive-related firms in Thailand from
1960 to 2014. In the early stages, when the domestic market was small and the
infrastructure was not developed, firms tended to locate in the Bangkok metropolitan area.
Apart from the rationalization policies, basic infrastructure development was vital
to the success of industrialization. In the case of Thailand, the most important investment
was the Eastern Seaboard Project (ESB). On account of the continuity and streamlining
of the government policies and some international financial support through loans and
ODA, the eastern region became vibrant with manufacturing activities, and automotive
clusters emerged naturally in this region. Moreover, the Asian Financial Crisis was the
tipping point that increased the export orientation of the Thai automotive industry and
enhanced the location advantage of the eastern region.
Parts Parts Index
Support activities Body 0.00994
Climate control Engine 0.00781
Small/general parts Suspension 0.00604
Suspension Axle 0.00037
Electronic parts Suspension 0.00026
Parts Parts Index
Support activities Engine 0.00061
Body Drive train 0.00024
30
The development of a local supplier base and the formation of industrial clusters
are critically important for strengthening the competitiveness of industries such as
automobiles, where parts and components are heavy and bulky, and the just-in-time
system is introduced to reduce lead time for parts procurement. Based on our analysis,
we found that automotive-related firms are significantly localized, especially in the
Bangkok metropolitan area and the three eastern provinces—Chonburi, Chachoengsao,
and Rayong.
Next, we conducted hypothesis testing on the localization of automotive-related
firms. As expected, automobile firms as a whole are significantly localized, when the set
of all the existing sites occupied by the manufacturing establishments is used as a
benchmark. Similarly, all categories of automotive parts are localized, and statistically
significant localization occurs only within 150 kilometers in terms of the bilateral distance
between firms. In contrast, only four categories of automobile firms are significantly
localized after controlling for the overall localization tendency of the automotive-related
firms. Among them, services exhibits by far the strongest localization. On the other hand,
only motorcycles exhibit significant dispersion.
Hypothesis testing on the co-localization between the pairs of different parts
categories was conducted, and five pairs of parts categories are identified as being
31 References
Devereux, Michael P., Rachel Griffith, and Helen Simpson (2004), “The Geographic Distribution of Production Activity in the UK”, Regional Science and Urban Economics, 35 (5), 533-564.
Duraton, Gilles and Henry G. Overman (2005), “Testing for Localization Using Micro-Geographic Data” The Review of Economic Studies, vol.72, No. 4: 1077-106. Ellsion Gllen and Edward L. Glasser (1997), “Geographic Concentration in in US
Manufacturing Industries: A Dartboard Approach”, Journal of Political Economy, 105 (5) 889-927.
Fujita, Masahisa, Paul Krugman, and Anthony J Venables (1999), The Spatial Economy:
Cities, Regions, and International Trade. MIT Press: Cambridge. MA.
Krugman, Paul (1991), Geography and Trade. MIT Press: Cambridge. MA.
Kuroiwa, Ikuo and Kriengkrai Techakanont (2017), “Formation of Automotive Manufacturing Clusters in Thailand” ERIA Discussion Paper 2016-32. Lecler, Y. (2002), “The Cluster Role in the Development of the Thai Car Industry,”
International Journal of Urban and Regional Research. 26(4): 799-814. Marshall, Alfred, (1890), Principle of Economics, Macmillan: London.
Maurel, Francois and Beatrice Sedillot (1999), “A Measure of the Geographic Concentration of French Manufacturing Industries”, Regional Science and Unban Economics, 29 (5): 575-604.
Nakajima, Kentaro, Yukiko Saito, and Ichiro Uesugi (2010), Measuring Economic Localization: Evidence from Japanese firm-level data, RIETI Discussion Paper Series 10-E-030: The Research Institute of Economy, Trade, and Industry (RIETI).
Poapongsakorn, Nipon and Kriengkrai Techakanont (2008), “The Development of Automotive Industry Clusters and Production Network in Thailand”, pp. 196-256, in Production Networks and Industrial Clusters. Edited by Kuroiwa Ikuo and Toh Mun Heng, Singapore: ISEAS.
Silverman, B. W. (1986), Density Estimation for Statistics and Data Analysis, Chapman & Hall: London-New York.
Watanabe, Matsuo (2003). “Official Development Assistance as a Catalyst for Foreign Direct Investment and Industrial Agglomeration.” In External Factors for Asian Development. Edited by Hirohisa Kohama. Singapore: ISEAS