Analysis of Bank Stability and Profitability in the Eurasian Economic Union
オルガ, パク
http://hdl.handle.net/2324/2236331
出版情報:九州大学, 2018, 博士(経済学), 論文博士 バージョン:
権利関係:
DISSERTATION
ANALYSIS OF BANK STABILITY AND PROFITABILITY IN THE EURASIAN ECONOMIC UNION
Olga PAK
The Department of Economic Systems of the Graduate School of Economics
at Kyushu University Japan
2018
ii
AND PROFITABILITY IN THE EURASIAN ECONOMIC UNION” submitted in the partial fulfillment of the requirements for the degree of Doctor of Philosophy at Kyushu University, the Graduate School of Economics.
I declare that this thesis was composed by myself and that this work has not been submitted for any other degree or diploma at a university or other institution of higher education.
I declare that the thesis does not contain material previously published or written by a third party, except where this is appropriately cited through full and accurate referencing.
I declare that material covered in Section 1.3 of Chapter 1 and Chapter 3 has been previously published in Pak, O. (2018b). The Impact of State Ownership and Business Models on Bank Stability: Empirical Evidence from the Eurasian Economic Union. The Quarterly Review of Economics and Finance, forthcoming. The part of Appendix B related to Kazakhstan has been previously published in Pak, O. (2018a). Business Drivers of Bank Stability in Kazakhstan. Review of Integrative Business and Economics Research, Vol. 7, No. 1, pp. 1-15.
The doctoral thesis was supervised by Professor Kenji IWATA and co-supervised by Professor Yoichi KAWANAMI and Professor Masaki YAMAGUCHI. This research work was conducted under the PhD research fellowship funded by the Japanese Society for the Promotion of Science (JSPS).
Olga Pak
iii
This doctoral dissertation is devoted to my parents
Vladislav Pak and Svetlana Khvan
iv
was about to leave home. Suddenly, the phone rang. A man said: “Olga, this is Professor Yoichi Kawanami from Japan. You received a JSPS Ronpaku PhD scholarship…” After our brief conversation, I cried tears of joy…my dream had come true.
Professor Kawanami has become a special person in my life because he recognized my potential and believed in my abilities. Without Professor Kawanami’s faith, unwavering support, and invaluable advice this project would not have been possible.
I am equally grateful for the wonderful support of my supervisor Professor Kenji Iwata, for his professional guidance, constructive comments, and kind encouragement.
Despite his intense work schedule, he always found time to provide his thoughtful feedback and share his immense knowledge with me. Professor Iwata exposed me to the world of European studies, which tremendously expanded the area of my research interests.
I express my deepest gratitude to my co-supervisor Professor Masaki Yamaguchi for his great mentorship and teaching. Thanks to him, I learnt new econometric methods and conquered complex statistics. Professor Yamaguchi’s insightful suggestions on improvement of empirical analyses and advice for publication strategies were priceless and timely.
I am extending my sincere thanks to Meifen Chu for her steady support and true friendship during my stay in Japan. I would like to thank Eva Hanada for sharing her research works related to the EU. I gratefully acknowledge professional assistance of Kyushu University staff in handling my documents and providing all necessary facilities for my comfortable and effective study in Fukuoka.
I also thank my dear friends in Fukuoka (Jean, LeBonne, Harumi, Michie and Matsuoka) as well as my colleagues at KIMEP University (Sang Lee, Bibigul and Monowar) for their timely assistance and spiritual support.
Last but not least, I am most thankful to my amazing family. Without their resolute support, enduring patience and unconditional love, I would not have reached the finish
v
papers. Finally, I dedicate this work to my dear mother, Svetlana, and my late father, Vladislav, for their belief, support and ambition for me.
True blessing from God is true people around me.
vi
Acknowledgments ……… iv
Table of Contents ………. vi
List of Tables ……… ix
List of Figures ………... x
List of Abbreviations ………... xi
INTRODUCTION ………... 1
CHAPTER 1 Analysis of the Empirical and Regulatory Literature ……….…. 8
1.1 The concept of financial integration ……….... 8
1.1.1 Definition of financial integration ………. 8
1.1.2 Benefits of financial integration ……… 9
1.1.3 Costs of financial integration ………. 11
1.2 Development of financial integration in Europe .………. 13
1.3 Literature review on bank ownership, business models and stability ………….. 18
1.3.1 Overview of bank-level risk measures ………... 18
1.3.2 Bank ownership and stability ………. 22
1.3.3 Bank activities and financial stability ……… 23
1.3.3.1 Size, lending and growth ……….. 23
1.3.3.2 Non-traditional banking activities ………... 25
1.3.2.3 Wholesale short-term funding and capitalization ……… 25
1.3.4 Business determinants of bank funding stability ………... 27
1.4 Literature review on bank funding liquidity, systemic importance and profitability………... 27
1.4.1 Overview of bank profitability measures ……….. 27
1.4.2 Regulation of bank size and systemic importance ……… 29
1.4.3 Determinants of bank profitability ……… 34
1.4.3.1 The trade-off between bank funding liquidity, risk and profitability ……….. 34
1.4.3.2 Empirical literature on funding liquidity, risk and profitability of large banks ………... 36
1.4.3.3 Internal and external determinants of bank profitability ……….. 37
vii
Stability Indicators ……….. 42
2.1 Introduction ……….. 42
2.2 Structural changes in EAEU banking sectors relative to banks from CEE and Baltic States...………. 44
2.2.1 Capacity and growth ……….. 45
2.2.2 Concentration and ownership ……… 47
2.2.3 Likely effects of financial integration on EAEU banking sectors’ development ………... 54
2.3 Overview of the Basel III regulation on bank capitalization and liquidity …….. 56
2.4 Regulatory framework of EAEU banks ………... 59
2.4.1 Russian Federation ……… 61
2.4.2 Republic of Kazakhstan ………. 63
2.4.3 Republic of Belarus ………... 64
2.5 Stability assessment of EAEU banks relative to the banking sectors of CEE and Baltic States ..………. 66
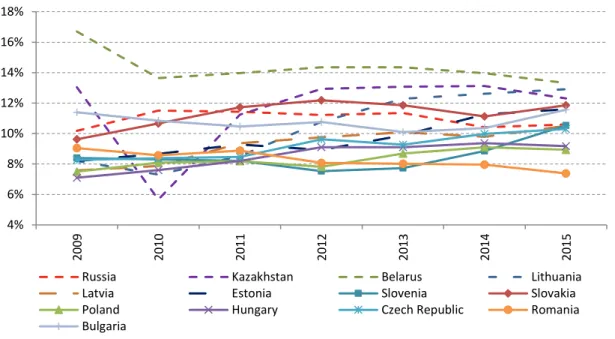
2.5.1 Profitability ……… 66
2.5.2 Credit risk ……….. 69
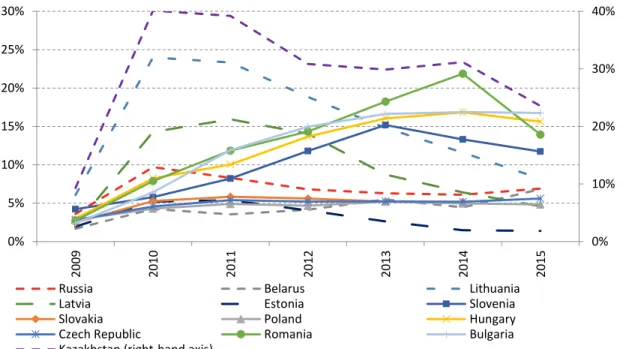
2.5.3 Capital adequacy ……… 72
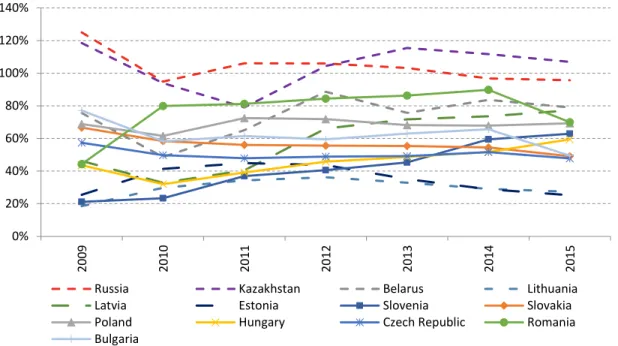
2.5.4 Funding liquidity risk ………. 75
2.5.5 Business models’ diversification ………... 77
2.6 Summary ……….. 78
CHAPTER 3 The Impact of State Ownership and Business Models on Bank Stability in the Eurasian Economic Union ……… 80
3.1 Introduction ……….. 80
3.2 Data and descriptive analysis ………... 82
3.2.1 Sample composition ………... 82
3.2.2 Measures of bank financial and funding stability ……….. 84
3.2.3 Descriptive analysis across bank ownership types and regions …………. 89
3.3 Model and methodology ……….. 92
3.4 Empirical results ……….. 96
3.4.1 Financial stability of EAEU banks by ownership type and region ……… 96
3.4.2 Funding stability of EAEU banks by ownership type and region ………. 99
3.5 Summary ……….. 105
viii
4.2 Data and descriptive analysis …... 109
4.2.1 Sample composition ………... 109
4.2.2 Profitability indicators ………... 110
4.2.3 Explanatory variables and hypotheses development ………. 113
4.2.3.1 The Net Stable Funding ratio ……… 113
4.2.3.2 Bank-specific determinants of profitability ………... 115
4.2.3.3 External determinants of profitability ………... 116
4.2.4 Descriptive statistics and correlation analysis ………... 118
4.3 Model and methodology ……….. 123
4.4 Empirical results ……….. 127
4.4.1 Results for the Net interest margin of EAEU banks ……….. 128
4.4.2 Results for the Return on assets of EAEU banks …... 130
4.5 Summary ……….. 134
CONCLUSION ……… 135
APPENDIX A Relationship between EAEU bank size and business variables 141 APPENDIX B Development of EAEU bank business models over time …... 145
B.1 Investment models from asset composition ……… 145
B.2 Funding models from liabilities and equity composition ……… 148
B.3 Business models from income composition ……… 151
REFERENCES ………. 154
ix
Table 1.2 Liquidity risk measures………... 20 Table 1.3 Comprehensive measures of bank risk-taking ………... 21 Table 1.4 Profitability measures……….. 28 Table 1.5 Assessment methodologies for identification of systemically important
banks………...
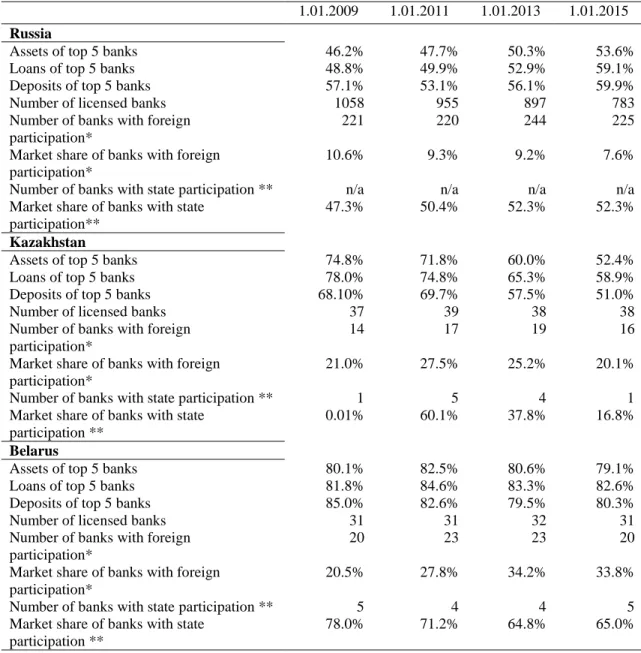
31 Table 1.6 The list of systemically important banks ……… 32 Table 1.7 Regulation of the NSFR ………. 33 Table 2.1 Market concentration and ownership of banks in the EAEU …………. 48 Table 2.2 EAEU banks’ compliance with Basel III regulation ………... 60 Table 3.1 The regional samples ……….. 83 Table 3.2 Weights for the NSFR calculated for EAEU banks ………... 87 Table 3.3 Means and medians of bank stability and business variables for the
full sample of EAEU banks, 2008-2016 ……… 90 Table 3.4 Means and medians of bank stability and business variables for the
regional samples of EAEU banks, 2008-2016 ………... 91 Table 3.5 Correlation between bank-specific variables of EAEU banks, 2008-
2016 ……… 92
Table 3.6 Durbin-Wu-Hausman endogeneity test for EAEU samples, 2008-2016 95 Table 3.7 Unit root test for EAEU bank-specific and macroeconomic
variables, 2008-2016 ……….. 96
Table 3.8 Business activities and financial stability of EAEU banks by
ownership type, 2008-2016 ……… 101
Table 3.9 Business activities and financial stability of the EAEU regional
samples, 2008-2016 ……… 102
Table 3.10 Business activities and funding stability of EAEU banks by ownership
type, 2008-2016 ……….. 103
Table 3.11 Business activities and funding stability of the EAEU regional
samples, 2008-2016 ……… 104
Table 4.1 The regional samples’ summary ……… 110 Table 4.2 List of explanatory variables and their expected effect on profitability 118 Table 4.3 Descriptive statistics for the full sample of EAEU banks, 2008-2017 ... 120 Table 4.4 Descriptive statistics for the regional samples of EAEU banks, 2008-
2017 ……… 121
Table 4.5 Correlation matrix for bank-specific variables of EAEU banks ……… 122 Table 4.6 Variance inflating factors for explanatory variables of EAEU banks … 124 Table 4.7 Durbin-Wu-Hausman specification test for endogeneity ………... 125 Table 4.8 Unit root test for bank-specific and external control variables, 2008-
2017 ……… 126
Table 4.9 Determinants of the Net interest margin of EAEU banks, 2008-2017 ... 132 Table 4.10 Determinants of the Return on assets of EAEU banks, 2008-2017 …... 133
x
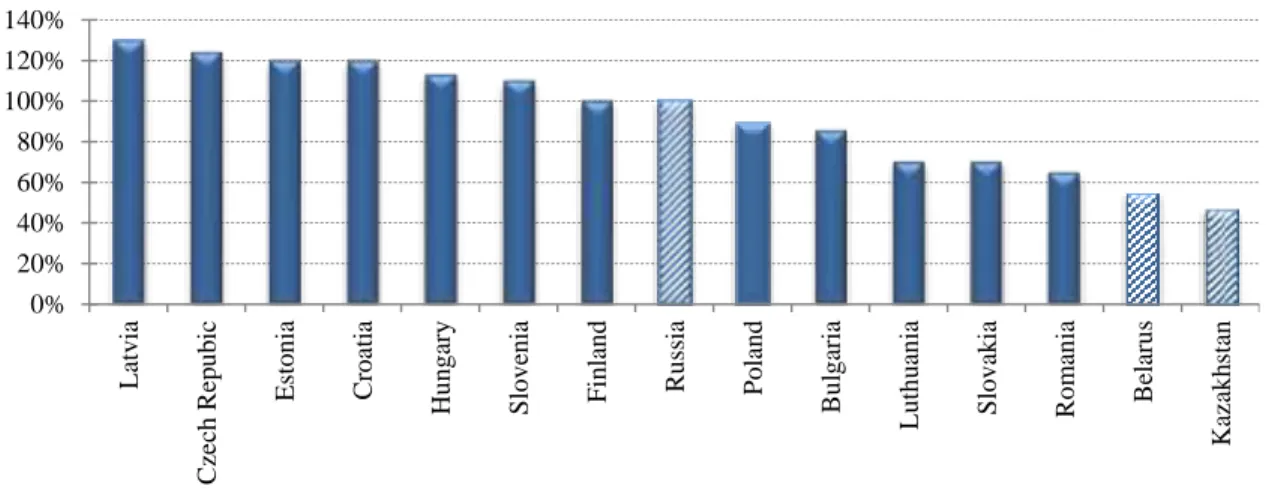
Figure 2.2 EAEU bank deposits, loans and assets to GDP as of 1.01.2015 …….. 46 Figure 2.3 CEE, Baltic and EAEU bank assets to GDP as of 1.01.2015 ………... 47 Figure 2.4 Assets of five largest banks out of total bank assets as of 1.01.2015 ... 52 Figure 2.5 Herfindahl-Hirschman Index as of 1.01.2015 ……….. 52 Figure 2.6 Assets of foreign subsidiaries and branches from total bank assets as
of 1.01.2015 ……….. 53
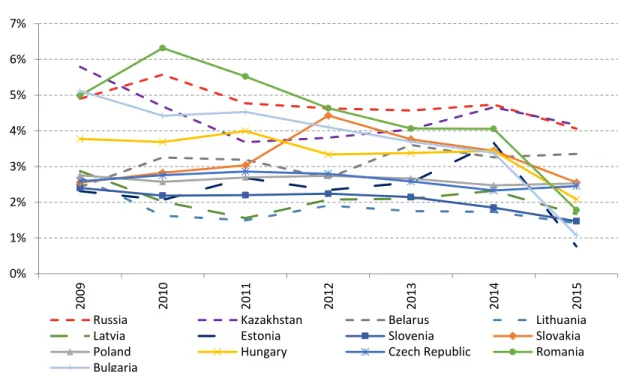
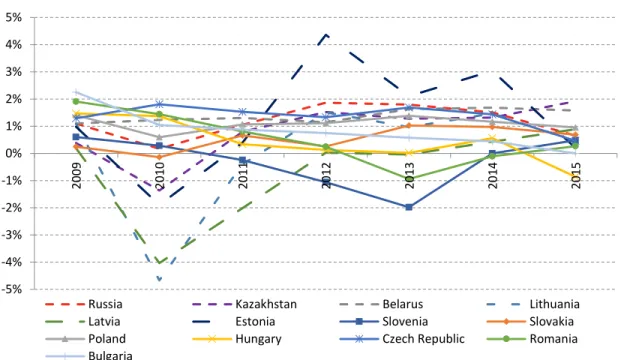
Figure 2.7 Assets of public banks out of total bank assets as of 1.01.2015 ……... 53 Figure 2.8 Net Interest margin of CEE, Baltic and EAEU banks, 2009-2015 …... 67 Figure 2.9 Return on assets of CEE, Baltic and EAEU banks, 2009-2015 ……… 68 Figure 2.10 NPLs ratio of CEE, Baltic and EAEU banks, 2009-2015 ……… 69 Figure 2.11 Coverage ratio of CEE, Baltic and EAEU banks, 2009-2015 ……….. 71 Figure 2.12 Equity to total assets of CEE, Baltic and EAEU banks, 2009-2015 …. 73 Figure 2.13 Total capitalization ratio of CEE, Baltic and EAEU banks, 2009-2015 74 Figure 2.14 Loan to deposit ratio of CEE, Baltic and EAEU banks, 2009-2015 …. 76 Figure 2.15 Non-interest income to total operating revenue of CEE, Baltic and
EAEU banks, 2009-2015 ……….. 78
Figure 3.1 Z-score of EAEU banks, 2008-2016 ……… 85 Figure 3.2 The Net Stable Funding Ratio of EAEU banks, 2008-2016 ………… 89 Figure 4.1 Profitability of Russian, Kazakhstani and Belarusian banks, 2008-
2017 ……….. 112
Figure 4.2 Profitability and the NSFR of SIBs and non-SIBs, 2008-2017 ……… 112 Figure 4.3 Strategies to increase the Net Stable Funding Ratio ………. 114 Figure 5.1 Russian banks’ size and bank activities, as of 1.01.2016 ………. 142 Figure 5.2 Kazakhstani banks’ size and bank activities, as of 1.01.2016 ……….. 143 Figure 5.3 Belarusian banks’ size and bank activities, as of 1.01.2016 …………. 144 Figure 5.4 Asset composition and growth rates of Russian banks, 2007-2016 …. 146 Figure 5.5 Asset composition and growth rates of Kazakhstani banks, 2007-
2016 ……….. 147
Figure 5.6 Asset composition and growth rates of Belarusian banks, 2007-2016 147 Figure 5.7 Funding composition and growth rates of Russian banks, 2007-2016 149 Figure 5.8 Funding composition and growth rates of Kazakhstani banks, 2007-
2016 ……….. 150
Figure 5.9 Funding composition and growth rates of Belarusian banks, 2007-
2016 ……….. 150
Figure 5.10 Revenue composition and growth rates of Russian banks, 2007- 2016 152 Figure 5.11 Revenue composition and growth rates of Kazakhstani banks, 2007-
2016 ……….. 153
Figure 5.12 Revenue composition and growth rates of Belarusian banks, 2007 –
2016 ……….. 153
xi BHC Bank Holding Company
BCBS Basel Committee on Banking Supervision BIS Bank of International Settlement
CBR Central Bank of Russia
CEE Central and Eastern European countries CET 1 Common Equity Tier 1
CRD IV Capital Requirements Directive IV CRR Capital Requirements Regulation
DGMM Dynamic GMM (Arellano and Bond, 1991) DGSD Deposit Guarantee Scheme Directive EAEU Eurasian Economic Union
ECB European Central Bank
EDIS European Deposit Insurance Scheme EC European Commission
EEC European Economic Community EMU European and Monetary Union
EU European Union
FDIs Foreign Direct Investments FSAP Financial Services Action Plan GDP Gross Domestic Product GFC Global Financial Crisis
GMM Generalized Method of Moments HHI Herfindahl-Hirschman Index
ICAAP Internal Capital Adequacy Assessment Process IFRS International Financial Reporting Standards ILAAP Internal Liquidity Adequacy Assessment Process IMA Internal Measurement Approach
IQR Interquartile Range
IRBA Internal Rating-Based Approach LLPs Loan Loss Provisions
LLRs Loan Loss Reserves LCR Liquidity Coverage Ratio LTD Loan to Deposit
M&As Mergers and Acquisitions NBK National Bank of Kazakhstan
NBRB National Bank of the Republic of Belarus NIM Net Interest Margin
Non-II Non-Interest Income NPLs Non-Performing Loans NSFR Net Stable Funding Ratio PP Phillips-Perron test
xii RWAs Risk-Weighted Assets
SA Standardized Approach
SGMM System GMM (Arellano and Bover, 1995; Blundell and Bond, 1998) SIBs Systemically Important Banks
SMP Single Market Program
SPER Supervisory Review and Evaluation Process SRM Single Resolution Mechanism
SSM Single Supervisory Mechanism TCR Total Capitalization Ratio TOR Total Operating Revenue
1
INTRODUCTION
The global financial crisis initiated a new wave of integration processes around the world as countries strove to strengthen their economies through shared resources and assets. The Eurasian Economic Union (EAEU) emerged from the Custom Union of the Russian Federation, the Republic of Kazakhstan and the Republic of Belarus.1 The Treaty on the EAEU (the Treaty) was signed on 29 May 2014 in Astana, Kazakhstan, by the presidents of the three founding states and came in force on 1 January 2015. The Republic of Armenia and the Kyrgyz Republic became full-fledged members of the EAEU on 2 January 2015 and on 12 August 2015 respectively.
This thesis analyzes a specific aspect of this economic integration – the formation of the single market for financial services in the EAEU by 2025.
Independent Russian, Kazakhstani and Belarusian banking systems arose from the collapse of the Soviet Union in December 1991. They have gone through massive post-soviet structural reforms, transitioning from a stated-owned mono banking structure to a two-tier banking system comprised of a central bank and commercial credit institutions. The establishment of the EAEU has initiated a new era of transition to integrated regional markets. However, in the aftermath of the financial crisis, adverse oil price dynamics and new sanctions imposed on Russia, Eurasian regional economies have experienced a downturn. It is expected that the economic and financial integration will release the regional economies’ potential and contribute to their development. The EAEU project, however, depends on many factors. One of the critical prerequisites for successful economic integration of EAEU member states is financial stability at both the country and regional levels.2 Therefore, this research work aims to provide a comprehensive assessment of EAEU banking sectors’ stability prior to the integration and pursues the following three objectives:
1 The Eurasian Custom Union of Russia, Kazakhstan and Belarus came in force on 1 January 2010 with the aim to remove trade barriers and facilitate trading among member states.
2 The definition of financial stability in this research work is narrowed to banking stability.
2
1. It compares banking sectors’ structures, regulatory frameworks and key stability indicators of Russia, Kazakhstan and Belarus (the post-soviet countries at early stage of integration) for identification of discrepancies that may hinder the creation of a common market for financial services. The banking sectors of the Central and Eastern European and Baltic States (the post-soviet countries at late stage of integration) and the European regulatory framework are used as a benchmark to draw inferences on banking development in the EAEU through the integration. The assessment of key stability indicators helps reveal risks accumulated by each EAEU banking sector before the integration processes began. These risks should be urgently addressed by national regulators prior to financial integration in order to prevent their dissemination in other member states.
2. It aims to fulfill the gap in the empirical literature on emergent markets. First, the banking sectors of EAEU founding states mainly consist of unlisted credit institutions, whereas most prior studies from developed countries use samples of listed banks or international samples of large banks. This may significantly influence the empirical results. Second, there is no consensus in the empirical literature on the impact of business models on banking stability and profitability. It is indicated that the effect depends on some initial conditions such as a level of bank capitalization, bank size or business focus. Therefore, the findings from advanced countries can not be directly generalized for economies in transition since they operate under different institutional settings, regulations and economic environments.
3. It contributes to the design of effective banking regulation in the EAEU. The implementation of Basel III liquidity requirements inevitably leads to balance sheets’
reshaping, which in turn may adversely affect bank profitability and financial strength.
This is the first study that calculates the Net Stable Funding Ratio (NSFR) for EAEU banks using public bank data. The analysis of the Basel III NSFR, its business determinants and the effect of the NSFR on bank profitability is quite new even for advanced economies. The research work also contributes to a scarce scope of studies on systemically important financial institutions. There is no comparative analysis on regulation of systemically important banks in the EAEU. Moreover, there is no
3
research work that directly measures the effect of systemic importance on bank profitability.
The vast scope of research highlights the importance of financial integration for financial development and economic growth.3 Giannetti et al. (2002), Volz (2004), Jappelli and Pagano (2008) outline several major channels, through which financial integration facilitates financial development in the EU. Financial integration increases the depth, liquidity and transparency of financial markets, which allow a better diversification of risks and a wider choice of financial products including ownership of assets across borders. The increased competitive pressure from more technologically advanced foreign banks reduces the cost of financial intermediation in countries with less developed financial systems and stimulates financial innovations. Financial integration also improves comparability and reliability of financial services between member states through harmonization and enforcement of domestic regulations according to best practices. This, in turn, positively contributes to their financial development. Monti (2010) notes that the creation of a single capital market and a single market for financial services are crucial drivers of the EU economic development and stability. The Five Presidents’
report (2015) outlines three stages towards a genuine European Economic and Monetary Union. The foremost step requires completing the Financial Union comprising the Banking Union and the Capital Markets Union.4
The European Union (EU) continues to remain the leading model of the flexible multi-tier economic integration that includes the EU single market and the Eurozone single currency. The EU’s successes and challenges throughout its evolution suggest important lessons for all other economic alliances regardless of differences in their economic and/or political settings (Cameron, 2010). The EU experiment has shown that
3 See London Economics (2002), Giannetti et al., (2002), Jappelli and Pagano (2008) for the surveys of studies on financial integration, financial development and economic growth.
4 The Banking Union is a new regulatory and supervisory system of the EU area banks (and other future members) executed at micro and macro levels under a single rulebook. The single rulebook ensures that legal and administrative rules are applied consistently across all EU countries. The Capital Markets Union aims to deepen the financial integration by developing capital investments and complementing bank financing with more diversified funding sources.
4
an intensive economic integration, not accompanied with corresponding strengthening of the EU financial system and regulation, eventually led to fragility of many European credit institutions. In response, the Basel Committee on Banking Supervision (BCBS) introduced new post-crisis capitalization and liquidity standards to enhance resilience of banks and banking systems. This thesis refers to BCBS Basel III regulatory framework, which remains the only valid benchmark for measuring developments in the EAEU banking regulations. Indeed, Annex 17 (Article 22) to the Treaty states that “In the banking sector, the Member States shall harmonize requirements for the regulation of and supervision over credit institutions guided by international best practices and the Core Principles for Effective Banking Supervision of the Basel Committee on Banking Supervision”.
The thesis structure and major findings are presented next. Chapter 1 reviews the empirical and regulatory literature related to several complement areas of research. First scope of the literature defines financial integration and discusses its benefits and costs for economic development. The brief review of financial integration in Europe provides insight into its historical background and ongoing integration processes as well drawing important lessons from the EU experience. Since the stability of the financial sector is a critical condition for future success in financial and economic integration, the second scope of the literature reviews the most common measures of bank risk-taking.5 This is followed by discussion of the research works that have studied the relationship between bank business choices and selected stability indicators. The third scope of the literature analyzes profitability as an important metric of bank stability. The relationship between bank profitability, funding liquidity, systemic importance and other internal and external factors are discussed next. The chapter concludes with presenting major gaps in empirical and regulatory research in the context of emerging EAEU economies.
Chapter 2 examines the banking sectors of Russia, Kazakhstan and Belarus in order to understand preliminary conditions on which a single financial market will be based. The practical contributions are derived from the following three dimensions. First,
5 In this research work, bank risk-taking is used as an inverse term for bank stability.
5
the comparison of EAEU banking sectors’ structures prior to integration reveals a low level of foreign ownership and the dominance of state-controlled banks. Although CEE and Baltic banking sectors shared similar features during their first years of sovereignty, they have changed dramatically through the integration processes with the EU. In particular, current CEE and Baltic States are characterized by the greater presence of foreign banks (except for Slovenia and Latvia), a low level of public ownership (except for Slovenia) and above average competition (except for Estonia and Lithuania). Within the EAEU, significant heterogeneity of banking sectors is still observed in terms of capacity, ownership and concentration. This thesis posits that the removal of cross-border barriers for financial services will reinforce Russian banks’ power in the smaller EAEU countries. Harsh cross-border competition will lead to a decrease in a market share of state banks and facilitate further consolidation of the banking sectors; however, it may also harm the stability of some financial institutions. Second, the enhancement and harmonization of banking regulations and supervisory practices are critical starting points for moving to a single market for financial services. This thesis reports that the degree of legislative conversions in the banking sectors of member countries remains weak. Russian banks’ regulation is more advanced and compliant with Basel III capitalization and liquidity standards. Kazakhstani and Belarusian banks’ regulations are still behind in terms of advanced risk management and mitigation tools, supervisory oversight, and information disclosure recommended by Basel III. Third, the analysis of the key stability indicators reveals national imbalances in accumulated bank risks: Belarusian banks operate at the lowest net interest margin; Russian banks are exposed to a greater structural liquidity risk; whereas Kazakhstani banks report sizable credit losses. Unless the regulation is strengthened and appropriate prudential tools to control bank risks are properly set, financial integration may facilitate a spillover of risks across national borders and threaten financial stability of the EAEU.
Chapter 3 conducts an empirical investigation of banking stability in the EAEU founding states. The recent financial crisis clearly showed that banks failed due to two major problems: capital inadequacy against asset risks and improper liquidity management. We analyze the effect of ownership and business models on financial and
6
funding stability of banks in the EAEU. The Z-score serves as a proxy for bank financial stability, whereas the Basel III NSFR is a measure of bank funding stability. The analysis is performed separately for state, foreign and private banks and at both the country and regional levels. The fixed and random panel data methodology and the Generalized Method of Moments with a fixed effect are applied to analyze the data. State ownership is concluded to be strongly associated with a lower likelihood of bank defaults and mitigates the destabilizing effect of sanctions. The impact of sanctions on state and foreign banks is not material, whereas private banks experience negative impacts of sanctions on their financial stability. It appears that sanctions undermined public trust in private banks and triggered an outflow of deposits to “safer” state-owned credit institutions. In terms of business models, bank financial stability deteriorates with larger size and lending growth but improves with greater short-term borrowing and capitalization. Evidence is also provided that the funding stability of EAEU banks does not depend on state ownership.
Moreover, the funding liquidity of the Russian and Belarusian banks is negatively affected by sanctions, whereas there is no effect of sanctions on Kazakhstani banks’ NSFR.
Overall, enhanced capitalization and less reliance on short-term borrowing improve the weak structural liquidity of EAEU banks.
Chapter 4 expands the empirical analysis on the EAEU banking stability by introducing two additional research questions. First, we investigate whether the introduction of the NSFR affects profitability of EAEU banks. Profit persistence in a banking sector is a vital component of bank stability as weak profitability constrains bank growth through retained earnings, increases the cost of funding and shortens time for banks to use their capital to cover asset losses. Second, we explore whether the profitability of banks depends on their systemic importance. A variable of systemically important status is added to the full EAEU bank sample. The analysis is also performed across the subsamples of systemically important and non-systemically important banks.
Arellano and Bover (1995), Blundell and Bond (1998) dynamic system Generalized Method of Moments is used to analyze the data. This methodology is the most appropriate as it deals with several important econometrical issues arisen from the model and dataset.
The results report a strong degree of stability of the Net interest margin and a lack of
7
persistence in the Return on assets of EAEU banks. The findings confirm the critical role of traditional interest-generating activities for maintaining bank profitability and stability in the region. This chapter shows that implementation of the NSFR will negatively influence the interest margins of Eurasian banks. The absence of the effect for systemically important banks is explained by the fact that these banks have not to date adjusted their NSFRs to the required threshold. Moreover, the systemic status of EAEU banks is associated with poorer profitability in terms of interest margin, but it does not significantly influence Return on assets. The result suggests that systemically important banks should be subject to tighter capital and liquidity regulation as their profitability is not sustainable to support their operations. We also find that Western sanctions have adversely affected the Net interest margin of Russian banks and are not material with respect to Return on assets.
The conclusion emphasizes the contribution of this doctoral thesis to the empirical and regulatory research. It summarizes the new academic findings and suggests their possible implications for effective design of the banking regulation in the EAEU. The thesis closes by suggesting areas for future research.
8
CHAPTER 1 Analysis of Empirical and Regulatory Literature
1.1 The concept of financial integration
1.1.1 Definition of financial integration
The concept of financial integration relies on the law of one price. It implies that financial instruments with identical cash flows and risks should have the same prices regardless of the place of transaction. Similarly, the costs of financial intermediation should be identical irrespective of bank location. However, transaction costs and other market frictions distort the law of one price (Baele et al. 2004). London economics (2002, p. 12) broadly defines the financial integration as a process of “making formerly regionally separate financial markets work as a single integrated market,” where financial markets include equity market, bond market and the banking sector. Jappelli and Pagano (2008) point out several barriers for reaching a single market for financial services:
- Differences in currencies require a risk premium for financial instruments denominated in foreign currencies and induce additional transaction costs from currency conversion.
- Differences in taxes affect the after-tax cost of debt. Asymmetric tax treatment creates exogenous friction that affects valuation of debt instruments, which in turn, contribute to capital markets’ segmentation. Pirinsky and Wang (2011) confirm that the cost of financial intermediation (measured by underwriting fee and mutual fund expense ratios) significantly higher at the segmented markets.
- Differences in financial markets’ operations (trading, settlement systems, and issuance policies) impede securities trading across national borders, inhibit arbitrage forces to restore the law of one price and limit diversification opportunities.
- Differences in regulation, enforcement and information disclosure deepen asymmetric information that constrain the flow of foreign investments in domestic financial markets, restrain financial institutions from competing across borders and create barriers for foreign banks’ entry.
9
Baele et al. (2004) provide the most comprehensive definition of financial integration. The authors state that the financial markets and services are fully integrated if three sets of characteristics are simultaneously applicable for market participants:
- Common rules are applied when market participants decide to deal with financial instruments and services. Full integration could be achieved in markets with heterogeneous financial structures if they are governed by a single set of principles.
- Equal access to financial instruments and services is granted regardless of the market participants’ region of origin. Full integration assumes nondiscriminatory flow of foreign investments and access to international borrowing, which require elimination of restrictions for cross-border operations.
- Fair treatment of all active market participants is ensured. Full integration can be achieved in the presence of frictions as long as these frictions affect market players symmetrically.
Jappelli and Pagano (2008) also highlight that under full integration a level of financial development should be measured by the size of the integrated area rather than a segmented financial market of an individual member state.
1.1.2 Benefits of financial integration
The vast scope of literature highlights the crucial importance of financial integration for financial development, which, in turn, facilitates economic growth (Bekaert et al. 2005). 6 The early work of Levin (1997) provides an evidence of a strong positive link between the measures of financial development and the indicators of economic growth using a sample from 77 countries (the author, however, restrains to conclude on causality of this relationship). London Economics (2002) states that the European financial integration brings substantial benefits for financial markets, consumers and corporates. First, financial integration increases market competition, which, in turn, lowers transaction costs and stimulates technological innovations. Second,
6 See London Economics (2002), Giannetti et al., (2002), Jappelli and Pagano (2008) for the surveys of studies on financial integration, financial development and economic growth.
10
financial integration increases depth, liquidity and transparency of financial markets, which allow for better diversification of risks through a wider choice of financial products (including ownership of assets across borders). Baele et al. (2004, p. 7) highlight three benefits of financial integration: more opportunities for risk sharing, more efficient asset allocation and a higher potential growth of an integrated economy. Baele et al. (2004, p.
10) also state that financial integration leads to changes in the existing financial structures and overall financial stability. For instance, more aggressive competition may harm sustainability of some financial intermediaries. Giannetti et al. (2002), Jappelli and Pagano (2008) outline two major channels, through which the financial integration facilitated financial development in the EMU. First channel is increased competitive pressure from more technologically advanced foreign banks. These banks are able to offer more efficient trading and settlement systems, and broader range of financial instruments. As a result, the cost of financial intermediation falls in countries with less developed financial systems, which facilitates the increased demand for financial services. The credit supply is also enhanced by cross – border loans from developed countries, which seek to maximize their net interest margin. Second channel is the required standardization and enforcement of domestic regulations according to best practices (e.g. International Financial Reporting Standards, corporate governance, securities laws, Basel capital standards etc.). It improves comparability, transparency and reliability of financial services between member states, which also contribute to their financial development.
Both channels should promote some convergence in the indicators of bank efficiency and overall financial development within the integrated area.
Several studies tried to quantify the potential effect of financial integration and financial development on economic growth. The Cecchini report (1988) first focuses on the benefits of financial integration of eight EU member states and reports the increase in the value – added by 0.7% of GDP.7 London Economics (2002) analyzes the impact of European financial integration on cost of equity and bond financing. It was found that
7Commission of the European Communities. (1988). Europe 1992: The Overall Challenge. The Cecchini report, April 13.
11
equity trading, clearing, settlement costs and credit spread for corporate bonds significantly decreased in the EU through greater depth and liquidity of financial markets resulted from the integration. This, in turn, reduced the average cost of equity capital and the cost of debt by around 0.5% and 0.4% respectively. The simulation of a macroeconomic impact of integration using combined effects of equity and bond financing resulted in 1.1% increase in real GDP, 6% greater business investments, 0.8%
increase in consumption and 0.5% higher employment rate in the EU. Giannetti et al.
(2002) provide empirical evidence that under the assumption of the similar access to finance for the US corporations, the financial integration contributes between 0.75% - 0.94% to annual growth of the manufacturing industry in Europe. The authors also point out that countries with less developed financial systems generate greater benefits from the integration processes.
1.1.3 Costs of financial integration
Apart from significant potential benefits, financial integration may have harmful side effects such as increased speculation with capital and likelihood of financial crisis (Pirinski and Wang, 2011). Agénor and Montiel (2015),Stavarek et al. (2011) point out the following dangers that may stem from the financial integration if certain conditions are not met:
- Loss of macroeconomic stability. Large foreign capital inflows may cause inflationary pressures and growing current account deficit. The persistent deficit induces the domestic currency depreciation, which may eventually lead to readjustment of relative prices and self-corrective movements in capital flows under the floating foreign exchange rate system. In the fixed exchange rate regime, the loss of competitiveness may undermine economic growth and increase the likelihood of currency crisis and financial instability. In both cases, large spillover effect exists due to increased interdependence of economies.
- Concentration and misallocation of capital flows. There is a tendency of capital inflows' concentration in several recipient countries, whereas some small developing economies are ignored at capital markets in spite of their openness. Boyd and Smith
12
(1992), Edison et al. (2002) state that the major reason is poor development of financial and legal systems, which may also cause capital outflows from those countries in favor of economies with stronger financial institutions. Moreover, concentration of domestic investments in speculative and low-productivity businesses may undermine the capacity for economic growth in the long run.
- Pro-cyclicality and volatility of capital flows. The business cycle expansion attracts significant capital inflows, stimulates spending and consumption. The effect, however, is reversed during economic downturns. Pro-cyclical behavior of short- term capital flows contributes to macroeconomic instability and is associated with two major reasons. First, developing economies are subject to greater business cycle volatility due to their lower productivity and high dependence on commodity prices.
Second, lack of market transparency increases asymmetric information problems and triggers the capital withdrawal in response to adverse economic shocks.
Accessibility of foreign capital increases the leverage and liquidity risk of a financial system. As a consequence, high level of short-term borrowing combined with pro- cyclical nature of capital flows may lead to systemic financial crisis.
- Risk of foreign banks’ entry. Firstly, foreign banks tend to concentrate their lending on the most credible and large corporates and disregard small and medium firms and households. Voltz (2004) states that the development of small and medium enterprises is constrained in the foreign-dominating banking systems, which becomes a cost of financial integration for those economies. Secondly, foreign banks mainly operate at lower costs, which increase competitive pressure on domestic credit institutions. As a result, the excessive bank consolidation may distort the competition and lead to creation of systematically important banks that are “too big to fail”. Thirdly, increase in foreign banks’ market share does not contribute to stability of the domestic banking system. The effect is either neutral or downside as they easily cut their businesses during the crisis periods.
13
1.2 Development of financial integration in Europe
The financial integration in Europe started from the Treaty establishing the European Economic Community (EEC) signed on 25 May 1957 in Rome (Treaty of Rome) by Belgium, France, Italy, Luxemburg, the Federal Republic of Germany and the Netherlands. The Treaty of Rome was put in force on 1 January 1958 and already contained the basic principles of financial integration through free movements of capital within the six founding countries.8 The Single Market Review (1997, Volume 3) of the European Commission provides general characteristics of the member countries’ banking systems prior to 1986. It describes that the credit institutions were operated at high degree of state influence and unequal regulatory regimes. For example, the restrictions on interest rates and capital control existed in Belgium, France, West Germany, Portugal and Spain.
Restrictions on branching and cross-border operations were widespread in France, Italy and Portugal. Foreign banks’ entry and engagement in non-banking financial activities were prohibited in some countries. Moreover, an excessive and diverse regulatory treatment undermined the competition at both domestic and cross-border markets.
Portugal, Greece, Belgium and Spain were considered as the most regulated among other member states. Some countries, however, liberalized their banking systems prior to the implementation of the Single European Act in February 1986.9
On 14 June 1985, the Commission of the European Communities issued a “White paper” on completing the internal market and emphasized the importance of formation of a common market in services for the future prosperity of Europe. The proposal was justified by the fact that by 1982, the services’ market was accountable for majority of job places and contributed significant value added to the European economy (see pages 28- 29 of the White paper). With respect to financial integration, the White paper (1985)
8Denmark, Ireland and the United Kingdom joined the EEC on 1 January 1973; Greece – on 1 January 1981; Portugal and Spain – on 1 January 1986; Austria, Finland and Sweden – on 1 January 1995.
9 The UK liberalized capital movements in 1979; West Germany and the Netherlands released interest rates’
control in 1981.
The Single European Act (SEA) signed on 17 February 1986 was the first substantial change to the Treaty of Rome. The major aim of the SEA was the creation of the single market in the European Community by 1992.
14
proposed to remove cross-border barriers and controls to ensure free flow of capital within the member states. The same year, the launch of the Single Market Program (SMP) facilitated the minimum harmonization of the financial regulation and supervision that was an essential condition for liberalization of financial services within the Community.
The financial institutions started operating at the “single financial passport” that allowed for the mutual recognition of licenses in member states. However, the control over cross- border financial institutions was carried out by its home country. Another important step for successful financial integration in EEC was the adoption of the similar standards for measuring a banks’ financial stability, like capital adequacy, and its management principles.
The Single Market Review (1997) reports that the implementation of the SMP resulted in decrease of the number of banks, increase in domestic banks’ mergers and acquisitions, and greater banking sectors’ concentration nearly in all member states.
Increase in cross-border competition and cross-border branches stimulated the technological developments and innovations in the financial industry. The Single Market Review (1997) provides evidence that deposit and loan prices of member states exhibited some degree of convergence post-SMP period. As a consequence of more competitive environment, the banks’ net interest margin declined (the decrease was greater in high margin countries). However, banks were able to improve their profitability by engaging in non-interest generating activities that expanded rapidly due to application of the universal banking model.10 SMP resulted in decrease in cross-border costs of supplying financial services, although the changes in cost income ratio were not apparent.
The next important stage of the European financial integration was the Treaty on the European Union in the Dutch city of Maastricht (Treaty of Maastricht) signed on 7 February 1992 by twelve countries: Belgium, Denmark, France, Germany, Greece, Ireland, Italy, Luxembourg, the Netherlands, Portugal, Spain and the United Kingdom.
The Treaty came into force on 1 November 1993. Apart of creation of the European
10 Universal banking was introduced into the legislation under the EU’s Second Banking Directive.
Universal banking is broadly defined as banking activities that include corporate, wholesale, and retail banking, investment banking, securities and insurance businesses.
15
citizenship and closer cooperation among the member states on various policies, the Maastricht Treaty approved three stages for completing the launched European and Monetary Union (EMU).11 The final stage included an introduction of Euro as a single currency of the European Union effective on 1 January 1999. It was a giant leap towards deepening of the financial integration in Europe through elimination of the foreign exchange risks, increased price transparency, reduced transaction costs, and improved cross-border competition. However, other barriers still impeded the full financial integration. In 1999, the Financial Services Action Plan (FSAP) became the major priority for the EU member states toward the harmonization of the legal environments, financial infrastructure, regulatory standards and procedures. According to the Green paper on financial services policy 2005-2010 issued on 3 May 2005 for public consultation, the most of objectives of the FSAP were met and put in practice. The White paper on financial services policy was published on 1 December 2005 and set the final priorities and strategies for the European financial sector’s development over the next 5 years.
Leibscher et al. (2006) report that significant financial integration has been achieved at the money market and government bonds’ market since the introduction of Euro in 2002. Elimination of the foreign exchange risk also created a crucial condition for the development of the pan-European corporate bond market that witnessed significant growth after 1999. However, equity, mortgage and retail lending markets maintained high level of fragmentation. The European banking sector experienced active expansion through cross-border activities that mainly took the forms of cross-border branching, securities trading and interbank loans. The volume of cross-border corporate and retail financing within the old EU members, however, remained weak (Jappelli and Pagano, 2008).
The accession of three Baltic States, five Central and Eastern European countries, Cyprus and Malta on 1 May 2004 and two South European states on 1 January 2007 in the EU created the room for further cross-border expansion of financial services and
11 The first stage introduced the free movement of capital between member states (1990 -1993); the second stage focused on increased cooperation between national central banks and convergence of economic policies, and the establishment of the European Central Bank (1994 – 1998).
16
capital markets.12 By the time of accession, the new member states lagged much behind the old member states by their economic, financial and technological developments. The European Commission’s report on the level of integration of East and West in the European Union (2014) highlights that the income gap between the old and new EU members reduced during 1995-2007 period, but still remained significant. Increase in trade openness and huge flow of foreign direct investments from more developed economies facilitated high economic growth of the CEEC-10.13 The gap in innovations between the old and new EU member states was even greater than the income gap.
Therefore, the import of knowledge and technologies by the CEEC-10 was crucial for increase of their international competitiveness. Baltzer et al. (2008) used the measures of financial integration suggested by Baele et al. (2004) for the analysis of financial integration between the old and new EU member states. The authors report strong evidence of ongoing integration processes especially in the money and banking markets since the time of new EU states’ accession. Government bond markets experienced strong development. However, only largest economies (Czech Republic, Poland and Hungary) showed signs of integration. Equity market of the EU’s new member states remained highly segmented.
The Global financial crisis (2007 - 2010) followed by the Eurozone sovereign debt and banking crises (2010 - 2016) slowed down the integration processes in Europe and contributed to greater fragmentation of the European financial markets (Degl’Innocenti et al., 2017). The negative effect, however, is temporal as the European financial markets have recovered and continue to develop even deeper framework of financial integration.
Monti report (2010) to the President of the European Commission examines the challenges that the EU faces at the current stage and proposes strategies to protect and relaunch the single market. Monti (2010, p.61) states that “the single market for capital and the closely
12 The Czech Republic, Estonia, Hungary, Latvia, Lithuania, Poland, the Slovak Republic, Slovenia, Cyprus and Malta joined the EU on 1 May 2004. Bulgaria and Romania became the EU members on 1 January 2007. CEEC-10 is assigned to this group of countries.
13 According to the EC report “25 years after the fall of the Iron Curtain: on the state of integration of East and West in the EU”, three quarters of total direct investments to CEEC-10 were supplied by the Netherlands, Germany and Austria. The largest FDIs recipients were Poland, Czech Republic and Hungary.
17
interrelated single market for financial services are critical for the efficient allocation of resources – a key driver of growth and employment – and for the financial stability of the economy”. He argues that intensive financial liberalization in Europe and the United States not accompanied by the subsequent enhancement of financial regulation and supervision was one of the major reasons of the financial crisis. De Larosiere Group’s Report (2009) provides detailed analysis of causes of the financial crisis and weaknesses of the existing financial regulation. It draws comprehensive set of recommendations for building sound regulatory and supervisory architecture across the EU single financial market.14 The Report states that full harmonization of the regulation and supervision is no longer an option, but a required condition for the future sustainability of the EMU.
Moreover, the introduction of a new risk-sharing mechanism for stabilizing the EMU during economic downturns is critical to break the vicious circle between banks and public finance.15
The Global financial and Eurozone debt crises initiated the new level of integration in the EU. The European Commission’s Five Presidents’ report (2015) clearly states that deeper economic, financial, fiscal and political integration is required to preserve the integrity of the EMU. The report outlines two major stages towards more resilient EMU to be completed by 2025. The foremost step in the current stage is the completion of the Financial Union comprised of the Banking Union and Capital Markets Union. The Banking Union is a new regulatory and supervisory system of EU area banks (and other future members) executed under a single rulebook. The Banking Union comprises of three pillars: Single Supervisory Mechanism (SSM), a Single Resolution Mechanism (SRM) and European Deposit Insurance Scheme (EDIS). Three pillars cover banks of the Banking Union’s participating countries.16 SSM ensures effective supervision of EU area credit institutions using Basel III capital requirements. SRM allows timely intervention of
14 European Commission. February 2009. The high-level group on financial supervision in the EU. The de Larosiere Group, Brussels.
15 The European Commission fact sheet. 24.11.2015, MEMO/15/6164
16 All Eurozone countries participate in the Banking Union automatically. Other EU member states may join the Banking Union; however, regardless of the current non-participating status, they are subject to the single rulebook’s directives.
18
a Single Resolution Board into a distress bank and provides recovery tools through a Single Resolution Fund. EDIS is still in the process of development and will gradually replace the harmonized Deposit Guarantee Scheme (DGS). Both SRM and EDIS will be fiscally neutral over time as they would be privately funded by participating banks. The European Commission’s White paper on the Future of Europe (March 2017) illustrates five possible scenarios of the EU development in the medium term. However, only two scenarios are able to reduce a gap between promised and delivered financial stability.17
1.3 Literature review on bank ownership, business models and stability
1.3.1 Overview of bank-level risk measures
The post-crisis banking regulatory framework strongly supports the adoption of more sophisticated internally developed risk models. Since the data from these models is not publicly available, the academic research widely relies on accounting risk measures (Delis et al., 2014) and market risk estimates derived from stock returns’ volatility (Leung et al., 2015). Individual or joint realization of bank risks undermines bank stability, which is a crucial condition for effective development of a real sector and successful economic (and financial) integration. This section reviews the measures of credit, liquidity and overall bank financial risks applied in the empirical literature for assessing an individual bank’s stability. The range of risks and their measures, however, is not limited to the current discussion.
Credit risk directly influences bank’s probability of survival as lending represents the major bank activity and accounts for the largest proportion of assets in banks with traditional business models. Table 1.1 presents the most widely used credit risk measures.
Non-performing loans (NPLs) is a bank loan, which interest or agreed installment has not been paid for 90 days or more.18 According to the BCBS Consultative document (2016,
17 See, Scenario 4 (Doing less more efficiently) and Scenario 5 (Doing much more together) in the White paper on the Future of Europe. European Commission. 1 March 2017. Brussels
18 NPLs also include all exposures that are “defaulted”, all exposures that are credit-impaired according to IFRS 9, and all exposures with evidence that full repayment is unlikely without the realization of collateral (regardless of the number of days the exposure is past-due).
19
p. 8), “Non-performing exposures should always be categorized for the whole exposure, including when non-performance relates to only a part of the exposure, for instance, unpaid interest”. Loan loss provisions (LLPs) represent an expense set aside from net income. LLPs aim to cover potential credit losses when loan quality deteriorates. Timely and adequate LLPs contribute to bank stability as they are able to mitigate credit risk early implying more sensitivity of risk recognition (Ozili and Outa, 2017). The major difference between Loan loss provisions and Loan loss reserves (LLRs) is that LLPs represent the periodic increment (the flow) in Loan loss reserves, whereas the LLRs represents an actually formed allowance for impairment (the stock) accumulated for several periods.
Risk-weighted assets are calculated as a weighted - average amount of on – balance sheet and off - balance sheet assets adjusted to credit risk (according to Basel I, Basel II or Basel III).19
Table 1.1 Credit risk measures
Risk measure Description Research papers
Loan loss provisions (reserves) to Total loans (or Total assets)
Higher level of loan loss provisions (reserves) reflects lower quality of loan portfolios.
Foos et al. (2010), Haq and Heaney (2012), Dietrich et al. (2014), Basegla- Pascual et al. (2015), Fahlenbrach et al.
(2016) Non-performing loans to
Total loans (or Total assets)
Higher level of non-
performing loans reflects the greater credit risk realization.
Agoraki et al. (2011), Leung et al.
(2015) Risk-weighted assets
adjusted to credit risk to Total assets
Higher ratio indicates the greater credit risk of bank assets.
Berger and Bowman (2013)
Financial crisis revealed that bank distress occurred not only due to insufficient capital adequacy relative to asset risks, but also due to inappropriate liquidity management. Funding liquidly risk arises when depositors or wholesale lenders withdraw their money at the same time forcing a bank to run out its liquid reserves. If amount raised from liquid assets is not sufficient to cover cash outflow, banks may fail even being sufficiently capitalized (Rantovski, 2013). Table 1.2 presents the summary of major
19 Basel II introduced finer calibration of credit risk and an option between a standardized and an internal risk-based approaches for risk measurement. Basel III introduced “through-the-cycles” loan loss provisioning system.
20
liquidity risk indicators used in the empirical literature. Loan to deposit ratio measures the proportion of loans funded by core deposits. The major disadvantage of the ratio is that it does not differentiate between short-term wholesale funding and long-term debt financing; the latter represents a stable source of funds as its duration is close to those of long-term assets. Ratio of Short- term funding to Liquid assets better explains the sources of funding liquidity risk as it shows the proportion of short-term obligations covered by short-term liquid assets (Imbierowicz and Rauch, 2014). If the ratio is greater than 1, it indicates high liquidity risk. Altunbas et al. (2011) measure liquidity risk by the amount of funding received from the European System of Central banks out of total bank assets.
Table 1.2 Liquidity risk measures
Risk measure Description Research papers
Loans to Deposits Indicator of bank funding liquidity risk if the ratio becomes greater than 1.
Lopez-Espinoza et al. (2013), DeYoung and Jang (2016) Short- term funding to Liquid
assets
Indicator of funding liquidity risk or inability to meet short-term obligations if the ratio is greater than1.
Imbierowicz and Rauch (2014)
A Central bank’s liquidity support = Refinancing from a Central bank / Total assets
Short-term and long-term refinancing from a Central Bank may signal liquidity problems.
Altunbas et al. (2011)
Liquidity Coverage Ratio (LCR) = High quality liquid assets / Net cash outflow
Indicates the proportion of highly liquid assets available to cover net cash outflow under a stress scenario lasted for 30 days.
The adequate ratio is 100%.
Hong et al. (2014)
Net Stable Funding Ratio (NSFR) = Available amount of stable funding/Required amount of stable funding
Indicates the proportion of illiquid assets that are financed with long - term stable liabilities.
The adequate ratio is 100%.
King (2013), Distinguin et al.
(2013), Dietrich et al. (2014), Vazques and Federico (2015), Bologna (2015), Mergaerts and Vennet (2016)
Post-crisis Basel III regulation introduced new measures for enhancing the existing liquidity rules, the Liquidity coverage ratio (LCR) and the Net Stable Funding ratio (NSFR), which intend to assess short-term and long-term liquidity risks respectively.
The LCR is not often used by researchers due to lack of available public data on cash flows within 30 days horizon. The NSFR, however, attracts increasing attention from the academic world and has already been tested from different perspectives for banks in