九州大学学術情報リポジトリ
Kyushu University Institutional Repository
Pulmonary arterial input impedance reflects the mechanical properties of pulmonary arterial
remodeling in rats with pulmonary hypertension
西川, 拓也
http://hdl.handle.net/2324/2236135
出版情報:九州大学, 2018, 博士(医学), 課程博士 バージョン:
権利関係:
Contents lists available atScienceDirect
Life Sciences
journal homepage:www.elsevier.com/locate/lifescie
Pulmonary arterial input impedance reflects the mechanical properties of pulmonary arterial remodeling in rats with pulmonary hypertension
Takuya Nishikawa
a,b,⁎, Keita Saku
c, Takuya Kishi
c, Takeshi Tohyama
a, Kohtaro Abe
a,
Yasuhiro Oga
a, Takahiro Arimura
a, Takafumi Sakamoto
a, Keimei Yoshida
a, Kenji Sunagawa
d, Hiroyuki Tsutsui
aaDepartment of Cardiovascular Medicine, Kyushu University Graduate School of Medical Sciences, Fukuoka, Japan
bDepartment of Cardiovascular Dynamics, National Cerebral and Cardiovascular Center, Suita, Japan
cDepartment of Advanced Risk Stratification for Cardiovascular Diseases, Center for Disruptive Cardiovascular Medicine, Kyushu University, Fukuoka, Japan
dDepartment of Therapeutic Regulation of Cardiovascular Homeostasis, Center for Disruptive Cardiovascular Medicine, Kyushu University, Fukuoka, Japan
A R T I C L E I N F O Keywords:
Pulmonary hypertension Input impedance
Pulmonary arterial compliance Hemodynamics
A B S T R A C T
Aims: Although pulmonary arterial remolding in pulmonary hypertension (PH) changes the mechanical prop- erties of the pulmonary artery, most clinical studies have focused on static mechanical properties (resistance), and dynamic mechanical properties (compliance) have not attracted much attention. As arterial compliance plays a significant role in determining afterload of the right ventricle, we evaluated how PH changes the dynamic mechanical properties of the pulmonary artery using high-resolution, wideband input impedance (ZPA). We then examined how changes in ZPAaccount for arterial remodeling. Clarification of the relationship between arterial remodeling and ZPAcould help evaluate arterial remodeling according to hemodynamics.
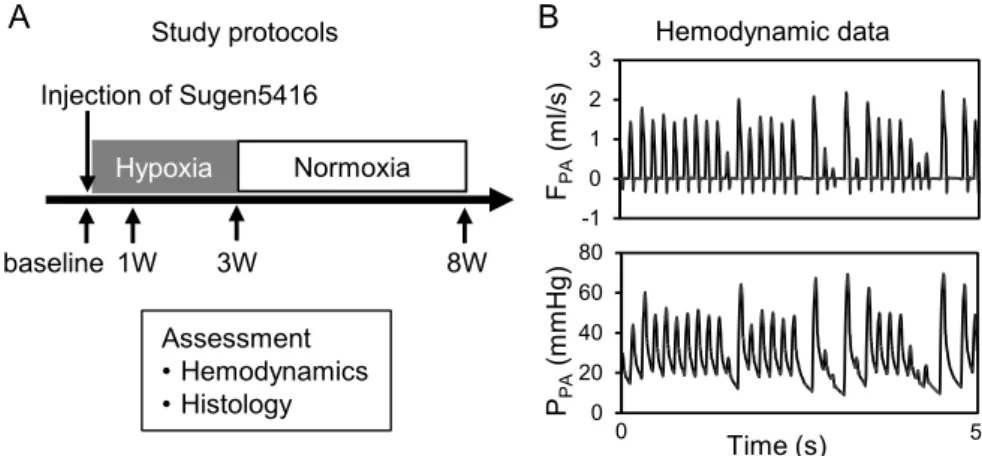
Main methods:PH was induced in Sprague–Dawley rats with an injection of Sugen5416 (20 mg/kg) and 3-week exposure to hypoxia (10% oxygen) (SuHx). ZPAwas evaluated from pulmonary artery pressure and flow under irregular pacing. Pulmonary histology was examined at baseline and 1, 3, and 8 weeks (n= 7, each) after Sugen5416 injection.
Key findings:SuHx progressively increased pulmonary arterial pressure. ZPAfindings indicated that SuHx pro- gressively increased resistance (baseline: 9.3 ± 3.6, SuHx1W: 20.7 ± 7.9, SuHx3W: 48.8 ± 6.9, SuHx8W:
62.9 ± 17.8 mm Hg/mL/s,p< 0.01) and decreased compliance (baseline: 11.9 ± 2.1, SuHx1W: 5.3 ± 1.7, SuHx3W: 2.1 ± 0.7, SuHx8W: 1.9 ± 0.6 × 10⁻³mL/mm Hg, p< 0.01). The time constant did not sig- nificantly change. The progressive reduction in compliance was closely associated with wall thickening of small pulmonary arteries.
Significance: The finding that changes in resistance were reciprocally associated with those in compliance in- dicates that resistant and compliant vessels are anatomically inseparable. The analysis of ZPAmight help evaluate arterial remodeling in PH according to hemodynamics.
1. Introduction
Pulmonary hypertension (PH) is a multifactorial complex pul- monary vascular disorder. Pulmonary arterial remodeling and func- tional vasoconstriction have been shown to increase pulmonary re- sistance and artery pressure and consequently cause life–threatening right ventricular (RV) failure and death [1,2]. Such structural and
functional alterations in pulmonary vasculature change its mechanical properties [3]. Therefore, detailed analyses of its mechanical properties would enable the identification of the severity of arterial remodeling.
However, most clinical studies have focused on static mechanical properties (resistance) without assessing dynamic mechanical proper- ties (compliance).
In the systemic arterial system, aortic input impedance, which is the
https://doi.org/10.1016/j.lfs.2018.10.005
Received 3 August 2018; Received in revised form 4 October 2018; Accepted 5 October 2018
Abbreviations:PH, pulmonary hypertension; RV, right ventricular; 3-WK, 3-element windkessel; ZPA, pulmonary arterial input impedance; SV, stroke volume; PP, pulse pressure; SuHx, Sugen/hypoxia; RVH, right ventricular hypertrophy; ODs, outer diameters; WT50, arteries with ODs < 50 μm; WT100, arteries with ODs 50–100 μm; PPA, Pulmonary artery pressure; FPA, Pulmonary artery flow
⁎Corresponding author at: Department of Cardiovascular Medicine, Kyushu University Graduate School of Medical Sciences, Kyushu University, 3-1-1 Maidashi, Higashi-ku, Fukuoka 812-8582, Japan.
E-mail address:[email protected](T. Nishikawa).
Available online 06 October 2018
0024-3205/ © 2018 The Authors. Published by Elsevier Inc. This is an open access article under the CC BY license (http://creativecommons.org/licenses/BY/4.0/).
T
ratio of arterial pressure to flow in the frequency domain, has been used to assess the dynamic mechanical properties of arterial vasculature [4,5]. Westerhof et al. [6] approximated systemic arterial input im- pedance using a 3-element windkessel (3-WK) (resistance, compliance, and characteristic impedance) model.
As the basic structure of the pulmonary arterial system resembles that of the systemic arterial system, many investigators have adopted the 3-WK model to approximate pulmonary arterial input impedance (ZPA) [7]. In the evaluation of PH, pulmonary arterial resistance reflects PH severity and predicts long-term outcome [8]. In contrast, com- pliance has been rarely assessed because its measurement is technically difficult and its relationship with pathophysiology remains un- established. Rosen et al. proposed a practical method to estimate compliance according to the ratio of stroke volume (SV) to pulse pressure (PP) [9]. However, SV/PP does not necessarily provide an accurate estimate of compliance, as changes in the pulmonary artery and/or RV condition, such as characteristic impedance and con- tractility, could affect PP [10]. Characteristic impedance is the ratio of magnitude of pressure and flow waves in an infinite transmission line. It is often measured from the input impedance using the average values of high frequency moduli [11,12]. However, it is controversial whether PH alters characteristic impedance [13–16], because the complexity of wave reflections in PH prevents precise assessment. The time constant of impedance manifests as a corner frequency. However, in the phy- siological condition, the corner frequency is lower than the heart rate frequency. Thus, the estimation of the time constant from ZPAunder a regular heart rate is imprecise. We believe that such technical diffi- culties make the clinical applications of pulmonary impedance im- practical.
As we focused on dynamic pulmonary vascular properties in this study, we used a Sugen/Hypoxia model of PH (SuHx) considering that its histological phenotype of pulmonary vascular remodeling is similar to that of PH in humans [17]. In the PH model rats, we assessed ZPAby using a random perturbation method [5]. This makes the impedance estimation wideband and high-resolution and allows precise estimation of the time constant below the heart rate frequency. Furthermore, to avoid inaccuracy resulting from complex wave reflections, we esti- mated characteristic impedance from the instantaneous pressure–flow relationship in the time domain before the reflected waves could in- fluence the relation. Using the determined characteristic impedance, we derived the remaining two parameters of the 3-WK model from the ZPA
and examined their relationships with pulmonary arterial remodeling.
2. Material and methods
2.1. Animal preparations and experimental protocols
The Committee on Ethics of Animal Experiments, Kyushu University Graduate School of Medical Sciences approved the experiments and animal care. The experiments were performed in strict accordance with the Guide for the Care and Use of Laboratory Animals published by the US National Institutes of Health.
The study included male Sprague–Dawley rats weighing 190–210 g.
The rats were subcutaneously injected with Sugen5416 (20 mg/kg;
Cayman Chemical, Ann Arbor, MI) and were exposed to hypoxia (10%
O2) for 3 weeks. They were returned to normoxia (21% O2) thereafter.
As shown in Fig. 1A, we assessed hemodynamics and histology at baseline (before the Sugen5416 injection) and 1, 3, and 8 weeks after the Sugen5416 injection (n= 7 in each period).
2.2. Preparation
All rats were anesthetized with an intraperitoneal injection (2 mL/
kg) of a mixture of α-chloralose (40 mg/mL) and urethane (250 mg/mL) and were mechanically ventilated with oxygen-enriched gas. A heating pad was used to maintain their body temperature at approximately
38 °C.
Left thoracotomy was performed, and pulmonary arterial pressure was measured with a catheter-tipped micromanometer (SPR-320;
Millar Instruments, Houston, TX) inserted into the pulmonary trunk.
Additionally, an ultrasonic flow probe (model 2PS; Transonic, Ithaca, NY) was placed at the pulmonary trunk to measure pulmonary artery flow. Moreover, a pair of stainless steel wire electrodes (Bioflex wire AS633; Cooner Wire, Chatsworth, CA) was attached to the left ventricle to pace the heart according to a computer-generated random binary sequence (2–10 Hz) (Fig. 1B).
2.3. Data acquisition
All hemodynamic time series were digitized at 1000 Hz (Power Lab 16/35; ADInstruments, NSW, Australia) and stored in a dedicated la- boratory computer system. We corrected the time delay of the flow measuring system (Supplement 1) to align pulmonary arterial pressure and flow.
2.4. Pulmonary arterial input impedance
We estimated high-resolution wideband pulmonary arterial input impedance from the time series of pulmonary arterial pressure and flow for 90.112 s under irregular cardiac pacing. The time series were seg- mented into 10 sets of 50% overlapping bins of 16,384 points each.
After detrending, pulmonary arterial pressure and flow were windowed with a 4-term Blackman–Harris window and were then Fourier trans- formed. The power spectra of pulmonary arterial pressure [|PPA(f)|2] and flow [|FPA(f)|2] and their crosspower spectra [PPA(f)·FPA⁎(f)] were calculated in each bin and then ensembled over the 10 segments.
Finally, we estimated the impedance [ZPA(f)] in the frequency range between 0.1 Hz and 100 Hz with a resolution of 0.061 Hz by the fol- lowing equation.
=
Z (f) P (f)·F (f)
|F (f)|
PA PA PA
PA 2
We also estimated the magnitude squared coherence [Coh(f)] which indicates the linear dependence of pulmonary arterial pressure and flow using the following equation:
=
Coh(f) |P (f)·F (f)|
|F (f)| ·|P (f)|
PA PA 2
PA 2 PA 2
where Coh(f) varies between 0 and 1.
2.5. Estimation of each element in the 3-WK model
We estimated each element in the 3-WK model (Fig. 2A). In most previous studies, characteristic impedance was determined by aver- aging the impedance moduli in the high-frequency range [16]. How- ever, unlike aortic input impedance, high-frequency impedance varies considerably particularly in PH, because of complex reflections in the pulmonary artery. These complex reflections make the estimation of characteristic impedance in the frequency domain imprecise. To avoid this limitation, we estimated characteristic impedance in the time do- main [18]. Briefly, characteristic impedance is defined by the ratio of forward pressure to forward flow. As the reflected waves do not con- taminate the upstroke phase of pulmonary arterial pressure and flow, consideration of the ratio of pulmonary arterial pressure to flow in the beginning of ejection should yield characteristic impedance. We as- sessed characteristic impedance by calculating the linear slope of the instantaneous pressure–flow relationship in the first 10 ms of ejection and obtaining the average value over 30 beats (Fig. 2B).
After determining characteristic impedance, we used its value, fit the 3-WK model to the measured high-resolution, wideband impedance at a frequency of up to 10 Hz, and determined resistance and com- pliance with the non-linear least-square method using the trust region
T. Nishikawa et al. Life Sciences 212 (2018) 225–232
226
reflective algorithm [19] (Matlab R2017b, MathWorks, Natick, MA;
time–frequency method) (Fig. 2C). The time constant was obtained by multiplying resistance with compliance.
2.6. Right ventricular hypertrophy
We excised the heart, dissected the right ventricle from the left ventricle and the septum, and weighed them separately. Right ven- tricular hypertrophy (RVH) was indexed by the weight ratio of the right ventricle to the left ventricle plus the septum [20].
2.7. Histological analysis
After hemodynamic measurements, we injected barium–gelatin at 70 °C into the pulmonary arteries while keeping the pressure at the individual mean pulmonary arterial pressure as previously reported [21]. All sections were stained with Verhoeff–van Gieson for histolo- gical analysis. We determined the external elastic lamina and vascular lumen. We then defined the circularity of the pulmonary artery by di- viding the measured total vascular area (the area circumscribed by the external elastic lamina) by the maximum area calculated from the perimeter length. Unity circularity indicates that the arterial cross section is a perfect circle. We examined barium-filled arteries with outer diameters (ODs) < 100 μm and circularity > 0.6. We calculated wall thickness using the following equation:
=
Wall thickness Total vascular area Vascular lumen area Total vasucular area
2.8. Statistical analysis
Data are presented as mean ± standard deviation. We used ANOVA with post-hoc Tukey-Kramer's test for multiple comparisons among the experimental groups. Additionally, we used ANCOVA for comparisons of the slopes of regression lines between wall thickness and hemody- namic parameters. All statistical analyses were performed using JMP version 11 (SAS Institute, Cary, NC). Differences were considered sig- nificant atp< 0.05.
3. Results
3.1. Changes in the mean pulmonary arterial pressure, flow, and RVH Body weight increased with time (baseline: 205 ± 5.9 g, SuHx1W:
217 ± 5.7 g, SuHx3W: 263 ± 7.3 g, SuHx8W: 365 ± 53.8 g, p< 0.01). As shown inFig. 3, the mean pulmonary arterial pressure progressively increased and tripled 8 weeks after the Sugen5416 in- jection (baseline: 19.5 ± 1.9 mm Hg, SuHx1W: 26.1 ± 3.1 mm Hg, SuHx3W: 45.6 ± 5.5 mm Hg, SuHx8W: 63.9 ± 13.4 mm Hg, p< 0.01;Fig. 3A). RVH was consistent with the progression of PH (Fig. 3C). However, irrespective of the increase in pulmonary arterial pressure, pulmonary arterial flow remained unchanged (Fig. 3B).
3.2. Alteration of pulmonary arterial input impedance in SuHx rats Fig. 4shows the high-resolution, wideband pulmonary arterial input impedance (ZPA) plotted on the logarithmic scale in moduli and Fig. 1.Experimental protocol (A). Representative time series of pulmonary artery flow (FPA) and pulmonary artery pressure (PPA) under irregular cardiac pacing (B).
Fig. 2.The 3-element windkessel (3-WK) model (A). The model consists of characteristic impedance (ZC), resistance (R), and compliance (C). Instantaneous re- lationship of pulmonary artery flow (FPA) and pressure (PPA) (B). The upstroke limb (the solid line between two arrows) of the instantaneous arterial pressure (PPA) and flow (FPA) relation (dashed line) is virtually liner. Its slope represents ZC. Comparison of the measured pulmonary arterial input impedance (ZPA, solid line) and the impedance estimated from the 3-WK model (dashed line). Top and bottom panels show the impedance moduli and phase, respectively.
frequency at baseline and 1, 3, and 8 weeks after the Sugen5416 in- jection. In general, progression of PH shifted the impedance moduli upward. At baseline, moduli below 1 Hz were relatively constant with little shift in phase, indicating the resistive property of ZPA. In the fre- quency range between 1 and 20 Hz, the moduli decreased with fre- quency, with significant delays in phase, indicating the capacitive property of ZPA. Above 20 Hz, the moduli were relatively stable at baseline and were highly variable with the progression of PH. These moduli instabilities in the high-frequency range make frequency do- main estimation of characteristic impedance imprecise and thereby impractical.
3.3. Dynamic properties
Fig. 5shows the 3-WK model parameters obtained from high-re- solution, wideband pulmonary arterial input impedance. SuHx pro- gressively increased resistance (baseline: 9.3 ± 3.6 mm Hg/mL/s, SuHx1W: 20.7 ± 7.9 mm Hg/mL/s, SuHx3W: 58.8 ± 6.9 mm Hg/mL/
s, SuHx8W: 62.9 ± 17.8 mm Hg/mL/s, p< 0.01; Fig. 5A) and de- creased compliance (stiffening the vessels) (baseline:
11.9 ± 2.1 × 10⁻³mL/mm Hg, SuHx1W: 5.3 ± 1.7 × 10⁻³mL/
mm Hg, SuHx3W: 2.1 ± 0.7 × 10⁻³mL/mm Hg, SuHx8W:
1.9 ± 0.6 × 10⁻³mL/mm Hg,p< 0.01;Fig. 5B). Characteristic im- pedance and the time constant remained unaltered regardless of the progression of PH (Fig. 5C and D, respectively).
3.4. Histological analysis
The progression of pulmonary arterial remodeling and the corre- sponding wall thickening in arteries with ODs < 50 μm (WT50) and 50–100 μm (WT100) across the assessment points are shown inFig. 6.
The wall thickness was found to have tripled in WT50 and doubled in WT100, indicating more severe vascular remodeling in smaller arteries.
The markedly increased wall thickness in the smaller arteries indicated that the lumen area predominantly decreased in the smaller arteries.
The reduction in the lumen area of the smaller arteries would have had a major impact on pulmonary arterial resistance.
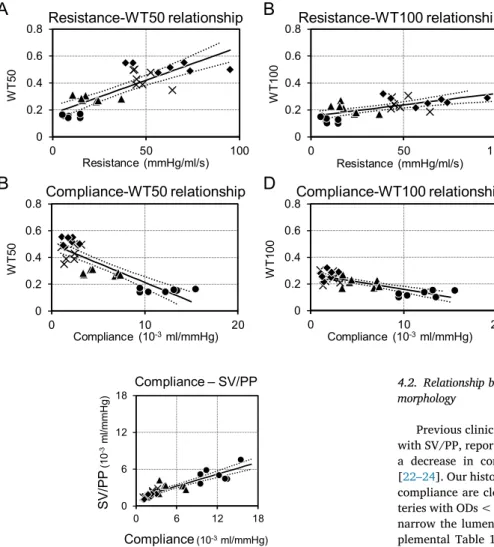
Fig. 7shows the relationships of resistance and compliance with wall thickness. The slope of the relationship between resistance and wall thickness was steeper in the smaller arteries (Fig. 7A) than in the larger arteries (Fig. 7B) (243.5 vs. 156 mL/s/mm Hg, p< 0.01), in- dicating that wall thickening (lumen area loss) of smaller arteries plays an important role in determining pulmonary artery resistance. Ad- ditionally, the slope of the relationship between compliance and wall thickness was steeper in the smaller arteries (Fig. 7C) than in the larger arteries (Fig. 7D) (−54.2 vs. −39.2 × 103mm Hg/mL,p< 0.01), in- dicating that wall thickening of smaller arteries plays an important role in determining compliance.
4. Discussion
In a rat model of SuHx PH, we investigated how PH affects Fig. 3.The time course of pulmonary arterial pressure (PPA) (A), pulmonary arterial flow (FPA) (B), and right ventricular hypertrophy (RVH) (C) in Sugen/hypoxia (SuHx) rats. PPAand RVH increase with time. FPAremains unchanged. *p< 0.05 vs. baseline, †p< 0.05 vs. SuHx1W, ‡p< 0.05 vs. SuHx3W.
Fig. 4.Changes in pulmonary arterial input impedance (ZPA) in Sugen/hypoxia (SuHx) rats. Impedance moduli phase (degree), and coherence are shown. The moduli at a frequency < 10 Hz increase with the progression of pulmonary hypertension, while the phases remain relatively unaltered. The solid and dashed lines represent mean and mean ± standard deviation, respectively. Coh, magnitude squared coherence.
T. Nishikawa et al. Life Sciences 212 (2018) 225–232
228
pulmonary vascular mechanics by analyzing high-resolution, wideband pulmonary impedance (ZPA). We found that the moduli of ZPAshifted upward in SuHx PH model rats, and the degree of the upward shift in ZPAwas consistent with the progression of PH. Additionally, the upward shift in ZPA accompanied increases in resistance and decreases in compliance. However, the time constant and characteristic impedance remained unchanged. Moreover, the histological study showed that the increases in resistance and decreases in compliance were closely asso- ciated with increases in the wall thickness of arteries with ODs < 50 μm.
4.1. Alteration of ZPAin PH model rats
As the structural alterations of the pulmonary artery in PH are tightly associated with its mechanical properties [3], experiments using an animal model in which pulmonary vascular remodeling resembles that in human PH are essential for understanding its pathophysiology.
Therefore, we used SuHx PH model in this study, which closely re- sembles with human PH [17].
In this study, we noted moduli instability and variability in the high- frequency range, and thus, the derivation of characteristic impedance by averaging the moduli was impractical. Therefore, we developed a Fig. 5.Changes in resistance (A), compliance (B), char- acteristic impedance (C), and the time constant (D) in Sugen/hypoxia (SuHx) rats. With the progression of pulmonary hypertension, resistance increases, whereas compliance decreases. Characteristic impedance and time constant remain unaltered. *p< 0.05 vs. baseline,
†p< 0.05 vs. SuHx1W.
Fig. 6.Histological analysis of the pulmonary arteries stained with Verhoeff–van Gieson. The top panels (A) show the progression of pul- monary arterial remodeling. The bottom panels show the corresponding wall thickening in ar- teries with outer diameters < 50 μm (WT50) (B) and 50–100 μm (WT100) (C). Sugen/hypoxia (SuHx)-induced pulmonary hypertension in- creased both WT50 and WT100. *p< 0.05 vs.
baseline, †p< 0.05 vs. SuHx1W. SuHx, Sugen/
hypoxia.
new technique (the time–frequency method) to estimate the parameter values of the 3-WK model. Fig. 8 shows the relationship between compliance estimated with the time–frequency method and SV/PP.
Although compliance correlated linearly with SV/PP, it was generally larger than SV/PP. As PP is the sum of the pressure generated by the volume in arterial compliance and that generated by flow and char- acteristic impedance, the measured PP would be higher than the PP generated by compliance alone. Therefore, we speculate that 3-WK model parameters are identified more precisely with the time–- frequency method than with SV/PP.
As shown inFig. 5, with the progression of PH, resistance increased six times and compliance decreased to 1/6 at 8 weeks when compared to the values at baseline. Thus, the time constant remained unchanged irrespective of the progression of PH. In the early stage among SuHx PH model rats, decreases in compliance were more evident than increases in resistance. On the other hand, in the late stage, decreases in com- pliance were limited as arterial wall stiffness reached its maximum value. These results indicate that the assessment of compliance might contribute to the early detection of PH in clinical settings.
4.2. Relationship between changes in impedance and pulmonary vascular morphology
Previous clinical studies on PH, in which compliance was evaluated with SV/PP, reported that an increase in resistance was associated with a decrease in compliance, without a change in the time constant [22–24]. Our histological study indicated that changes in resistance and compliance are closely associated with the wall thickness of small ar- teries with ODs < 50 μm. Wall thickening in small arteries is possible to narrow the lumen area and increase resistance. As shown in the Sup- plemental Table 1, PH significantly reduced the lumen to wall ratio, indicating the narrowing of lumen area with the increased wall thick- ness in this study. Moreover, resistance is proportional to the inverse square of the lumen area according to the Hagen–Poiseuille law [25]. In this study, as WT50 indicates the lumen area normalized by the total vascular area, we can estimate how changes in WT50 affect resistance using the following equation:
R = R
(1 WT50 ) (1 WT50 )
PH Baseline
Baseline2 PH2
where RPH/RBaseline, WT50Baseline, and WT50PH are the ratio of re- sistance from baseline, WT50 at baseline, and WT50 at PH, respec- tively. The estimated resistance change associated with wall thickness was nearly three-fold higher than real values at SuHx8W. However, this does not fully explain the six-fold increase in resistance in PH. Never- theless, it is well known that severe remodeling in established PH often occludes many small arteries [26,27]. Therefore, it is conceivable that the increased resistance of small arteries and the reduced number of small arteries might account for the six-fold increase in pulmonary ar- terial resistance. However, we cannot directly compare the number of small arteries among the progression phases of PH because the thinness of pulmonary arterial wall in the earlier phase of PH obscured the de- tection of arteries (Supplement 2).
The factors that change compliance in PH are not clear. As shown in Fig. 6B, wall thickness increased by three-fold in small arteries. If the material properties of the wall did not change, this thickening alone would explain the reduction in compliance to 1/3. However, in small arteries, thickening of the vascular wall narrows the lumen area, and thus, vascular wall stress reduces (Laplace law). This would at least partly explain the disproportional decrease in compliance in PH beyond simple wall thickening. Changes in material properties of the pul- monary arterial wall could affect ZPA. Kobs et al. reported that PH Fig. 7.The relationship between arterial wall thickness histologically determined and the me- chanical properties of the pulmonary arteries. The top two panels show the relationship between re- sistance and WT50 (A) or WT100 (B). The bottom two panels show the relationship between com- pliance and WT50 (C) or WT100 (D). Changes in both resistance and compliance are more closely associated with WT50 than with WT100. The circles, triangles, squares, and crosses represent baseline, SuHx1W, SuHx3W, and SuHx8W, respectively. The solid and dotted lines represent regression lines and their 95% confidence intervals, respectively. WT50 and WT100 are wall thickening in arteries with outer diameter < 50 μm and 50–100 μm, respec- tively. SuHx, Sugen/hypoxia.
Fig. 8.The relationship between compliance estimated with the time-frequency method and with the ratio of stroke volume to pulse pressure (SV/PP). Although compliance values estimated with the time–frequency method and SV/PP show a positive correlation, the former is nearly twice as large as the latter. The circles, triangles, squares, and crosses represent baseline, SuHx1W, SuHx3W, and SuHx8W, respectively. The solid and dotted lines represent regression lines and their 95% confidence intervals. SuHx, Sugen/hypoxia.
T. Nishikawa et al. Life Sciences 212 (2018) 225–232
230
increased both collagen and elastin of pulmonary arteries and stiffened the pulmonary arteries [28]. Further investigations are needed to clarify the contribution of each component to changes in the pulmonary arterial mechanical properties. Furthermore, as discussed above, the number of small arteries would be less in PH. Moreover, it is well known that vascular material stiffens when intravascular pressure in- creases [29]. Thus, it is possible that a high pulmonary arterial pressure stiffened large arteries and reduced compliance. Nevertheless, it re- mains difficult to explain how changes in compliance are exactly re- ciprocal to changes in resistance. They are unlikely to coincide unless the same mechanism governs the changes. Although previous studies explained this phenomenon by the wide and mixed distribution of the resistance and compliance vessel in the pulmonary vasculatures [24,30], our study found that the exact reciprocal changes in com- pliance and resistance might be associated with wall thickening and a reduced number of small arteries. Further studies are needed to clarify the contribution of proximal and peripheral arteries to compliance re- duction.
In our study, SuHx-induced PH did not alter characteristic im- pedance. It remains unclear how PH impacts characteristic impedance [13–16], partly because its measurement in the frequency domain is imprecise. Characteristic impedance can be described by the inertia and compliance of proximal arteries as following [31]:
= Characteritic impedance Eh
2 r2 5
where E, h, and r are the elastic module (Young's modulus), wall thickness, and luminal radius, respectively, of the proximal pulmonary artery, and ρ is the density of blood. Thus, it is conceivable that PH increases E and h and increases the radius of proximal arteries.
Therefore, their net effect does not predict unidirectional changes in characteristic impedance.
4.3. Exploration of the clinical derivation of ZPAin PH
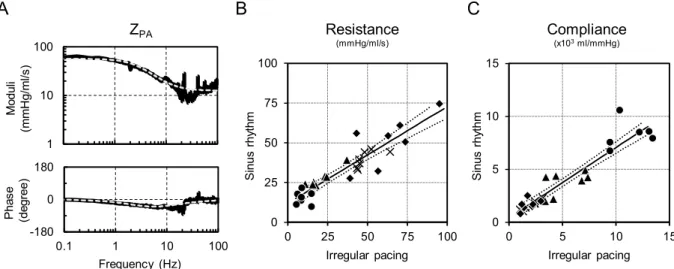
Although we can obtain instantaneous pulmonary pressure and flow velocity instead of volumetric flow in clinical settings, irregular cardiac pacing, which is a prerequisite to derive precise estimations of the parameters in the 3-WK model, may be difficult to perform. To over- come this issue, we introduced parametric analysis of the 3-WK model under sinus rhythm in the time domain. We estimated pulmonary ar- terial pressure (PPA) by convolving the impulse response of the 3-WK model with pulmonary arterial flow (FPA) using the following equation:
= + +
=
P (t) 1
Cexp
RC F (t ) Z F (t) P
N PA
1
PA C PA D
where R, C, ZC, and PDare resistance, compliance, characteristic im- pedance, and downstream pressure, respectively,Nis the total number of time series data (N= 5000),τis the convolution parameter, and t is the time in increments of 1 ms. We determined resistance, compliance, and downstream pressure from the data of time series under sinus rhythm using the least-square method. The detailed derivation is pro- vided in Supplement 3. Fig. 9A shows the estimated impedance ob- tained with this method superimposed on the impedance obtained with irregular pacing. We found that the time domain estimations of para- meter values of resistance and compliance under sinus rhythm were as good as those obtained with irregular pacing in the frequency domain (Fig. 9B and C). Thus, it might be possible to assess ZPAeven in clinical settings.
4.4. Limitations
The present study has several limitations. First, we measured he- modynamics under general anesthesia. We used a mixture of α-chlor- alose and urethane. As both drugs are well known to affect
hemodynamics by changing cardiac and vascular properties [32,33], we cannot directly extrapolate the results of this study to physiological hemodynamics under a conscious state. However, the trend in im- pedance associated with the progression of PH was preserved, because hemodynamics in all groups was assessed under the same condition.
Second, the chest of the rats was open, and they were artificially ven- tilated with oxygen-enriched gas. These experimental conditions could have mechanically influenced the ZPA. Furthermore, it is well known that the oxygen content in blood strongly alters PA characteristics and oxygen supplementation often reduces pulmonary artery pressure in PH patients [34]. However, oxygen supplementation was necessary for the stable measurement of hemodynamics, especially in the 8-week SuHx rats. Thus, we need to carefully interpret the impedance data in SuHx rats. Third, this study evaluated the histology associated with wall thickening in arteries with ODs < 50 μm and 50–100 μm. We could not evaluate larger pulmonary arteries with diameters > 100 μm, as most of these arteries were compressed by surrounding tissues and lost cir- cularity. Further research is needed to clarify how these larger arteries affect pulmonary arterial resistance and compliance.
5. Conclusions
SuHx-induced PH markedly increased resistance and decreased compliance, while the time constant and characteristic impedance re- mained unaltered. These results indicate that resistant and compliant vessels are anatomically inseparable. We speculate that vascular re- modeling in small arteries (ODs < 50 μm) is mostly responsible for these reciprocal changes in resistance and compliance. Our impedance analysis method might serve as a new tool to assess the progression of PH.Supplementary data to this article can be found online athttps://
doi.org/10.1016/j.lfs.2018.10.005.
Acknowledgements
The authors thank Takuya Akashi, Takako Takehara and the staff of Center for Disruptive Cardiovascular Medicine, Kyushu University, Department of Cardiovascular Medicine, Kyushu University and Center for Clinical and Translational Research of Kyushu University Hospital for technical support.
Funding
This work was supported by Research and development of suppor- tive device technology for medicine using Information and Communication Technology from Japan Agency for Medical Research and Development (18he1102003h0004), Development of Advanced Measurement and Analysis Systems from Japan Agency for Medical Research and Development (18hm0102041h0003), Mirai-iryou from Japan Agency for Medical Research and Development, Grant-in-Aid for Young Scientists (B) (18K15893) from the Japan Society for the Promotion of Science, and Actelion Academia Prize 2015.
Conflict of interest
Nishikawa T, Tohyama T, Abe K, Oga Y, Arimura T and Sakamoto T have nothing to declare. Saku K and Kishi T work in a department endowed by Omron Healthcare Co. Sunagawa K works in a department endowed by Omron Healthcare Co. and Actelion Pharmaceuticals Japan. Tsutsui H received honoraria from Daiichi Sankyo, Inc., Otsuka Pharmaceutical Co., Ltd., Takeda Pharmaceutical Company Limited, Mitsubishi Tanabe Pharma Corporation, Boehringer Ingelheim Japan, Inc., Novartis Pharma K.K., Bayer Yakuhin, Ltd., Bristol-Myers Squibb KK, and Astellas Pharma Inc., and research funding from Actelion Pharmaceuticals Japan, Daiichi Sankyo, Inc., and Astellas Pharma Inc.
References
[1] D.B. Badesch, G.E. Raskob, C.G. Elliott, A.M. Krichman, H.W. Farber, A.E. Frost, R.J. Barst, R.L. Benza, T.G. Liou, M. Turner, S. Giles, K. Feldkircher, D.P. Miller, M.D. McGoon, Pulmonary arterial hypertension: baseline characteristics from the REVEAL registry, Chest 137 (2010) 376–387,https://doi.org/10.1378/chest.09- 1140.
[2] P. Escribano-Subias, I. Blanco, M. López-Meseguer, C.J. Lopez-Guarch, A. Roman, P. Morales, M.J. Castillo-Palma, J. Segovia, M.A. Gómez-Sanchez, J.A. Barbera, Survival in pulmonary hypertension in Spain: insights from the Spanish registry, Eur. Respir. J. 40 (2012) 596–603,https://doi.org/10.1183/09031936.00101211.
[3] H.I. Palevsky, B.L. Schloo, G.G. Pietra, K.T. Weber, J.S. Janicki, E. Rubin, A.P. Fishman, Primary pulmonary hypertension. Vascular structure, morphometry, and responsiveness to vasodilator agents, Circulation 80 (1989) 1207–1221.
[4] M.F. O'Rourke, M.G. Taylor, Input impedance of the systemic circulation, Circ. Res.
20 (1967) 365–380.
[5] M.G. Taylor, Use of random excitation and spectral analysis in the study of fre- quency-dependent parameters of the cardiovascular system, Circ. Res. 18 (1966) 585–595,https://doi.org/10.1161/01.RES.18.5.585.
[6] N. Westerhof, G. Elzinga, P. Sipkema, An artificial arterial system for pumping hearts, J. Appl. Physiol. 31 (1971) 776–781.
[7] W.R. Milnor, C.R. Conti, K.B. Lewis, M.F. O'Rourke, Pulmonary arterial pulse wave velocity and impedance in man, Circ. Res. 25 (1969) 637–649.
[8] R.L. Benza, D.P. Miller, M. Gomberg-Maitland, R.P. Frantz, A.J. Foreman, C.S. Coffey, A. Frost, R.J. Barst, D.B. Badesch, C.G. Elliott, T.G. Liou, M.D. McGoon, Predicting survival in pulmonary arterial hypertension: insights from the registry to evaluate early and long-term pulmonary arterial hypertension disease management (REVEAL), Circulation 122 (2010) 164–172,https://doi.org/10.1161/
CIRCULATIONAHA.109.898122.
[9] I.T. Rosen, H.L. White, The relation of pulse pressure to stroke volume, Am. J. Phys.
78 (1927) 168–184.
[10] K. Sunagawa, W.L. Maughan, K. Sagawa, W. Lowell, Stroke volume effect of changing arterial input impedance over selected frequency ranges, Am. J. Phys. 248 (1985) H477–H484.
[11] J.P. Murgo, N. Westerhof, J.P. Giolma, S.A. Altobelli, Aortic input impedance in normal man: relationship to pressure wave forms, Circulation 62 (1980) 105–116, https://doi.org/10.1161/01.CIR.62.1.105.
[12] J.P. Murgo, N. Westerhof, Input impedance of the pulmonary arterial system in normal man. Effects of respiration and comparison to systemic impedance, Circ.
Res. 54 (1984) 666–673,https://doi.org/10.1161/01.RES.54.6.666.
[13] W.K. Laskey, V.A. Ferrari, H.I. Palevsky, W.G. Kussmaul, Pulmonary artery hemo- dynamics in primary pulmonary hypertension, J. Am. Coll. Cardiol. 21 (1993) 406–412.
[14] M. Maggiorini, S. Brimioulle, D. De Canniere, M. Delcroix, R. Naeije, Effects of pulmonary embolism on pulmonary vascular impedance in dogs and minipigs, J.
Appl. Physiol. 84 (1998) 815–821,https://doi.org/10.1152/jappl.1998.84.3.815.
[15] R.A. Hopkins, J.W. Hammon, P.A. Mchale, P.K. Smith, An analysis of the pulsatile hemodynamic responses of the pulmonary circulation to acute and chronic pul- monary venous hypertension in the awake dog, Circ. Res. 47 (1980) 902–910.
[16] D.H. Bergel, W.R. Milnor, Pulmonary vascular impedance in the dog, Circ. Res. 16 (1965) 401–415,https://doi.org/10.1161/01.RES.16.5.401.
[17] K. Abe, M. Toba, A. Alzoubi, M. Ito, K.A. Fagan, C.D. Cool, N.F. Voelkel, I.F. McMurtry, M. Oka, Formation of plexiform lesions in experimental severe pulmonary arterial hypertension, Circulation 121 (2010) 2747–2754,https://doi.
org/10.1161/CIRCULATIONAHA.109.927681.
[18] C.L. Lucas, B.R. Wilcox, B. Ha, G.W. Henry, Comparison of time domain algorithms for estimating aortic characteristic impedance in humans, IEEE Trans. Biomed. Eng.
35 (1988) 62–68,https://doi.org/10.1109/10.1337.
[19] A.R. Conn, N.I.M. Gould, P.L. Toint, Trust Region Methods, Society for Industrial and Applied Mathematics, Philadelphia, 2000.
[20] R.T. Schermuly, E. Dony, H.A. Ghofrani, S. Pullamsetti, R. Savai, M. Roth, A. Sydykov, Y.J. Lai, N. Weissmann, W. Seeger, F. Grimminger, Reversal of ex- perimental pulmonary hypertension by PDGF inhibition, J. Clin. Invest. 115 (2005) 2811–2821,https://doi.org/10.1172/JCI24838.
[21] R. Jones, W.M. Zapol, L. Reid, Pulmonary artery remodeling and pulmonary hy- pertension after exposure to hyperoxia for 7 days. A morphometric and hemody- namic study, Am. J. Pathol. 117 (1984) 273–285.
[22] S.R. Reuben, Compliance of the human pulmonary arterial system in disease, Circ.
Res. 29 (1971) 40–50,https://doi.org/10.1161/01.RES.29.1.40.
[23] J.-W. Lankhaar, N. Westerhof, T.J.C. Faes, C.T.-J. Gan, K.M. Marques, A. Boonstra, F.G. van den Berg, P.E. Postmus, A. Vonk-Noordegraaf, Pulmonary vascular re- sistance and compliance stay inversely related during treatment of pulmonary hy- pertension, Eur. Heart J. 29 (2008) 1688–1695,https://doi.org/10.1093/
eurheartj/ehn103.
[24] N. Saouti, N. Westerhof, F. Helderman, J.T. Marcus, N. Stergiopulos, B.E. Westerhof, A. Boonstra, P.E. Postmus, W. Be, P. Pe, A. Vonk-Noordegraaf, W. Be, P. Pe, RC time constant of single lung equals that of both lungs together: a study in chronic thromboembolic pulmonary hypertension, Am. J. Physiol. Heart Circ. Physiol. 297 (2009) H2154–H2160,https://doi.org/10.1152/ajpheart.00694.
2009.
[25] J. Pfitzner, Poiseuille and his law, Anaesthesia 31 (1976) 273–275.
[26] A. Hislop, L. Reid, New findings in pulmonary arteries of rats with hypoxia-induced pulmonary hypertension, Br. J. Exp. Pathol. 57 (1976) 542–554.
[27] D. Ryland, L. Reid, The pulmonary circulation in cystic fibrosis, Thorax 30 (1975) 285–292,https://doi.org/10.1136/thx.30.3.285.
[28] R. Kobs, N. Muvarak, J. Eickhoff, N. Chesler, Linked mechanical and biological aspects of remodeling in mouse pulmonary arteries with hypoxia-induced hy- pertension, Am. J. Physiol. Heart Circ. Physiol. 288 (2005) 1209–1217.
[29] R.H. Cox, Pressure dependence of the mechanical properties of arteries in vivo, Am.
J. Phys. 229 (1975) 1371–1375,https://doi.org/10.1152/ajplegacy.1975.229.5.
1371.
[30] C.A. Dawson, D.A. Rickaby, J.H. Linehan, T.A. Bronikowski, Distributions of vas- cular volume and compliance in the lung, J. Appl. Physiol. 64 (1988) 266–273.
[31] Z. Wang, N.C. Chesler, Pulmonary vascular wall stiffness: an important contributor to the increased right ventricular afterload with pulmonary hypertension, Pulm.
Circ. 1 (2011) 212–223,https://doi.org/10.4103/2045-8932.83453.
[32] D.M. Beam, E.M. Neto-Neves, W.B. Stubblefield, N.J. Alves, J.D. Tune, J.A. Kline, Comparison of isoflurane and α-chloralose in an anesthetized swine model of acute pulmonary embolism producing right ventricular dysfunction, Comp. Med. 65 (2015) 54–61.
[33] T.D. Giles, A.C. Quiroz, G.E. Burch, Hemodynamic alterations produced by pro- longed urethane anesthesia in the intact dog, Am. Heart J. 78 (1969) 281–282, https://doi.org/10.1093/eurheartj/ehv764.
[34] S.H. Dressler, N.B. Slonim, O.J. Balchum, G.J. Bronfin, A. Ravin, The effect of breathing 100% oxygen on the pulmonary arterial pressure in patients with pul- monary tuberculosis and mitral stenosis, J. Clin. Invest. 31 (1952) 807–814, https://doi.org/10.1172/JCI102666.
Fig. 9.Comparison of pulmonary arterial input impedance (ZPA; solid line) and algebraically estimated impedance (dashed line) from the three-element windkessel (3-WK) parameters obtained from time series data under sinus rhythm. Estimated impedance accurately approximates ZPA(A). Comparison of estimated resistance (B) and compliance (C) between irregular pacing and sinus rhythm. Parameters estimated under sinus rhythm match well with those estimated under irregular pacing. Each symbol indicates an individual rat. The circles, triangles, squares, and crosses represent baseline, SuHx1W, SuHx3W, and SuHx8W, respectively. The solid and dotted lines represent regression lines and their 95% confidence intervals, respectively. SuHx, Sugen/hypoxia.
T. Nishikawa et al. Life Sciences 212 (2018) 225–232
232