Secular Changes in Body Height and Weight of Population in
Japan since the End of WW II in Comparison with South Korea
Hiroshi Mori
“It (stature) is a net measure that captures not only the supply of inputs to health but demands on those inputs.” (R.H. Steckel, Jr. Econ. Literature, 1995, p.1903)
Introduction
A small group of researchers, including the author, in Japan and the United States have been engaged in the econometric analyses of food consumption mainly in Japan from the age/generation perspectives (Mori eds., Cohort Analysis of Food Consumption in Japan, 2001; Mori et al., Declining Orange Consumption in Japan: Generational Changes or
Something Else?, 2009; Mori, Saegusa, and Dyck, “Structural Changes in Demand for
Foods in a Rapidly Aging Society,” 2016; etc.).
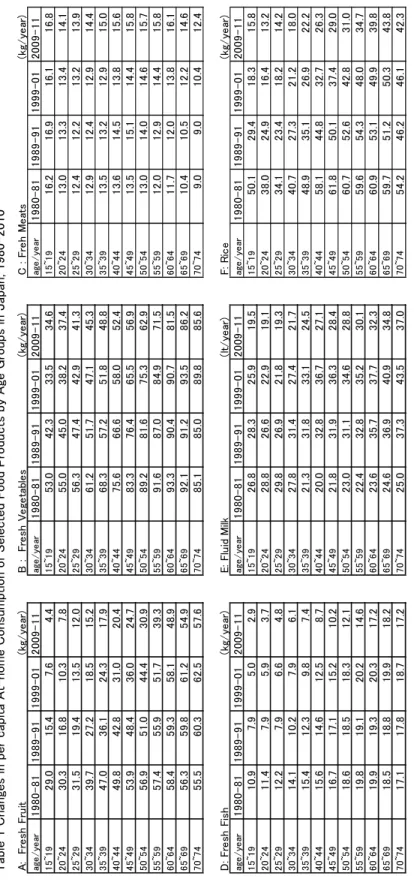
Due to the data source, Family Income and Expenditure Survey, on which we relied, our analyses have been focused on at-home food consumption, with little attention to the increasing eating out particularly among the young generations. And yet, we have discovered appreciably declining tendencies in per capita consumption of a number of major food products---rice, fresh fish, fresh fruit and vegetables and even milk among the younger age groups, regardless of sex in the past two or three decades. Per capita at-home consumption of fresh fish and fresh fruit, in particular, by non-adults and those young adults in their 20s and 30s is estimated to have decreased drastically in the past 30 years or so, as compared to the older generations, which have not changed appreciably in consumption. As a consequence, those in their teens and their 20s are estimated to consume around one-tenth of fresh fruit, compared to those in their 60s and above in recent years. The same phenomenon has taken place for fresh vegetables, although to a much lesser degree. Per capita at-home consumption of fresh meat has increased moderately over the period across the board, with the consumption by the high-teens and young adults in their 20s and 30s only some 10% more than 30 years ago, far less than needed to compensate for the drastic decreases in fish consumption by these young age groups (refer to Table 1, for details).
National Nutrition Survey by the Ministry of Health, Labor, and Welfare, initiated at the
advice of the Occupation Forces soon after WW II, started to publish nutrition intakes by the age groups in the annual report of KOKUMINN EIYOU no GENJYOU (Present
Situation of National Nutrition) in 1995. Per capita total caloric intake from all sources,
Tab le 1 Ch ange s in p er cap it a At -home Consu mption of Selec ted F
ood Products by Age Gro
declined to approximately 2,000 calories in the mid-1990s, and further down to approximately 1,850 calories, presumably reflecting a significant, rapid aging of the population.
Over the normal life cycle, ordinary people consume the largest amount of foods in their mid-teens and total caloric intake per person gradually declines as they age toward their elderly years. According to the Nutrition Survey age classification, males in the age group, 15-19 years old consume the largest amount of calories, followed by those in their 20s to 50s, and females in the age group of 7-14 take nearly equal or slightly larger amount than the late teen age groups. Males in their high-teens of 15-19 are estimated to take approximately 2,500 calories per day per person in the mid-1990s and have kept their caloric intakes almost constantly at this level until 2014, the latest survey year. As will be shown in the subsequent section, Japanese males of 20 years of age have not grown either in body height or weight during the corresponding years in the past. As they have not eaten more, they have not grown bigger, or they have ceased growing, because they have quit eating more. To be exact, the author should be happier, if we could state more specifically that the young Japanese have ceased to grow for some time in height, in particular, because they have not learned to eat more properly. As will be shown in the later section, the Japanese young in their early 20s have been lower in body height than the Korean peers by approximately 4 cm in the recent decade, and 12-13 cm lower than those in the world's tallest nation, the Netherlands, no to speak of.
Secular Changes in Body Height in the Western Nations
It is widely conceived in Japan that Americans have long been very tall. It is also conceived that Europeans have long been tall, i.e., vaguely people in North: Sweden, Norway, Netherlands, etc. the tallest, followed by those in Middle: G. Britain, Germany, Austria, etc., and those in South: France, Italy, etc. somewhat shorter than the above nations. As the westerners are distinctly different in skin complexion from the Northeast Asians, so are they tall in body height as a racial feature, so to speak. This is the concept which has been commonly held by many people. However, research contradicts this belief, such as the articles: "Stature and the Standard of Living" by Steckel; "Economic Growth, Population Theory, and Physiology" by Fogel, and a few other papers (provided courtesy of Professors S-W Park, and J-S Moon, pediatricians in S. Korea).
Table 2 Secular Changes in Adult Male Stature in The Western Nations, 19th century to 20th Century (cm)
U.K. Norway Sweden France Denmark Hungary 19-I 168.0 ― 166.7 164.3 165.4 163.9 19-II 171.6 ― 168.0 165.2 166.8 164.2 19-III 169.3 168.6 169.5 165.6 165.3 ― 20-III 175.0 178.3 177.6 172.0 176.0 170.9 Source Fogel, "Economic Growth", AER, 84(3), p. 372.
Table 3 Secular Changes in Adult Male Stature in The Western Nations, 1800-1950
U.S. U.K. Sweden Norway Nethlands France Aus/Hung 1800 173 167 166 166 163 163 1850 171 166 168 169 164 167
1900 171 167 172 171 169 165
1950 175 175 177 178 178 170 171 Source: Steckel, "Stature," Ec. Literature, XXXIII, p. 1919.
regarded within the statistical errors. The most important fact to be kept in mind is that the young male adults have grown more than 10cm taller over the 100 years or so since the late 1800s in most European countries. Hatton (2013) seems to attribute the growth in body height, if only statistically, to the fall in infant mortality. The infant mortality rate is measured as: the number of deaths within one year after birth/the number of births, which may reflect the disease environment in the chosen short period. It is, however, questionable that the fall in infant mortality was “the most important proximate source of increasing height” (Hatton, p.1). At any rate, one of the key findings in this section is that people can grow conspicuously in height, regardless of race and geographical locations, if the environmental conditions allow it.
Changes in Body Size of Japanese People after WW II
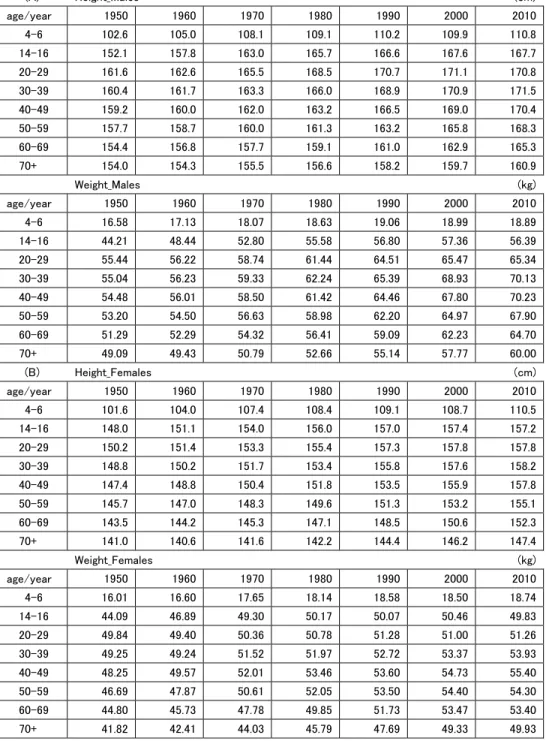
Japanese young males in their 20s were 161.6 cm tall (on average, to be omitted afterword) in 1950 and those in their 30s and 40s, who were in their 20s in 1940 and 1930, respectively were 160 cm, implying that the young adults had not grown much taller until 1950 or so. They grew 1.0 cm taller from 1950 to 1960 and grew 3.0 cm taller in the next decade and again 3.0 cm taller to 168.5 cm in 1980 and grew to 170.7 by 2.2 cm in 1990 and ceased to grow any taller since then at 171.0 cm in 2010. The young Japanese males grew nearly 10 cm in height during the 50 year period from the mid-20th century. The exact same growth patterns in height are observed in the young females, i.e., they grew from 150.2 cm in 1950 to 157.3 cm in 1990 and then ceased to grow since then (0.5 cm taller in 2010, probably within the range of statistical errors).
Those males in their 50s grew taller steadily from 163.2 cm in 1990, to 165.8 cm in 2000 and 168.3 cm in 2010. Those in their 50s in 1990 were born in the 1930s. These cohorts were in their 20s in 1960 and those in their 50s in 2010 were in their 20s in 1980. With these cohort aspects taken into consideration, it is fair to state that population in Japan ceased to grow in height around 1990 and won't grow any taller from now, unless boys and girls under 20 years of age now restart growing taller appreciably any more than at present again for unpredictable reasons in the near future (Table 4).
Table 5 Changes in BMI by Age Groups and Sex in Japan, 1950-2010 (A) BMI_Males age/year 1950 1960 1970 1980 1990 2000 2010 5 15.74 15.53 15.45 15.64 15.69 15.71 15.38 15 19.12 19.46 19.86 20.24 20.47 20.41 20.05 25 21.24 21.26 21.45 21.63 22.14 22.36 22.40 35 21.40 21.51 22.26 22.58 22.92 23.60 23.85 45 21.50 21.88 22.30 23.05 23.25 23.73 24.19 55 21.39 21.64 22.11 22.66 23.35 23.63 23.97 65 21.52 21.27 21.84 22.28 22.80 23.44 23.69 75 20.70 20.76 21.01 21.48 22.05 22.66 23.19 Notes: BMI=(weight in kg)/(height in meter)2
age 5=ave(4:6) age15=ave(14:16) age25=ave(20:29) age35=ave(30:39) age75=ave(70+)
each annual year=3 year average, like 1950=ave(1949:1951)
● (B) BMI_Females age/year 1950 1960 1970 1980 1990 2000 2010 5 15.51 15.34 15.30 15.45 15.60 15.67 15.34 15 20.13 20.55 20.78 20.61 20.32 20.37 20.17 25 22.08 21.55 21.43 21.03 20.71 20.48 20.59 35 22.24 21.83 22.40 22.09 21.71 21.50 21.56 45 22.20 22.39 23.00 23.20 22.76 22.52 22.24 55 21.99 22.15 23.02 23.27 23.38 23.18 22.58 65 21.77 21.99 22.63 23.03 23.46 23.57 23.02 75 21.04 21.45 21.97 22.66 22.87 23.07 22.97 Sources: calculated by the author, using the data in Table 4:
been consistently declining in BMI, from 22.1 and 22.2 in 1950 to 20.6 and 21.6 in 2010, respectively. The authors hear that young Japanese women, not few in number, are excessively concerned about "dieting" without good reasons.
The author has been told by the medical professionals that what matters in BMI is the tendencies in the percentage or distribution of obese or near-obese people in population of any age groups, regardless of sex. This paper cannot dig into this topic, due to the absence of data and the author's analytical inability in this field.
Comparison of Body Growth Patterns of Japanese and S. Korean Children
cm at the 2015 School Children Health Survey with that of Japanese peers, boys of 17 years of age, reported in the 2013 National Nutrition Survey, he was shocked to realize that the Korean senior male students were 3 to 4 cm taller (on average, to be omitted afterward) than the Japanese boys of the same age in 2010-13.
By the courtesy of Chosun Ilbo reporters, the author was able to communicate with Professors Soon Woo Park and Jin-Soo Moon, who administered the 2015 school health survey. Prof. Moon was very kind to send him the related data and a couple of important literatures in the field of anthropometric analyses. With very little background in clinical nutrition, physiology, physical education, etc., he tried his best to compile as reliable statistical data as possible on secular changes of body size of children by broad age categories in Korea and Japan from 1965 to present.
Table 6-A Comparisons of Body Height by Age Groups of Male Children:
Korea and Japan, 1965 to 2005 (cm)
year 1965 1964-66 1975 1975-76 1985 1984-86 1997 1996-98 2005 2004-06 age_yr. old Kr Jp Kr Jp Kr Jp Kr Jp Kr Jp 4-6 ave 100.9 107.4 104.5 108.6 108.0 109.4 109.6 109.3 110.9 110.1 9-11ave 128.2 133.4 131.7 136.1 135.3 137.2 138.1 138.3 141.6 138.6 14-16 ave 156.0 161.6 158.6 164.2 163.5 166.1 167.2 167.3 170.0 167.4 19-21 ave 168.8 165.4 168.4 167.4 170.1 170.6 173.3 171.2 174.4 171.5
Table 6-B Comparisons of Body Height by Age Groups of Female Children:
Korea and Japan, 1965 to 2005 (cm)
year 1965 1964-66 1975 1975-76 1985 1984-86 1997 1996-98 2005 2004-06 age_yr. old Kr Jp Kr Jp Kr Jp Kr Jp Kr Jp 4-6 ave 100.2 106.1 103.3 107.8 107.5 108.7 108.5 108.8 109.8 109.5 9-11ave 128.0 134.1 131.9 136.8 135.8 138.3 138.0 139.2 142.1 139.5 14-16 ave 152.2 153.2 153.9 154.8 155.8 156.3 158.9 156.7 159.7 157.0 19-21 ave 155.8 153.7 157.1 155.0 157.4 157.0 160.3 158.2 161.5 158.5 Notes: simple averages of 19 and 20 years olds for Korea.
Sources: Ji-Yeong Kim et al., 2009 for Korea and National Nutriton Surveey, various issues for Japan.
Korean boys seem to differ distinctly from the Japanese peers.
Girls mature a few years earlier than boys, i.e., their puberty starts a couple of years earlier than boys and their physical maturity is reached around 17-18 years of age, a few years earlier than boys. Therefore, a slightly different age classification should be prepared from that for boys. The absence of professional knowledge in this area prevents us from preparing the tables with different age classification in this article. As early as in 1965, Japanese girls at the age of 15 years old were 153.2 cm, 1.0 cm taller than the Korean peers but 10 years later in 1975 Japanese girls at the age of 20 years old were 155.0 cm, 2.1 cm shorter than the Korean peers then. Again in 1985, the Japanese girls of 15 years old were 156.3 cm, 0.5 cm taller than the Korean peers then but in 1997, Korean girls of 20 years of age were 160.3 cm, 2.1 cm taller than the Japanese peers then.
Table 7-A Comparisons of Body Weight by Age Groups of Male Children:
Korea and Japan, 1965 to 2005 (kg)
year 1965 1964-66 1975 1975-76 1985 1984-86 1997 1996-98 2005 2004-06 age_yr. old kr jp kr jp kr jp kr jp kr jp 4-6 ave 15.8 17.7 16.7 18.3 17.9 18.7 19.1 18.6 19.9 18.7 9-11 ave 25.7 29.5 27.3 31.8 29.5 33.0 34.7 34.4 39.1 34.4 14-16 ave 45.1 51.1 46.9 54.4 51.9 56.4 57.9 56.7 64.2 57.5 19-21 ave 58.2 57.0 58.7 59.1 61.1 61.8 66.3 63.2 70.8 63.9
Table 7-B Comparisons of Body Weight by Age Groups of Female Children:
Korea and Japan, 1965 to 2005 (kg)
year 1965 1964-66 1975 1975-76 1985 1984-86 1997 1996-98 2005 2004-06 age_yr. old Kr Jp Kr Jp Kr Jp Kr Jp Kr Jp 4-6 ave 15.6 17.1 16.1 18.3 17.4 18.3 18.5 18.6 19.2 18.6 9-11 ave 25.9 29.6 27.2 31.8 29.6 33.1 33.8 34.0 37.6 34.0 14-16 ave 44.0 48.0 46.4 49.3 49.2 50.1 52.5 49.9 54.7 51.0 19-21 ave 51.3 50.3 51.6 50.2 51.7 50.8 55.3 51.3 55.7 51.7
Notes: the same as Table 6. Sources: the same as Table 6.
What can be presumed to have caused these differences? The author can claim with confidence that anything related to racial matters is no answer; per capita net national income cannot be an answer again, because Japan is even today a little greater than Korea in net per capita income, despite the long-lasted economic stagnation after the Japan's economic bubble burst in the early 1990s.
In the past month or so, what caught his mind is Original Article: "South Korea's entry to the global food economy: shifts in consumption of food between 1998 and 2009," Asia Pac J
Clin Nutr 2012 (Lee, Duffey, and Popkin). The authors emphasize that one of the unique
features of food consumption in Korea is that vegetable intake has remained high, with Kimchi the largest contributor to vegetable consumption: its per capita consumption has risen steadily since 1969, increasing from 58 g to 117 g/day in 2009 (p.619). In addition, the daily per capita intake of fruits has also been increasing over time, with particularly rapid change in the 1990s. In 1995, 146 g of fruits were consumed, and this is almost a 10-fold increase from the 18.9 g consumed in 1970, and this trend has continued until 2009 (p.622); see Table X and Table XX in Supplemetary Data for details. These changes in the Korean diet in the past few decades are just opposite to what has been taking place in Japan over the same period in at-home food consumption, particularly among the younger age groups, as we briefly mentioned in the Introduction (Table 1).
intakes and bone mineral density,” by Prynne et al., 2006; “fruit and vegetable consumption and bone mineral density,” by McGartland et al., 2004; etc. A sincere appreciation goes to Dr. M. Maotani who kindly introduced Dr. Sugiura to the author last week.
References
Chosun Ilbo. Chosun Online in Japanese.
Fogel, Robert W. (1994) "Economic Growth, Population Theory, and Physiology: The Bearing of Long-Term Processes on the Making of Economic Policy," The American Economic Review, 84(3), 369-395.
Haas, J.D. and F. Campirano (2006) "Interpopulation variation in height among children 7 to 18 years of age," Food and Nutrition Bulletin, 27(4):supplement, S212-S223.
Hatton, Timothy J. (2013) "How have Europeans grown so tall?" Oxford Economic Papers (Advance Access published September 1), Oxford University Press, 1-24.
Japanese government, Ministry of Health, Labor, and Welfare. National Nutrition Survey, various issues.
――Bureau of Statistics, Family Income and Expenditure Survey, various issues.
Kim, Ji-Yeong, Jin-Soo Moon, S-H. Shin et al. (2008) “Anthropometric Changes in Children and Adolescents from 1965 to 2005 in Korea,” American Journal of Physical Anthropology, 136, 230-236.
Kouchi, Makiko (1996) "Secular Change and Socioeconomic Difference in Height in Japan,"
Anthropological Science: J. the Anthropological Society of Nippon, 101(1), 325-340.
Lee H-S, K.J. Duffey, and B.M. Popkin (2012) “South Korea’s entry to the global food economy: shifts in consumption of food between 1998 and 2009,”Asia Pac J Clin Nutr, 21(4), 618-629.
Malcolm, L.A. (1974) "Ecological Factors Relating to Child Growth and Nutritional Status," in
Nutrition and Malnutrition: Identification and Measurement, eds. A.F. Roche and F. Falkner, New York, Plenum Press, 329-52.
Maotani, Touru. Former Administrator, National Institute of Fruit Tree Science, Tsukuba, Japan. McGarland, C.P., P.J.Robson et al. (2004) “Fruit and Vegetable Consumption and Bone Mineral
Density: Northern Ireland Young Hearts Project,” Am. J. Clin. Nutr., 80, 1019-23.
Moon, Jin Soo (2011) “Secular trends of body sizes in Korean children and adolescents: from 1965 to 2010,”Korean Journal of Pediatrics, 54(11), 436-442.
Mori, Hiroshi eds. (2001) Cohort Analysis of Japanese Food Consumption―New and Old Generations, Tokyo, Senshu University Press.
Mori, H., D. Clason, K. Ishibashi, Wm.D. Gorman, and J. Dyck (2009) Declining Orange Consumption
in Japan: Generational Changes or Something Else? Economic Research Report 71, Economic
Research Service, U.S. Department of Agriculture.
Mori, H., Y. Saegusa, and J. Dyck (2016) “Structural Changes in Demand for Foods in a Rapidly Aging Society,” in Food Consumption: Health Risks, Social influences and Current Issues, New York, Nova Science Publishers (in press).
Murata, M. and I. Hibi (1992) "Nutrition and the secular trend of growth," Hormone Research in Pediatrics, 38(Supl.1), 89-96.
Murata, Mitsunori (2000) "Secular trends in growth and changes in eating patterns of Japanese children1'2'3," The American Journal of Clinical Nutrition, 72(5), 1379-83.
Park, Soon-Woo (2016). Professor, Department of Preventive Medicine, Catholic University of Daegu School of Medicine, Republic of Korea, Personal Communications.
Cross Sectional Study in 5 Age and Sex Cohorts, "Am. J. Clin. Nutr., 83, 1420-1428.
Reidpath, D.D. and P. Allotey (2003) "Infant mortality rate as an indicator of population health,"
Journal of Epidemiol Community Health, 57,344-346.
Rona, Roberto J. (2000) REVIEW "The Impact of the environment on height in Europe: conceptual and theoretical considerations," ANNALS OF HUMAN BIOLOGY, 27(2), 111-126.
Steckel, Richard H. (1995) "Stature and the Standard of Living," Journal of Economic Literature, XXXIII, 1903-1940.
Silventoinen, Karri (2003) "Determinants of Variation in Adult Body Height," Journal of Biosocial Science, Cambridge University Press, 265-285.
Sugiura, M., M. Nakamura, K. Ogawa, Y. Ikoma, and M. Yano (2012) “High Serum Carotenoids Associated with Lower Risk for Bone Loss and Osteoporosis in Post-Menopausal Japanese Female Subjects: Prospective Cohort Study,” PLOS ONE, December, 7(12), 1-9.
Supplementary Data:
Tables X and XX provide changes in per capita supply of fruits in selected countries from 1965 to2010.
Table X Changes in per capita supply of fruits* , selected countries, 1965 to 2010
(kg/year) Nethtlands Sweden USA UK R. Korea Japan
1965 74.43 72.34 76.19 58.72 9.86 39.00 1975 84.64 85.80 100.92 54.96 14.63 61.87 1980 23.25 1985 93.83 75.44 109.13 64.80 35.13 51.88 1990 46.98 1995 144.42 82.02 111.16 78.85 69.60 53.24 2000 69.56 2005 131.58 109.75 109.84 127.02 76.12 60.31 2010 120.19 119.16 102.74 123.30 69.17** 50.82**
Notes: * fruits for wine excluded; ** 2009-2011averages for Korea and Japan. Sources: FAOSTAT: Food Balance Sheets.
Table XX Changes in per capita supply of orananges・mandarins and apples, selected countries, 1965 to 2010
(kg/year) Nethertlands Sweden USA UK R. Korea Japan oranges apples oranges apples oranges apples oranges apples oranges apples oranges apples
1965 20.05 26.30 17.72 18.59 22.45 12.75 9.50 13.22 0.04 5.23 12.28 10.26 1975 25.80 30.55 26.35 23.91 41.03 14.45 11.54 12.81 1.87 7.16 30.94 7.30 1985 28.89 30.52 18.60 22.05 37.01 23.12 14.12 15.96 9.61 11.63 21.08 6.82 1995 54.55 32.14 24.93 15.34 39.65 20.01 18.10 16.90 25.75 14.75 14.18 14.14 2005 40.20 28.44 33.62 25.09 30.89 23.67 40.40 29.65 23.16 7.37 12.35 19.64 2010 27.04 25.02 47.89 19.86 27.98 24.78 37.54 28.01 20.47* 5.29* 10.00* 15.27*
Acknowledgement