Vocal recognition in primate : comparison between Japanese macaques and humans
著者(英) Takafumi Furuyama
学位名(英) Doctor of Philosophy in Engineering 学位授与機関(英) Doshisha University
学位授与年月日 2017‑03‑22
学位授与番号 34310甲第853号
URL http://doi.org/10.14988/di.2017.0000016958
Vocal recognition in primate:
Comparison between Japanese macaques and humans
Takafumi Furuyama
Doshisha University
Graduate School of Life and Medical Sciences
2016
i
Doshisha University
Graduate School of Life and Medical Sciences
Abstract
Vocal recognition in primate: Comparison between Japanese macaques and humans
by Takafumi Furuyama
Most animals produce and perceive vocalizations to communicate with other individuals.
Primates must recognize both the contents and the speakers of vocalizations from conspecific individuals accurately for maintaining social interactions and the increases their chances of survival. In addition, studies with non-human primates are required to discuss whether the voice recognition was evolutionarily maintained in primates. The purpose of this thesis was to investigate the vocal recognition in Japanese macaques and humans. This thesis is constructed of three behavioral studies. 1) This study investigated the temporal resolutions of both Japanese macaques and humans. The results of temporal resolution showed that humans were more sensitive to detecting amplitude modulation than were Japanese monkeys. 2) The acoustic characteristics used to discriminate individuals based on conspecific and heterospecific vocalizations were determined in Japanese macaques and humans. Our data about individual discrimination showed that monkeys and humans seemingly use different acoustic characteristics to distinguish conspecific and heterospecific voices. 3) The acoustic features for the discrimination of individuals were investigated in Japanese macaques. Our data suggested that formants related to vocal tract characteristics contributed to discriminating individuals based on vocalization in monkeys rather than the temporal structures of fundamental frequencies. Formants were also contributed to distinguish individuals in humans. Thus, our data may imply that the vocal processing of Japanese macaques for individual discrimination were similar to that of humans. Further studies are need to investigate the neural activities behind individual discrimination based on conspecific vocalizations.
ii
List of Contents
List of Tables ... v
List of Figures ... vi
Acknowledgments ... viii
Chapter 1 Introduction ... 1
1.1 Information on vocalizations of primates ... 1
1.2 Vocalization mechanisms in primates ... 2
1.3 Relationships between acoustic features and physical characteristics ... 3
1.4 Study on vocalizations of Japanese macaques ... 4
1.5 Differences in vocal recognition between humans and non-human primates ... 5
1.6 Individual recognition based on faces ... 6
1.7 Individual recognition based on voice in primates ... 7
1.8 Acoustic characteristics for individual discrimination of vocalizations ... 9
1.9 Remaining questions ... 10
1.10 Purposes ... 11
1.11 Organizations of thesis ... 12
Chapter 2 Perception of amplitude-modulated broadband noise: Comparisons between Japanese macaques (Macaca fuscata) and humans ... 13
2.1 Introduction ... 13
2.2 Materials and Methods ... 15
2.2.1 Subjects ... 15
2.2.2 Experimental apparatus ... 15
2.2.3 Stimuli ... 15
2.2.4 Procedure ... 16
2.3 Results ... 18
iii
2.3.1 Training ... 18
2.3.2 Amplitude modulation depth ... 18
2.4 Discussion ... 20
2.4.1 Individual differences in monkeys ... 20
2.4.2 Sensitivities of AM broad-band noise in monkeys and humans ... 20
Chapter 3 Acoustic characteristics used for the discrimination of individuals based on vocalizations in Japanese macaques and humans ... 21
3.1 Introduction ... 21
3.2 Materials and Methods ... 25
3.2.1 Subjects ... 25
3.2.2 Apparatus ... 25
3.2.3 Acoustic stimuli ... 25
3.2.4 Procedure ... 27
3.2.5 Data analysis ... 28
3.3 Results ... 29
3.3.1 Training results in each subject ... 29
3.3.2 Morphed stimuli between cooA and cooB: whole-morph ... 29
3.3.3 Morphed F0 continuum results ... 30
3.3.4 Morphed VTC continuum results ... 30
3.3.5 Comparison between monkeys and humans ... 30
3.4 Discussion ... 32
3.4.1 Response to test stimuli ... 32
3.4.2 Whole-morph continuum ... 32
3.4.3 Responses to F0-morph stimuli in monkeys and humans ... 33
3.4.4 Responses to VTC-morph stimuli in monkeys and humans ... 34
3.4.5 Comparisons between monkeys and humans ... 35
3.5 Conclusions ... 37
iv
Chapter 4 Role of vocal tract characteristics in individual discrimination by
Japanese macaques (Macaca fuscata) ... 38
4.1 Introduction ... 38
4.2 Materials and methods ... 41
4.2.1 Subjects ... 41
4.2.2 Experimental apparatus ... 41
4.2.3 Acoustic stimuli ... 41
4.2.4 Procedure ... 43
4.2.5 Statistical analysis ... 44
4.4 Discussion ... 47
4.5 Conclusion ... 50
Chapter 5 Conclusions ... 51
5.1 Summary of major results ... 51
5.1.1 Perception of amplitude-modulated broadband noise in primates (Chapter 2) ... 51
5.1.2 Acoustic characteristics for discriminating conspecific and heterospecific vocalizations (Chapter 3) ... 52
5.1.3 Acoustic features for individual discrimination in monkeys (Chapter 4) ... 52
5.2 Future works ... 53
5.3 Final remarks... 54
References ... 56
v
List of Tables
Table 2-1. Mean reaction times (RT, mean ± standard deviation [SD]) and z-scores to both
of training and test stimuli. ... 70
Table 3-1. Mean (SD) reaction times to whole-morph stimuli in each subject. ... 71
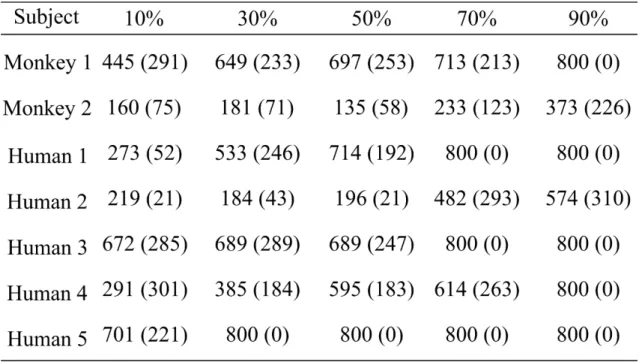
Table 3-2. Mean (SD) reaction times to F0-morph stimuli in each subject. ... 72
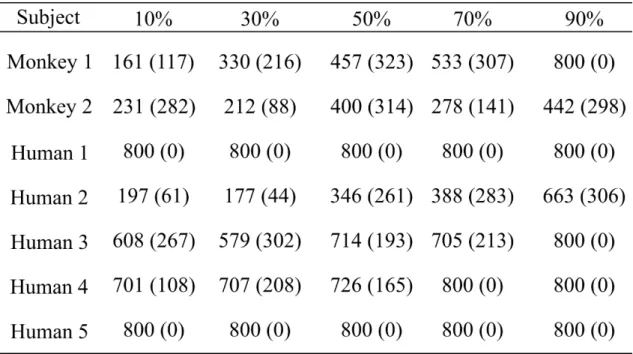
Table 3-3. Mean (SD) reaction times to VTC-morph stimuli in each subject. ... 73
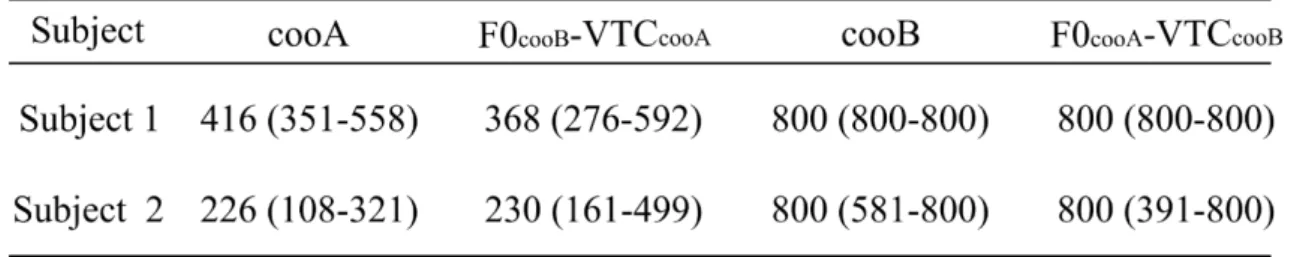
Table 4-1. Median (interquartile range) of reaction times to training and test stimuli. .. 74
vi
List of Figures
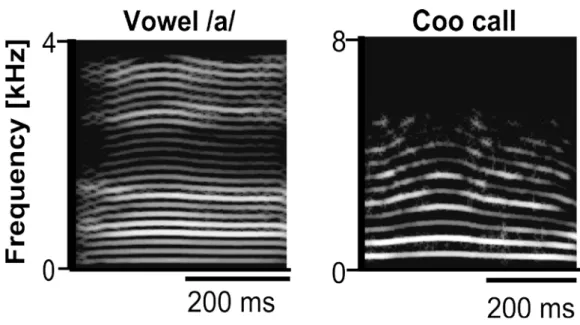
Figure 1-1. Spectrograms of a human vowel (/a/, left panel) and coo calls from monkeys
(right panel). ... 75
Figure 1-2. Vocal generation mechanism in primates. ... 76
Figure 2-1. Experimental setting. ... 77
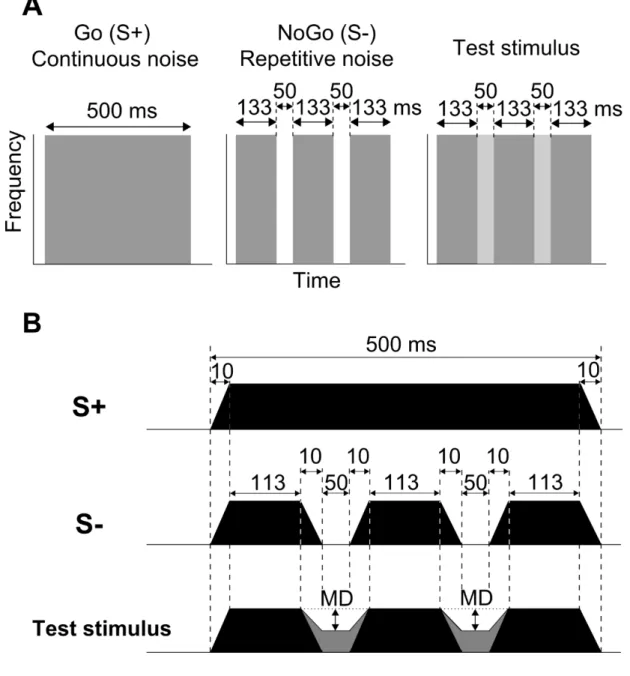
Figure 2-2. Schematized spectrograms (A) and amplitude envelopes of discriminative and test stimuli (B).. ... 78
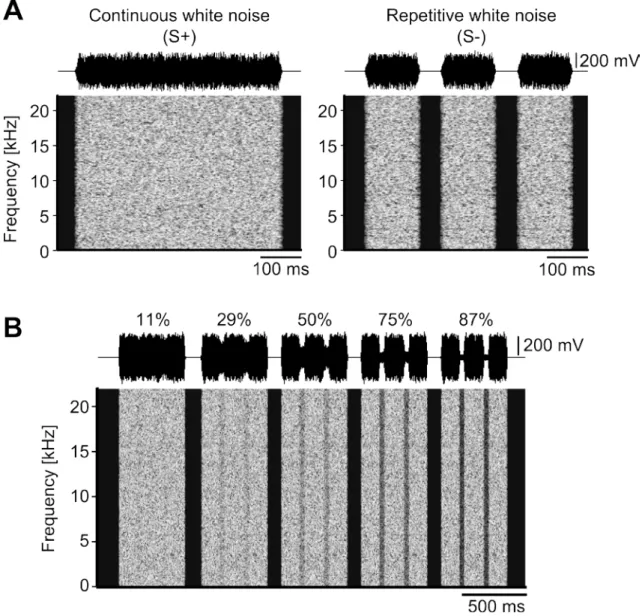
Figure 2-3. Spectrograms of training and test stimuli. ... 79
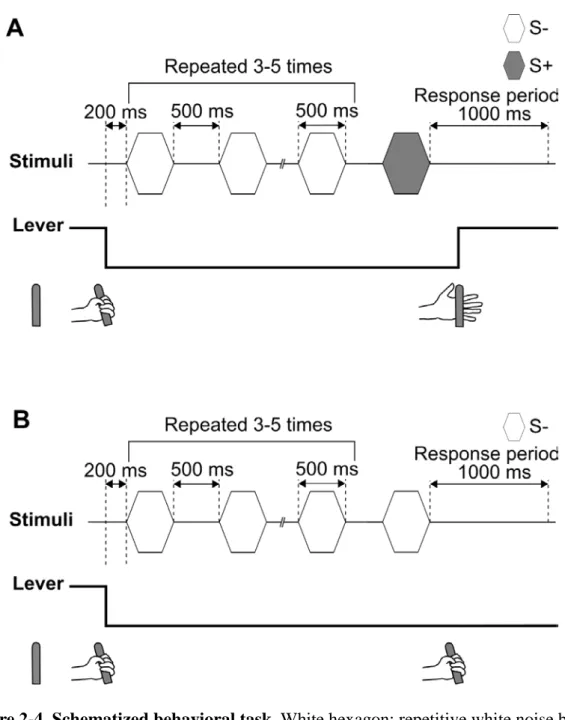
Figure 2-4. Schematized behavioral task. ... 80
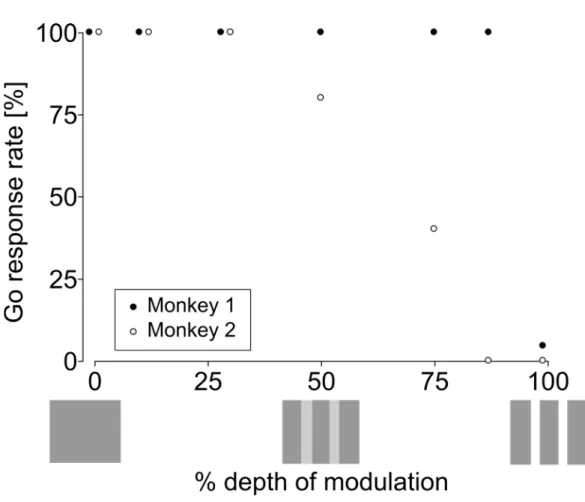
Figure 2-5. Go response rates to stimuli for two monkeys. ... 81
Figure 2-6. Go response rates to stimuli for three humans. ... 82
Figure 2-7. Reaction times to stimuli for two monkeys. ... 83
Figure 2-8. The z-scores of reaction times to test stimuli with different modulation depths in each monkey. ... 84
Figure 3-1. Spectrograms of coo calls in Monkey A (top) and Monkey B (bottom). .... 85
Figure 3-2. Temporal F0s of coo calls in two monkeys. ... 86
Figure 3-3. Power spectrograms (top) and linear predictive coding spectra (bottom) of vocalizations in two monkeys... 87
Figure 3-4. Spectrograms of continuum stimuli between the coo calls of two monkeys. ... 88
Figure 3-5. Spectrograms of F0-morph stimuli. ... 89
Figure 3-6. Spectrograms of VTC-morph stimuli. ... 90
Figure 3-7. Schematized trial event sequence. ... 91
vii
Figure 3-8. Go response rates (A) and reaction times (B) to whole-morph stimuli in the
subjects ... 92
Figure 3-9. Go response rates (A) and reaction times (B) to F0-morph stimuli in the subjects ... 93
Figure 3-10. Go response rates (A) and reaction times (B) to VTC-morph stimuli in the subjects ... 94
Figure 3-11. Distributions of correlation coefficients for F0-morph and VTC-morph stimuli in each subject. ... 95
Figure 4-1. Spectrograms of the coo calls from the two monkeys. ... 96
Figure 4-2. Temporal pitch patterns of the coo calls of the two monkeys. ... 97
Figure 4-3. Power spectra and linear predictive coding spectra of the cooA (solid line) and cooB (dash line) stimuli. ... 98
Figure 4-4. Methods for the synthesis of the stimuli. ... 99
Figure 4-5. Schematized trial event sequence. ... 100
Figure 4-6. Go response rates to the test stimuli. ... 101
Figure 4-7. Comparisons of the reaction times to the training and test stimuli for the two
subjects (A: Subject 1, B: Subject 2). ... 102
viii
Acknowledgments
First of all, I would like to thank many people who have been supporting my study. I would like to thank Professor Hiroshi Riquimaroux and Professor Kenichi Yoshikawa for giving me the opportunity to pursue a doctoral degree and for encouraging me with their grateful support throughout the undergraduate and graduate years.
I would like to thank Dr. Kohta I. Kobayasi for his advices throughout the undergraduate/graduate years and constructive comments on my study. His wide knowledge of neuroethology and his behavioral techniques have provided both the bases of behavioral protocols and fundamental knowledge. His crucial advices supported behavioral techniques and discussions in this dissertation. In addition, I wish to appreciate him for constant encouragement and helpful me.
I also wish to thank Dr. Shizuko Hiryu for both insightful discussions and providing importance of animals’ auditory on my study. In addition, I would like to appreciate her for continuous encouragement.
I wish to appreciate Mr. Hiroshi Takaoka for his knowledge of fundamental programming in vocal processing. His programming skill of vocal processing have provided the techniques of vocal modification on my thesis.
I would like to appreciate my collaborators, Mr. Yuki Torigoe, Mr. Naoya Akiyama, Mr.
Takeshi Morimoto, and Mr. Takashi Noguchi for supports of both animal care and training of monkeys. In addition, I thank them for improving experimental apparatus on my study.
I would like to appreciate the financial support of Japan Society for Promotion of Science.
I greatly appreciate my parents for their support through the undergraduate and graduate years. Finally, I wish to thank my wife, Aiko, for her continuous support and encouragement.
Takafumi Furuyama
1
Chapter 1 Introduction
Many primates communicate with other individuals by using vocalizations. It is important not only to recognize a content of vocalizations but also to identify individuals based on utterances, because most primates keep social interactions and increase their chances of survival and mating rates. In addition, comparative studies between humans and nonhuman primates is necessary to describe whether the voice recognition was evolutionarily maintained in primates. This chapter describe the brief backgrounds on vocal recognition in primates, remaining questions, and the purpose of this thesis.
1.1 Information on vocalizations of primates
Many animals produce vocalizations to maintain social interactions. Most non-human primates produce species-specific vocalizations and possess rich vocal repertoires. Several early studies classified the communication sounds of non-human primates. Conspecific sounds were recorded and analyzed in rhesus monkeys (Rowell and Hinde, 1962), squirrel monkeys (Winter et al., 1966), and gorillas (Fossey, 1972). Vocalizations of Japanese macaques were recorded and classified into six classes and 37 types (Itani, 1963). Another study analyzed calls using spectro-temporal structures, classifying 10 classes and 41 subtypes (Green, 1975). These studies explored the evolution of language in humans through species-specific vocalizations of non-human primates.
Animals have to perceive the contents of utterances from conspecific individuals or predators accurately, because this increases their chances of survival and mating rates. Several studies have demonstrated that vocalizations of non-human primates include content like that of human languages. For example, Seyfarth et al. (1980) presented different types of alarm calls to free-ranging vervet monkeys from speakers, and differences in the behaviors of the animals resulted, depending on the type of vocalization. Additionally, animals learn the role of alarm calls
2
during development (Seyfarth and Cheney, 1986). Non-human primates learn to use and comprehend vocalizations (Janik and Slater, 2000). Free-ranging putty-nosed monkeys are able to combine two calls to convey information on both a predator and an impending movement (Arnold and Zuberbühler, 2006; 2008). Japanese macaques emit greeting calls together with increased social interactions when they approach unrelated females (Katsu et al., 2014).
In addition to context, conspecific vocalizations, including human speech, contain much more information (for review see Belin et al., 2004; Taylor and Reby, 2010). Vocalizations are also used to convey information on both affective state and individualities: this is often called
“paralinguistic” information. For example, humans can distinguish individuals and identify emotional state during telephone conversations. Such paralinguistic information is necessary for the construction of social and cooperative interactions among individual primates, including humans. Particularly, individual recognition based on vocalizations is important because most non-human primates live in a forest.
1.2 Vocalization mechanisms in primates
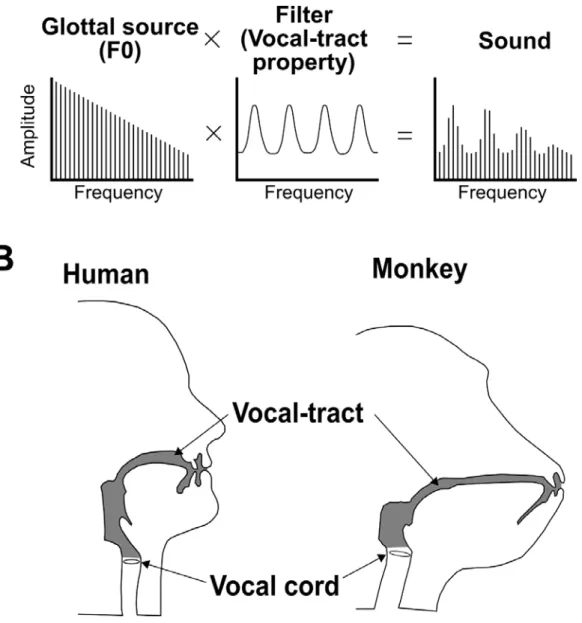
The basic mechanics and anatomy of vocalizations are broadly similar across primates, including humans. Thus, the vocalizations of primates have clear fundamental frequencies (F0s) and harmonics (Fig. 1-1). Fant (1971) developed the “source-filter theory” in the context of speech production (Fig. 1-2). Vocalizations involve a sound source (larynx) and the coupled supralaryngeal cavities (the oral and nasal cavities). The larynx is opened and closed periodically by air from the lungs during voice production. The periodic rate of the vibrations is used to determine the F0 of the vocalizations and is called the pitch. As the repetition rates of the larynx pass through the vocal tract airways above the larynx, the vocal tract characteristics (VTC) generate resonances and enhance/dampen specific frequency ranges: these are referred to as
“formant”.
There are important differences between speech and non-human vocalizations in some aspects (Fitch, 2000). Many primates have air sacs, outpouchings of the epithelium lining the larynx, whereas humans do not. Moreover, the position of the larynx differs between humans
3
and non-human primates. The larynx of humans is located lower than that in non-human primates. The space encompassing the vocal tract is stretched by the descent of the larynx, and humans are able to move the tongue flexibly. Additionally, the stretched vocal tract produces low formant frequencies. However, resent study showed that vocal tract characteristics of monkeys are able to produce human speech adequately (Fitch et al., 2016).
In addition to these anatomical differences, the acoustic characteristics of vocalizations differ between monkeys and humans. The F0 in adult humans is ~100–350 Hz (Bachorowski and Owren, 1999; Skuk et al., 2015), whereas that of monkeys is ~300–1000 Hz (Green, 1975). In addition, the waveform of speech represents slow fluctuations in its amplitude over time. The rates of envelope changes in speech are 333–100 ms (thus, ~3–10 Hz), and the mean syllabic rates of speech correspond approximately to these fluctuations (Houtgast and Steeneken, 1985;
Greenberg and Takayuki, 2004). However, such temporal fluctuations in vocalizations were not observed in field studies of Japanese macaques (Green, 1975; Sugiura, 1993).
1.3 Relationships between acoustic features and physical characteristics
Many studies in humans have investigated the relationships between acoustic characteristics and physical features such as gender, age, and body size. Previous studies demonstrated that acoustic features contribute to gender discrimination (Lass et al., 1976; Childers and Wu, 1991; Wu and Childers, 1991; Bachorowski and Owren, 1999). Although listeners seem to underestimate the age of an individual, humans may try to estimate the age of a speaker from their vocalizations (Hartman and Danhauer, 1976; Hartman, 1979). Other studies showed that acoustic characteristics contributed to perceptions of physical features of the talker in humans (Smith and Patterson, 2005;
Smith et al., 2005).
Vocalizations of non-human primates have also been correlated with physical body features.
One study measured vocal tract length using radiographs and analyzed the vocalizations of monkeys; vocal tract length in monkeys was correlated with body size (Fitch, 1997). The acoustic characteristics of vocalizations have been related to individual discrimination in baboons (Owren et al., 1997) and humans (Lloyd, 2005). A study using MRI revealed a correlation between vocal
4
tract length and body size in humans (Fitch and Giedd, 1999). Another study measured the vocal tract area while vocalizing vowels using MRI; inter-individual differences in the supralaryngeal spaces were shown to influence frequency beyond 2.5 kHz (Kitamura et al., 2005).
1.4 Study on vocalizations of Japanese macaques
The species of study in this thesis was the Japanese macaque (Macaca fuscata). Living primates now consist of more than 70 genera and 400 species (Fleagle, 2013). Macaca appeared 7–8 million years ago in northern Africa (Delson and Rosenberger, 1980). Japanese macaques are a species of old world monkeys, and they inhabit the northern-most regions of the non-human primate range. The native Japanese monkeys live in Japan (30-41 N). Macaca are close to baboons and mangabeys phylogenetically (Fleagle and McGraw, 1999). The life span of Japanese macaques in their natural environment is about 20 years (Fukuda, 1988; Takahata et al., 1998).
The mean body weight of Japanese macaques is 10 kg, and their mean height is 55 cm.
Vocalizations of Japanese macaques have been investigated in field studies. Green (1975) described the contact vocalization as a “coo call” in Japanese macaques. Coo calls have both a clear fundamental frequency (F0) and rich harmonics, and these vocalizations are important for social interactions. For example, monkeys vocalize coo calls when they approach other individuals closely for grooming (Mori, 1975). Monkeys exchange coo calls to avoid separation from the group and for maintaining group organization (Mitani, 1986). Brown et al. (1979) showed that monkeys could distinguish sound localizations using coo calls. Japanese monkeys in the Yakushima lowland alter the acoustic features of F0 or the duration of coo calls according to context when exchanging coo calls. Japanese monkeys can match some acoustic characteristics of the F0s with playback vocalizations (Sugiura, 1993; 1998; Koda, 2004). Japanese macaques vocalize greeting calls (coo calls, grunts, and girneys) together with increased social interactions when they approach unrelated females (Katsu et al., 2014). Japanese macaques, compared with other genera, have been observed frequently to discriminate individuals based on vocalizations in the natural environment.
5
1.5 Differences in vocal recognition between humans and non-human primates
Comparative studies between humans and non-human primates are necessary to reveal whether the voice recognition was evolutionarily maintained in primates. Several studies have compared psychoacoustic differences directly between monkeys and humans using both tone bursts and broadband noises to investigate their basic sensory abilities. Monkeys have better sensitivity than do humans in the high-frequency range (Japanese macaques: 0.028–34.5 kHz; humans: 0.031–
17.6 kHz, Owren et al., 1988). Additionally, the ‘best’ frequency for Japanese macaques differed from that for humans (Japanese macaque: 1 kHz: humans: 4 kHz, Jackson et al., 1999). A previous study using pure-tone bursts revealed that the frequency discrimination limits of humans were approximately seven-fold smaller than those of monkeys (Sinnott et al., 1985; Prosen et al., 1990).
In addition to frequency discrimination, the sensitivity of intensity limits was worse in monkeys than in humans (Sinnott et al., 1985). A study using amplitude-modulated broadband noise stimuli demonstrated that the auditory system of humans was more sensitive than that of monkeys (O'Connor et al., 2000). Other studies comparing macaques with humans showed that humans were better able to detect amplitude modulation (in noise bursts) when the modulation frequency was relatively low (O’Connor et al., 2011). These studies showed that humans and monkeys differ in their basic hearing abilities.
Many studies using speech stimuli have also compared sensitivities between humans and monkeys in attempts to describe how non-human primates perceive human speech. Several studies used synthetic consonant-vowel sounds. One study presented a stimuli continuum between /ba/ and /da/; humans were more sensitive to formant transitions than were monkeys (Sinnott et al., 1976). Another study showed that monkeys and humans had the same phoneme boundaries (Kuhl and Padden, 1983). Sinnott and Adams (1987) presented gradual voice onset times (VOTs);
they demonstrated that humans were more sensitive than monkeys to VOT. Monkeys and humans had different boundaries in discriminating /ra/ and /la/ (Sinnott and Brown, 1997). These study showed that non-human primates were difficult to distinguish human speech.
6
Several studies have shown that humans have a specialized brain mechanism for the processing of human speech sounds. Several studies using functional magnetic resonance imaging (fMRI) revealed that vocal sounds activated neurons in the upper superior temporal sulcus (STS) (Belin et al., 2000; Belin et al., 2002). Another study compared the neural activity elicited by voice versus non-voice sounds (e.g., musical instruments, animal vocalizations); the left STS regions responded more strongly to speech vocal sounds than to non-vocal sounds (Fecteau et al., 2004).
The auditory cortex of non-human primates is also specialized to process species-specific vocalizations, similar to humans. Neurons of the auditory cortex respond to species-specific vocalizations rather than tone bursts, click sounds, or white noise bursts (Winter and Funkenstein, 1973). Activities in the primary auditory cortex in common marmosets were elicited by natural species-specific vocalizations rather than time reversed-vocalizations and temporally changed vocalizations (Wang et al., 1995). Species-specific vocalizations elicited neural activity in the left hemisphere (Poremba et al., 2004). Another study using behavioral and neurophysiological techniques showed that the left temporal cortex, including the auditory cortex, was necessary to discriminate two types of vocalizations in Japanese macaques (Heffner and Heffner, 1984).
1.6 Individual recognition based on faces
Many studies on individual identification have investigated the perception and recognition of faces. Facial communication has become sophisticated in humans and non-human primates.
Humans often communicate with other individuals face-to-face, and humans can readily discriminate individuals by their face. Like humans, non-human primates are able to distinguish the faces of other individuals. Chimpanzees matched the faces of mothers and sons (Parr and de Waal, 1999). Rhesus macaques and chimpanzees can distinguish unfamiliar conspecifics using facial features (Parr et al., 2000). Indeed, monkeys preferred conspecific faces rather than heterospecific faces (Dufour et al., 2006).
Several studies have directly compared facial recognition in non-human primates with that in humans. Eye movements contribute to facial recognition in interactions with other individuals.
7
In a study using eye-tracking methods, it was suggested that humans and rhesus macaques use the same strategies to scan conspecific faces (Dahl et al., 2009). Another study showed that both chimpanzees and humans exhibit unique eye movement approaches for interactions with conspecifics but not heterospecifics (Kano and Tomonaga, 2010).
Many studies using functional imaging methods revealed that facial stimuli are processed in the inferior temporal cortex (IT) of primates. It was shown that the fusiform gyrus of the human brain is involved in processing facial stimuli more strongly than other complex stimuli, using fMRI (Kanwisher et al., 1997; Haxby et al., 2000; Kanwisher and Yovel, 2006) and positron emission tomography (PET) (Sergent et al., 1992).
Previous studies also investigated how single neurons in the brain are responsible for recognizing facial features. Recorded neural activity in the superior temporal polysensory region showed that single neurons responded to both human and monkey faces, but removal of the eyes from faces reduced that neural activity (Bruce et al., 1981). Neurons of the IT responded to facial stimuli rather than to other visual stimuli, such as images of hands (Desimone et al., 1984).
Another study demonstrated that objects might be represented by combinations of neural activities that respond to particular features in images (Tanaka et al., 1991). In rhesus macaques, a study used faces that were intermediate between two individuals to show that single neurons might be linked to tuning perceptions of face identities (Leopold et al., 2006). Electrophysiological studies in macaques have demonstrated neural mechanisms specialized for facial recognition (for review see Gross, 2008).
1.7 Individual recognition based on voice in primates
In addition to faces, speech sounds contain information on the identities of individuals. For example, humans can readily identify individuals from speech during telephone conversations and when listening to the radio. Voice recognition is important for both perceiving the content of a conversation and identifying individuals among primates, including humans, for maintaining social communities.
8
Most non-human primates are also able to identify individuals based on their vocalizations.
Manly studies have demonstrated that primates can identify their own and other infants based on vocalizations alone. Mothers of adult squirrel monkeys (Saimiri sciureus) were able to distinguish the vocalizations of their own infants from those of other infant monkeys (Kaplan et al., 1978).
Snowdon and Cleveland (1980) showed that the pygmy marmoset (Cebuella pygmaea) could distinguish other individuals as group members. Other studies demonstrated an ability to identify infants based on calls alone in Chlorocebus pygerythrus (Cheney and Seyfarth, 1980), Macaca fuscata (Pereira, 1986), and Macaca mulatta (Jovanovic et al., 2000).
Primates, including humans, can identify the body characteristics of individuals based on the acoustic features of vocalizations. A study based on a habituation–dishabituation paradigm showed that rhesus macaques can discriminate the species-specific communication of kin from that of non-kin (Rendall et al., 1996; Rendall et al., 1998). Japanese macaques also distinguish individuals using vocalizations (Ceugniet and Izumi, 2004). Untrained rhesus macaques were able to distinguish age-related body size by using voices (Ghazanfar et al., 2007). Lemurs also discriminated individuals based on vocalizations (Gamba et al., 2012). Previous studies using whisper speech showed that humans can readily distinguish different speakers (Tartter, 1991).
Another study presented sine-wave sentences; listeners were apparently capable of determining individual vocals (Fellowes et al., 1997; Remez et al., 1997). A study that statistically analyzed vowels in humans suggested that various acoustic features with vocal tract resonances contribute to classification of the speaker (Bachorowski and Owren, 1999).
Many studies have demonstrated individual recognition based on vocalizations in monkeys (for review see Belin, 2006). These observations showed that monkeys were able to discriminate rather than identify individual callers. In another study, Sliwa et al. (2011) measured preferential looking time in rhesus macaques and evaluated whether voices are linked to faces; they showed that macaques could spontaneously match familiar faces with voices. Non-human primates may be able to memorize individuals based on their vocalizations and faces.
Several studies have investigated the brain regions involved in voice identification. A study using PET showed that the anterior temporal lobes respond bilaterally to the identification of a
9
speaker (Imaizumi et al., 1997). The left frontal pole and right temporal pole were correlated with familiar voices (Nakamura et al., 2001). Another study using continuum stimuli demonstrated that the anterior temporal lobe responds to changes in voice identity (Andics et al., 2010). In a study that measured neural activities in response to continuum stimuli of vocalizations among individuals using fMRI, and the right inferior frontal cortex responded to changes in perceived identity (Latinus et al., 2011).
A few recent studies of non-human primates investigated brain activities of the individual recognition by using fMRI. The few neurons of prefrontal cortex in rhesus macaques responded to vocalizations from one caller and not to calls from other callers(Romanski et al., 2005). A previous study presented vocalizations of conspecifics and heterospecifics to awake monkeys, and suggested that activities of anterior temporal cortex was elicited by same types of vocalizations produced different individuals (Petkov et al., 2008).
1.8 Acoustic characteristics for individual discrimination of vocalizations
Humans can distinguish individuals and emotional state using F0s. In human speech, pitch can signify the emotional state of the speaker (Scherer, 1995). One study indicated that gender identification required F0 information in humans (Lass and Davis, 1976). Another study also showed that F0 information helped identify the speaker’s gender (Bachorowski and Owren, 1999).
Several monkey species have been shown to discriminate vocalizations using temporal structures of F0. Temporal structures of F0 contain information on vocalizations, because monkeys modify their vocalizations depending on different situations (Green, 1975). Trained Japanese macaques discriminated the peak positions of natural tonal vocalizations (Zoloth et al., 1979). Monkeys may categorically discriminate temporal structures of F0 (May et al., 1989).
Additionally, monkeys distinguish synthetic vocalizations of conspecifics using the peak positions of F0 (Hopp et al., 1992). Statistical analyses of the acoustic features of F0, such as the beginning frequency and maximum frequency, indicate that the F0 can be a reliable cue for identifying callers in several monkey species (Smith et al., 1982; Snowdon et al., 1983).
10
Chimpanzees could discriminate individuals based on the F0 of vocalizations (Kojima et al., 2003). In related research, Japanese macaques were trained to discriminate the vocalizations of different monkeys, and the subjects responded to the F0 as a discriminant stimulus for the task, suggesting that F0 contributes to individual discrimination (Ceugniet and Izumi, 2004).
Formant frequencies are necessary for speech recognition. Different vowels match different configurations of articulators that produce different formant frequencies. Formant frequencies create an important acoustic cue for the identification of vowels (Peterson and Barney, 1952).
Human listeners can obtain speech from sine-wave sounds consisting of three tone bursts following the first three formants (Remez et al., 1981). In addition, humans are also able to discriminate individuals based on whisper vocalizations (Tartter, 1991).
Many non-human primate species use formants to discriminate individuals in vocal communications. Vocal tract length is necessary to distinguish individual talkers in human speech (Bachorowski and Owren, 1999). Formants related to vocal tract length were used to discriminate alarm vocalizations in a manner similar to that used in humans for the identification of speech (Owren, 1990). Similar to humans, trained Japanese macaques exhibit great sensitivity to different formant frequencies (Sommers et al., 1992). Characteristics of formants contributed to individual differences (Rendall, 2003). Non-human primates were able to discriminate formant changes in species-specific vocalizations (Fitch and Fritz, 2006). Gahazanfar et al. (Ghazanfar et al., 2007) used a preferential looking paradigm; they suggested that formants in monkeys acted as indexing cues of age-related size.
1.9 Remaining questions
Many studies have compared basic hearing abilities between humans and non-human primates in terms of psychoacoustics. However, these studies primarily assessed frequency discrimination limits. The vocalizations of primates contain spectro-temporal information (Fig. 1-1), but few studies have examined temporal resolution in monkeys.
Vocalizations of primates have complex acoustic characteristics (e.g., F0, VTC, and duration). Some studies have used sophisticated software to modify the vocalizations of primates
11
(McAulay and Quatieri, 1986; Narendranath et al., 1995; Veldhuis and He, 1996), but there are limits to changing acoustic parameters flexibly. The acoustic characteristics of vocalizations in non-human primates have been filtered and lengthened using software (Ceugniet and Izumi, 2004;
Fitch and Fritz, 2006). However, few studies have independently modified specific parameters of acoustic characteristics in the vocalizations of monkeys.
Several studies showed that the auditory and prefrontal cortex prefer species-specific vocalizations rather than heterospecific vocalizations or natural sounds (Romanski et al., 2005;
Petkov et al., 2008).However, few behavioural studies have investigated the differences of vocal processing between vocalizations of conspecific and heterospecifics.
The integration from multiple senses (e.g., visual, auditory) is necessary for the identification of particular individuals. Individual recognition of faces has been examined in many behavioral and neurophysiological studies. Several studies have assessed the acoustic characteristics used for individual discrimination, based on conspecific vocalizations, but acoustic characteristics used to discriminate individuals have been still yet to be discussed.
Many neurophysiological studies have investigated how neurons recognize facial characteristics. However, little is known about how neurons in the brain recognize individuals based on vocalizations.
1.10 Purposes
The aim of this dissertation was to investigate the vocal recognition in both Japanese macaques and humans. Primates have to perceive both the contents and the speakers of utterances from conspecific individuals or predators accurately, because they maintain social interactions and this increases their chances of survival and mating rates. In addition, studies with non-human primates are important to describe whether the voice recognition was evolutionarily maintained in primates.
In this thesis, regarding the basic abilities associated with vocal recognition, the temporal resolutions of amplitude modulations were compared between Japanese macaques and humans.
Moreover, regarding the higher cognition of hearing abilities, we determined important acoustic characteristics used by Japanese macaques and humans to discriminate individual monkeys.
12
1.11 Organizations of thesis
This thesis is organized as follows: the temporal resolutions of amplitude modulation in both humans and monkeys were compared in Chapter 2. Chapter 3 describes continuum vocalizations modified using auditory signal processing software. This chapter explains how both monkeys and humans perceive the morphed stimuli, and the acoustic characteristics were determined to discriminate monkeys based on vocalizations alone in Japanese macaques and humans. Chapter 4 explains the important acoustic features used by Japanese macaques to discriminate individuals.
Summaries of the main results and future research are presented in Chapter 5.
13
Chapter 2 Perception of amplitude-modulated broadband
noise: Comparisons between Japanese macaques (Macaca fuscata) and humans
2.1 Introduction
Quite a few studies have shown how humans perceive amplitude-modulated (AM) sounds (Viemeister, 1979). A major reason for us to investigate AM sound perception is to suggest that temporal changes in amplitude envelopes of sound may play important roles in speech perception.
For example, noise-vocoded speech sounds (synthesized speech sounds in which the speech signal is replaced by several bands of noise while the amplitude envelope is preserved) are able to create not only speech perception but also pitch accents (Shannon et al., 1995; Riquimaroux, 2006). Previous study using AM stimuli demonstrated that the auditory system of humans was better sensitive than that of monkeys (O'Connor et al., 2000). Recent studies by O’Connor and colleagues comparing rhesus macaques (Macaca mulatta) with humans showed that humans were better able to detect amplitude modulation (in noise bursts) when the modulation frequency was relatively low (less than 15 Hz) (O’Connor et al., 2011). The results suggested the existence of differences in the temporal processing between species in primates. Several human studies measuring the durations of syllabic segments of English and Japanese showed that the temporal modulations of languages peaked at ~3–10 Hz (Houtgast and Steeneken, 1985; Greenberg and Takayuki, 2004). Taken together, humans’ superiority in sensitivity for AM sounds might be required for speech perception, which involves processing sounds with low modulation frequencies.
Many studies have compared psychoacoustic differences directly between monkeys and humans using tone bursts to investigate their basic sensory abilities. Monkeys have better
14
sensitivity than do humans in the high-frequency range (Japanese macaques: 0.028–34.5 kHz;
humans: 0.031–17.6 kHz Owren et al., 1988). Additionally, the ‘best’ frequency for Japanese macaques differed from that for humans (Japanese macaque: 1 kHz: humans: 4 kHz, Jackson et al., 1999). A previous study using pure-tone bursts revealed that the frequency discrimination limits of humans were approximately seven-fold smaller than those of monkeys (Sinnott et al., 1985; Prosen et al., 1990). In addition to frequency discrimination, the sensitivity of intensity limits was worse in monkeys than in humans (Sinnott et al., 1985). These studies indicated that non-human primates and humans differ in their basic hearing abilities.
In this study, we used Japanese macaques (Macaca fuscata) and humans as subjects.
Although Japanese macaques and rhesus macaques are in the same genus (macaca), the species differ in their vocalization behaviors (Owren et al., 1993) and their hearing sensitivity (Heffner, 2004). To date, however, no study has compared Japanese macaques to humans in terms of sensitivity to AM sound with low modulation frequency.
The sensitivities to detect amplitude modulation (in noise bursts) in Japanese macaques and humans were examined by using standard Go/NoGo operant conditioning. Subjects were trained to discriminate continuous and repetitive white noise bursts, and their sensitivities were quantified using AM noise with various modulation depths. The results may provide a better understanding of differences in auditory temporal perception between humans and non-human primates.
15
2.2 Materials and Methods
2.2.1 Subjects
Two male Japanese macaques (Macaca fuscata) and three male humans, aged 21–22, participated in the experiment. Monkey 1 was 7 years old and Monkey 2 was 10 years old. Each animal was individually kept in a primate cage with constant light/dark cycles of 13/11 h. Their access to liquids was limited for 24h as water served as positive reinforcement in the experiments. Monkeys got total 500 ml fruits juice both during training and after training. All experiments were conducted in accordance with the guidelines approved by the Animal Experimental Committee of Doshisha University and the ethics board of Doshisha University.
2.2.2 Experimental apparatus
Figure 2-1 shows experimental settings. All trainings and tests were conducted in a sound- attenuated room (1.70 × 1.85 × 2.65 m). A loudspeaker (P-610MB, Diatone, Japan) was positioned 68 cm in front of the subject’s head. The frequency response of the speaker was flattened (± 3 dB) between 0.1 kHz and 18 kHz using a graphic equalizer (GQ2015A, Yamaha, Japan). The equalized stimuli were amplified (SRP-P2400; Sony, Tokyo, Japan). A white light-emitting diode (LED) was placed on the top of the loudspeaker and was turned off during breaks in operant conditioning. In addition to LED, a charge-coupled device (CCD) video camera was attached to monitor the experiment of monkeys.
2.2.3 Stimuli
Two types of white noise bursts were used as discriminative stimuli. The Go stimulus (S+) was a 500 ms continuous white noise burst with 10 ms linear rise/fall times presented with sound pressure level (re: 20 μPa) of 60 dB in Fig. 2-2 and 2-3. The NoGo stimulus (S-) consisted of three repetitive white noise bursts having the same total duration (500 ms) as S+ with two 50 ms silent gaps in Fig. 2-2 and 2-3. Detailed temporal profiles of the stimuli are shown in Fig. 2-2B.
16
All sound stimuli were created by using Cool Edit 2000 (Syntrillium Software) with 44.1 kHz sampling and 16 bit resolution.
Test stimuli were 500 ms AM white noise bursts in which the modulation depths of two sections, corresponding to the silent portions of S-, varied (Fig. 2-2B, test stimulus). Five different modulation depths (11, 29, 50, 75, and 87 %) were presented as test stimuli (Fig. 2-3B). Each type of test stimuli was presented for five times.
2.2.4 Procedure
Figure 2-4 shows training and test procedures. Two male monkeys and three male humans were trained to discriminate between continuous (Go stimulus: S+) and repetitive (NoGo stimulus: S-) white noise bursts with standard Go/NoGo operant conditioning. The subjects had to depress a lever for 200 ms to begin a trial. During training trials, S- was repeated 3–5 times, and then either S- or S+ was presented as a discriminative stimulus (Fig. 2-4). The inter-onset interval between adjacent stimuli was 1000 ms. When S+ was presented as the discriminative stimulus, the subjects had to release the lever within 1000 ms from the offset of S+ (Fig. 2-4A); when they did so, the reaction was scored as a “hit.” If S- continued as the discriminative stimulus (Fig. 2-4B), the subjects had to keep depressing the lever to record a “correct rejection.” Monkeys got about 1 mL of fruit juice with 80% probability at both hits and correct rejections. If the subjects failed to release the lever within 1000 ms after the offset of S+, a “miss” was scored. If the subjects released the lever during S- presentation or within 1000 ms after the offset of S-, a “false alarm” was scored.
Misses and false alarms were penalized with a 3–5 s timeout, where the LED was turned off and the start of the next trial was delayed by timeout. In monkey experiment, each training session consisted of 400 trials, in which 200 Go trials and 200 NoGo trials were randomly placed. In human experiment, each training session was constituted by 20 trials, in which 10 Go trials and 10 NoGo trials were randomly ordered. Performance was measured by the correct response percentage (CRP: the total percentage of hits and correct rejections per total trials) and the reaction time (RT: latency from stimulus offset to lever-release). After verifying that the CRP exceeded 80 % for two consecutive sessions, the subjects proceeded to test sessions in which 10 % of all
17
trials were test trials, whereas half of the remainder (45 %) were Go trials and other half (45 %) were NoGo trials; all trials were ordered randomly. A test stimulus was presented after S- was repeated 4 times. No feedback (reward or punishment) followed the response to test stimuli. If the subjects did not release the lever within 1000 ms response period, we recorded reaction time as 1000 ms. We measured Go response rates and reaction times to stimuli in all subjects. We examined the sensitivity of amplitude modulation of humans by using same procedure of monkeys.
However, no juice was given to human subjects.
18
2.3 Results
2.3.1 Training
Monkey 1 and Monkey 2 needed 9 and 7 days of trainings respectively to learn to distinguish between the sets of cooAs and cooBs. Two days before the test day, the monkeys scored correct response rates (CPRs) of 82% and 87%. The day before the test day, the CPRs were 83% and 95%. The animals successfully learned to discriminate between continuous and repetitive white noise bursts. The CRP of Monkey 1 was 83 % and that of Monkey 2 was 92 % during test sessions.
The CRPs of all humans were higher than 95 % (Human 1: 97 %, Human 2: 100 %, and Human 3: 97 %). Go response rates to training stimuli (both S+ and S-) in test sessions did not statistically differ from those in training sessions, suggesting that both monkeys and humans were maintaining the same discriminatory performance in response to training stimuli throughout the experiment.
2.3.2 Amplitude modulation depth
Go response rates to types of test stimuli for two monkeys are shown in Figure 2-6. Go response rate at 75% of modulation depth was below 50% in Monkey 1, whereas Go response rate of monkey 2 did not decrease at several types of modulation except the 99% of modulation depth (Fig. 2-5). In two humans, Go response rates to stimuli were below 50 % at 27% of modulation depth, and Go response rates of one human was below 50 % at 50% of modulation depth (Fig. 2- 6).
In addition to Go response rates, Figure 2-7 shows reaction times to training and test stimuli in two monkeys. The reaction times of two monkeys were lengthen along the increase of modulation depth. In addition to monkeys, the reaction times of all humans were longer depending on the increase of modulation depth (Table 2-1). The average reaction time to the S+ stimulus differed between Monkey 1 (75 ms) and Monkey 2 (254 ms), and that of humans also varied among individuals (Human 1: 110 ms, Human 2: 362 ms, Human 3: 256 ms; Table 2-1). Thus, the reaction times to different stimuli (white noise bursts with different modulation depths) were normalized into z-scores based on the average and standard deviation of the reaction time to S+
19
(Fig. 2-8, modulation depth = 0 %) within each subject to examine interspecies and inter-subject differences in a standardized manner. The z-scores of reaction times to test stimuli with different modulation depths in each monkey are shown in Fig. 2-8. In all subjects (monkeys and humans), the z-scores increased as the modulation depth increased (Fig. 2-8, Table 2-1), suggesting that less modulated noise bursts tended to be perceived more similar to continuous noise bursts (i.e., S+).
That is, monkeys and humans depressed the lever longer as the amplitude modulation deepened.
A z-score of 1.96, corresponding to p = 0.05, was used as a criterion to estimate the ability to detect the change between continuous and repetitive white noise bursts. The z-scores surpassed the criterion (1.96) when the modulation depth became greater than 75 % in both monkeys (at 75 %: Monkey 1, z = 1.96, p = 0.05 and Monkey 2, z = 2.57, p = 0.01), whereas the z-scores exceeded the criterion at an average of 27 % in humans (Human 1: 11 %, Human 2: 29 %, Human 3: 50 %). Thus, monkeys were worse than humans, by 8.9 dB (humans: 27 % vs. monkeys: 75 %), in detecting amplitude modulation.
20
2.4 Discussion
2.4.1 Individual differences in monkeys
The reaction time of Monkey 1 was shorter than that of Monkey 2 for all test stimuli (Table 2-1).
The individual differences might have been caused by differences learning strategies. Specifically, Monkey 1 might have learned to release the lever after the stimuli that were not S-, meaning that he enacted Go responses to stimuli that differed from S-; on the other hand, Monkey 2 might have learned to release the lever after a continuous white noise burst (S+), meaning that he enacted Go responses to stimuli resembling to S+. However, the z-scores (normalized to the reaction time to S+) of Monkey 1 were similar to those of Monkey 2 (Fig. 2-9), suggesting that the reaction times were consistent when measured for their perception (Pfingst et al., 1975a; Pfingst et al., 1975b).
2.4.2 Sensitivities of AM broad-band noise in monkeys and humans
A previous study comparing rhesus macaques (Macaca mulatta) to humans with sinusoidal AM broadband noise showed that humans had better sensitivity in detecting amplitude modulation when the modulation frequency was low (less than 15 Hz). The difference in depth sensitivity reached about 9 dB at 5 Hz (O’Connor et al., 2011). The superiority in sensitivity might be related to humans’ need to process 3–10 Hz amplitude modulation for speech perception (Houtgast and Steeneken, 1985; Greenberg and Takayuki, 2004). We used about 6 Hz AM white noise bursts and demonstrated that humans were better able, by 8.9 dB, to detect the modulation. Whereas there are many methodological differences between our experiment and previous studies (O’Connor et al., 2011) our results showed the same trend regarding species differences between humans and macaques. In conclusion, this experiment strengthens the idea that humans are better able to detect amplitude modulation in low modulation frequencies than are macaques.
21
Chapter 3
Acoustic characteristics used for the discrimination of individuals based on vocalizations in Japanese macaques and humans
3.1 Introduction
Many primates, including humans, are able to distinguish a speaker based on vocalizations alone.
Previous studies showed that mothers could distinguish the voices of their own infants from those of other juvenile individuals in Saimiri sciureus (Kaplan et al., 1978), Chlorocebus pygerythrus (Cheney and Seyfarth, 1980), Macaca fuscata (Pereira, 1986), and Macaca mulatta (Jovanovic et al., 2000). A previous study presented monkey contact voices from a hidden speaker, and the pygmy marmosets recognized other group members as individuals (Snowdon and Cleveland, 1980). Another study using a habituation–dishabituation paradigm showed that rhesus macaques were also able to discriminate the species-specific vocalizations of kin from the those of non-kin (Rendall et al., 1996). Humans can discriminate speakers not only by natural speech but also by whispered speech (Tartter, 1991). Other studies suggested that listeners were able to determine individuals vocally by sine-wave sentences based on speech (Fellowes et al., 1997; Remez et al., 1997). Together, these studies indicate that the identification of individuals by their vocalizations is important in many primates.
Many studies have also examined visual recognition, especially faces, in primates using both behavioral and neurophysiological approaches. In these studies, intermediate morphs that have subtle variations have been used to examine sharp transitions in perception. Previous studies generated gradually changing continuous stimuli between the faces of two humans, and it was shown that humans could classify the morphed intermediates as one or the other face (Leopold et al., 2001; Webster et al., 2004; Furl et al., 2007). In a neurophysiological study, such morphed
22
stimuli were used for investigating how neurons respond to visual features. Other studies, using such stimuli as a series of faces and 3D objects, examined how neurons recognize complex visual features (Freedman et al., 2001; 2003; Leopold et al., 2006; Sigala et al., 2011).
In addition to facial perceptions, such approaches using continuum stimuli have been used to examine transitions in perceptions in psychoacoustics. In previous studies in which formant frequencies were changed gradually, American subjects were able to distinguish ‘r’ and ‘l’ by the slight change in formant frequencies (Miyawaki et al., 1975). Kuhl and Padden (1982) generated continuum phonetic voice samples from humans, and showed that non-human primates categorized the phonetic voice of humans using the second formant. Another study generated gradual temporal structures of vocalizations in monkeys, and it was shown that monkeys used temporal structures to discriminate conspecific communication calls (May et al., 1989). Another study compared the transitions of perception in the discrimination of /ra-la/ in both humans and monkeys (Sinnott and Brown, 1997). Continuum stimuli of vocalizations among different individuals have also been evaluated in humans (Chakladar et al., 2008).
Several studies compared the sensitivities of psychoacoustics between humans and monkeys using synthetic vocalizations. A behavioral study suggested that humans and monkeys exhibit different speech processing, even though the monkeys were able to discriminate phoneme stimuli between /ba/ and /da/ (Sinnott et al., 1976). One study compared the difference in sensitivity between humans and monkeys using a continuum of voice onset times (VOTs) in English; it was suggested that the differences in sensitivity in discriminating pairs of syllables in VOT were worse in monkeys than in humans (Sinnott and Adams, 1987). These studies showed that that sensitivities of humans and monkeys differ.
Acoustic characteristics for discriminating individual primates have been investigated in many studies. Owren et al. (1997) analyzed the vocalizations of female chacma baboons (Papio ursinus) and reported that the acoustic features of vocal tract filtering may reflect individuality.
Bachorowski and Owren (1999) analyzed phonemes of speech in humans and showed that vocal tract filtering may contribute to identification of individuals. The resonance of vocal tract filtering may affect individual identification in rhesus macaques (Rendall et al., 1998) and lemurs (Gamba
23
et al., 2012). In addition to the formants, statistical analyses of the acoustic features of the F0, such as the beginning frequency and maximum frequency, indicate that the F0 can be a reliable cue for identifying callers in several monkey species (Smith et al., 1982; Snowdon et al., 1983).
Several studies have shown that auditory processing software can be used to modify the vocalizations of primates (McAulay and Quatieri, 1986; Narendranath et al., 1995; Veldhuis and He, 1996). Acoustic parameters of vocalizations were modified in non-human primates using auditory processing software (Fitch and Fritz, 2006). In other research, Japanese macaques were trained to discriminate the vocalizations of different monkeys, and the frequencies of the vocalizations were filtered and lengthened (Ceugniet and Izumi, 2004). However, this software is limited in terms of changing acoustic features flexibly.
STRAIGHT (Speech Transformation and Representation based on Adaptive Interpolation of weiGHTed spectrograms) can create a F0-independent spectral envelope that represents vocal tract information, independent of its source (Kawahara et al., 1999a). F0 and VTC were manipulated independently using STRAIGHT; it was shown that VTC contributed to the detection of speaker body size (Smith and Patterson, 2005). Another study modified only the formant structures of vocalizations in monkeys (Ghazanfar et al., 2007). One study generated continuum vocalizations of monkeys between two individuals, and the authors presented the stimuli to humans (Chakladar et al., 2008). However, few studies have investigated transitions in perceptions to discriminate vocalizations of monkeys using continuum stimuli.
The purpose of this study was to investigate how monkeys respond to the continuum stimuli between two individuals using STRAIGHT. Additionally, in the present study, acoustic features for discriminating the vocalizations of two monkeys in monkeys and humans were determined.
Specifically, two monkeys and five humans were trained to discriminate the vocalizations of two monkeys. We generated two additional continuum stimuli in which only one acoustic feature, F0 or VTC, was modified from the two monkeys, while the other acoustic characteristics were maintained. In terms of behavior, the reaction times of all subjects were correlated significantly with the proportion of morphing. The reaction times in monkeys were correlated with the rates of changes in F0 and VTC, whereas the reaction times in humans were correlated only with the rate
24
of modification of F0. These results suggest that the stimuli affected the perception of individuals systematically, and our data showed that humans and monkeys use different acoustic characteristics to discriminate the vocalizations of conspecifics and heterospecifics.
25
3.2 Materials and Methods
3.2.1 Subjects
Two male Japanese macaques and five humans (22–23 years old) were the subjects of these experiments. Monkeys 1 and 2 were 7 and 10 years old, respectively, at the time of testing. In addition, two monkeys were trained to discriminate continuous and repetitive white noise burst.
Each monkey was housed individually in a primate cage under a constant 13/11 h light/dark cycle.
Access to liquids was limited, because water served as a positive reinforcement in the experiments.
All experiments were conducted in accordance with the guidelines approved by the Animal Experimental Committee of Doshisha University and the ethics board of Doshisha University.
3.2.2 Apparatus
All training and tests were conducted in a sound-attenuated room (length × width × height: 1.70 m × 1.85 m × 2.65 m). In the experiments involving the monkeys, subjects were seated in a monkey chair equipped with a drinking tube and a response lever. In the experiments involving the human subjects, the same lever was attached to a desk, and the subject was seated in a standard laboratory chair in front of the desk. A loudspeaker (SX-WD1KT; Victor, Tokyo, Japan) driven by an amplifier (SRP-P2400; Sony, Tokyo, Japan) was positioned 58 cm in front of the subject’s head at the same height as the ears. The frequency response of the speaker was flattened (±3 dB) between 0.4 kHz and 16 kHz using a graphic equalizer (GQ2015A; Yamaha, Hamamatsu, Japan).
A white light-emitting diode (LED) and a charge-coupled device (CCD) video camera were attached to the top of the speaker. The LED was lit during the training and test sessions for lighting, and subjects were monitored using the CCD camera.
3.2.3 Acoustic stimuli
Sound stimuli were obtained from the two adult male monkeys (Monkeys A and B). Coo calls from Monkey A (cooA) and Monkey B (cooB) were recorded using a digital audio tape recorder (TCD-D8; Sony, Tokyo, Japan) and a condenser microphone (type 2142; Aco, Tokyo, Japan) at a
26
sampling rate of 44.1 kHz and a resolution of 16 bits. Prior to the experiment, the subjects (both monkeys and humans) did not hear the voices of the stimulus monkeys. Seven coo calls with a signal-to-noise ratio greater than 40 dB were selected randomly from the recorded sounds for use as stimuli.
Recorded coo calls (Fig. 3-1) were analyzed using a digital-signal-processing package (STRAIGHT, Kawahara et al., 1999b) to measure three acoustic parameters: the F0 (Fig. 3-2), VTC (frequency structure corresponding mostly to the resonance characteristics of the vocal tract;
Fig. 3-3), and the durations of the coo calls. Twelve coo calls (six per individual) were used as training stimuli (cooAs and cooBs; Fig. 3-1). One coo call from each monkey (cooA and cooB) was not played during training and was used to synthesize a test stimulus. Three continuum stimuli of coo calls were created using STRAIGHT. The program was used to break down a coo call into several acoustic parameters (F0 and VTC) and allowed us to manipulate the parameters independently of each other. For example, we could synthesize a coo call from 30% of the information from Monkey A (i.e., cooA) and 70% of the information from Monkey B (i.e., cooB) in one acoustic parameter (e.g., F0), while using no information from Monkey A in another parameter (e.g., VTC). A stimulus continuum, defined as a whole morph, consisting of cooA and cooB was created to comprise 10, 30, 50, 70, and 90% of cooB (Fig. 3-4). Each stimulus in the continuum contained equal F0 and VTC from cooB. We created two additional sets of continuum stimuli in which only one acoustic parameter, F0 or VTC, was changed from cooA to cooB, while the other acoustic feature stayed as Monkey B. Continuum stimuli, defined as the F0-morph, were created to comprise 10, 30, 50, 70, and 90% of F0 from cooB (Fig. 3-5), and another, defined as the VTC-morph, comprised 10, 30, 50, 70, and 90% of VTC from Monkey B (Fig. 3-6). Three different sound pressure level (SPL) stimuli were created for each stimulus type: 57, 60, and 63 dB SPLs (re: 20 μPa). All stimulus amplitudes were modified digitally and were calibrated (using a microphone: type 7016, Aco, Tokyo, Japan). The call durations were equalized to 517 ms (i.e., the average of all calls) via linear time-stretching or -compressing using STRAIGHT.
27
3.2.4 Procedure
Standard Go/NoGo operant conditioning was used. Figure 3-7 shows the schematized event sequence of the trials. Subjects were required to depress the lever switch on the monkey chair to begin the trial. Then, coo calls from the same subject, Monkey A or Monkey B, were presented randomly three to seven times. In the repetition, call types were selected randomly from 18 types of stimuli (1 individual × 6 types of coo calls × 3 intensities). The inter-stimulus interval between adjacent stimuli was 800 ms. While the calls from the same monkey were presented (NoGo trial), subjects were required to continue depressing the lever. When the stimulus was changed from one monkey to another (Go trial), subjects were required to release the lever within 800 ms from the offset of the stimulus. For example, a trial was started using the repeated playback of cooAs (NoGo stimulus). In the repetition, the cooA type (out of six) and the stimulus intensity (out of three: 57, 60, and 63 dB SPL) were changed randomly. The subjects were required to continue depressing the lever while cooA was repeated (correct rejection [CR]). When cooB (Go stimulus) was presented, the subjects were required to release the lever within 800 ms after the offset of cooB (Hit). Hits were reinforced by providing fruit juice (2 mL). When the subjects released the lever during the repetition period of the NoGo stimulus (false alarm) or failed to release the lever within 800 ms after the Go stimulus (miss), a 5–10 s timeout period accompanied by turning off the LED was provided as feedback. When the subjects responded successfully to the Go stimulus, the stimulus contingencies were reversed in the next trial. That is, the next trial was started using a playback of cooB instead of cooA, and the subject had to release the lever when cooA was played to receive the reward.
Performance was measured by the correct response percentage (CRP; total percentage of hits and CRs). In total, 130–180 Go trials (i.e., trials in which the stimulus changed from one monkey to the other) and 800–1000 NoGo trials were presented per day to both subjects.
After the monkey scores exceeded the CRP threshold (75%), the subjects proceeded to the test sessions. Test trials were conducted approximately every 10–20 training trials. A test stimulus was presented after cooB, repeated three to seven times, and each type of test stimulus was played six times. Neither reward nor punishment followed the test trial.
28
For the human subjects, no juice was given as a reward in the trials, and a CRP of 90% was used as the threshold for proceeding to the test session. Test trials were conducted every 5–10 training trials, and each type of test stimulus was presented five times.
3.2.5 Data analysis
We measured the Go response rates and reaction times of the subjects to test stimuli as the time interval between the end of each stimulus and the subjects releasing the lever switch. The coefficient of correlation (Spearman product-moment correlation coefficient) between reaction times and sets of continuum stimuli were calculated using commercial statistics software (SPSS;
IBM, New York, USA).
29
3.3 Results
3.3.1 Training results in each subject
Monkeys 1 and 2 required 20 and 21 days of training, respectively, to distinguish between the sets of cooAs and cooBs. Two days before the test day, the monkeys scored CRPs of 85% (Monkey 1: d’ = 1.81) and 91% (Monkey 2: d’ = 2.48). One day before the test day, the CRPs were 85%
(Monkey 1: d’ = 1.89) and 86% (Monkey 2: d’ = 2.09). The CRPs for all human subjects were >
90% during the training sessions. During the test period, the CRPs to training stimuli were > 75%
in both monkeys (Monkey 1: 86%; Monkey 2: 87%) and > 90% in all humans (Human 1: 98%;
Human 2: 98%; Human 3: 97%; Human 4: 94%; Human 5: 99%). The CRPs during the test period did not differ from those during the training sessions, indicating that the subjects maintained the same discriminatory performance as that with the training stimuli throughout the experiment.
3.3.2 Morphed stimuli between cooA and cooB: whole-morph
The Go response rates to the whole-morph stimulus continuum (whole morph) are shown in Fig.
3-8A. The Go response rates of Monkey 1 and humans decreased gradually with increasing morph proportion of test-cooB, but that of Monkey 2 did not decrease. The Go response rate of Monkey 1 decreased to < 50% when the morphing proportions increased to > 70%. In humans, average Go response rates decreased to < 50% when the morphing proportions increased to > 50%.
Figure 3-8B and Table 3-1 show the reaction times to the whole morph. Reaction times of both monkeys and humans increased gradually with the increase in morphing proportion. A significant positive correlation was observed between morphing proportions of cooB and reaction times to the stimuli in both monkeys and humans (Spearman correlation coefficients, Monkey 1:
r = 0.62, n = 42, p < 0.05; Monkey 2: r = 0.55, n = 42, p < 0.05; Humans: r = 0.84, n = 35, p <
0.05). Both monkeys and humans depressed the lever longer as the stimuli became more similar to the test-cooB.
30
3.3.3 Morphed F0 continuum results
The Go response rates of Monkey 1 and humans decreased gradually with the increase in morphing proportion of F0 from test-cooB, but that of Monkey 2 did not decrease (Fig. 3-9A).
The Go response rates of Monkey 1 decreased to < 50% when the morphing proportions of F0 from test-cooB increased to > 30%. In humans, the Go response rates decreased to < 50% when the morphing proportions increased to > 50%.
Figure 3-9B and Table 3-2 represent the reaction times to the F0-morph. The reaction times for each subject (in the two monkeys and two of the humans) increased as the proportions of F0 from test-cooB increased (Monkey 1: r = 0.50, n = 30, p < 0.05; Monkey 2: r = 0.46, n = 30, p <
0.05; Humans: r = 0.56, n = 25, p < 0.05). Both monkeys and humans depressed the lever longer as the stimuli of F0-morph became more similar to the test-cooB.
3.3.4 Morphed VTC continuum results
The Go response rate of Monkey 1 decreased with the increase in morphing proportion of VTC from test-cooB, while that of Monkey 2 did not decrease systematically and remained > 50% (Fig.
3-10A). In Monkey 1, the Go response rate decreased to < 50% when the morphing proportions of VTC of test-cooB increased to > 70%. In humans, the Go response rates remained < 50%
regardless of the morphing proportion in VTC-morph.
Figure 3-10B and Table 3-3 show the reaction times to the VTC-morph. The reaction times of both monkeys increased significantly as the contribution of test-cooB to the VTC increased (Monkey 1: r = 0.71, n = 30, p < 0.05; Monkey 2: r = 0.40, n = 30, p < 0.05), whereas the reaction times of humans were not correlated significantly with the morphing rate (Humans: r = 0.31, n = 25, p > 0.05), and remained constant over the VTC-morph continuum.
3.3.5 Comparison between monkeys and humans
Figure 3-11 shows the distributions of correlation coefficients in F0-morph and VTC-morph. The range of correlation coefficients for F0-morph was 0.46–0.50 in monkeys and 0.27–0.80 in
31
humans. The range of correlation coefficients for VTC-morph was 0.40–0.71 in monkeys and 0.00–0.48 in humans.